 Duplex
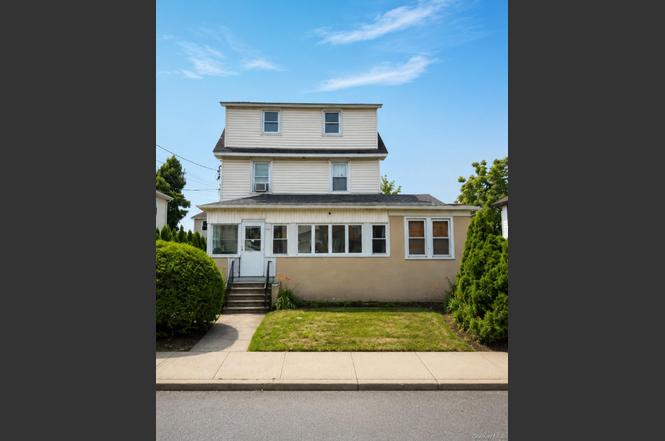
29 Loretta St · Inwood, NY
Flood risk 1/10 · Minimal
- FEMA flood zone
- X (unshaded)
- Chance of flooding over 30 yrs
- 0.0%
- Est. flood insurance / yr
- $473 – $860
Fire risk 1/10 · Minimal
- Est. fire insurance / yr
- $691 – $1,283
Heat risk 6/10 · Moderate
- Hot days now (above 95°F)
- 7 days/yr
- Hot days in 30 yrs
- 16 days/yr
Wind risk 8/10 · Major
- Chance of severe wind over 30 yrs
- 80.0%
Air-quality risk 4/10 · Minor
- Unhealthy air days now
- 4 days/yr
- Unhealthy air days in 30 yrs
- 6 days/yr
Risk factors via First Street. Map © Google.
Why this score? — see what drove the D+ grade
The composite is a weighted blend of 9 inputs, each scored 0–100. Each bar is that input's sub-score; the figure is the points it added to the 100-point composite (weight × sub-score).
- Cash flow +17.1/30.0
- ARV discount +7.5/15.0
- DSCR +5.3/10.0
- Schools +4.2/10.0
- 1% rule +4.1/10.0
- Livability +3.6/5.0
- Rent growth +2.5/5.0
- Condition / age +2.5/5.0
- Appreciation +0.0/10.0
$899,000
🖨 Deal sheet (PDF) 📄 Offer letter ✓ Due diligence
Multi-family units
County records classify this as Multi-Family (2-4 Unit). Listing-text estimate: 2 units. confirmed
Listing remarks
Opportunity knocks in the heart of Inwood! This spacious two-family property offers tremendous potential for investors, contractors, or end-users looking to create value through renovation. Features include a full basement, a long private driveway with parking for up to three vehicles, a detached garage, and a generous backyard/patio area perfect for outdoor enjoyment. Conveniently located near shopping, schools, parks, public transportation, and major roadways. Property is being sold strictly AS IS. A fantastic opportunity to restore, renovate, or reimagine this property in a desirable Nassau County location.
Key facts
- Private driveway
- Full basement
- Conveniently located
Tags
Property features AI
Exterior
- Parking: Driveway
- Utilities: Public sewer
- Home design: Duplex
- Construction: Block construction
- Exterior features: Block construction; Not waterfront
Interior
- Bedrooms: One 2-bedroom unit; One 3-bedroom unit
- Bathrooms: Two full bathrooms
- Heating & cooling: Central air conditioning; Oil heating
- Interior features: First-floor bedroom; Patio
Neighborhood map
What this means for you Summary
Snapshot
- This is a 2 × 3-bed/2.0-bath units multifamily listed at $899k.
Deal economics
- At list price, monthly cash flow is $630 ($8k/yr) — positive. Per door: $315/mo.
- The deal already cash-flows at list — no discount required.
- To meet the 1% rule (rent ≥ 1% of price), the offer needs to be $820k (8.8% below list).
- Recommended offer: $820k (8.8% below list) — sets the bar for 1% rule.
- Cap rate 7.1% vs local median 3.7% in Inwood — top-decile yield for the area; either an underpriced asset or a hidden risk that comps aren't pricing in. Stress-test before assuming the spread holds.
Location & tenants
- Location reads 71/100 on livability (#399 in NY) — a middle-class / working-renter tenant base. Strengths: commute A+, amenities A-, health & safety A-; Watch: cost of living F.
- Lawrence Union Free School District (suburban): math 43% / reading 46% proficiency, ranked #399 of 590 in NY (top 68%) — families likely to look elsewhere, expect single-tenant / working-renter base with shorter leases.
- Zoned schools: Lawrence Early Childhood Center At #4 School (145 students, 94% FRL); Lawrence Middle School At Broadway Campus (math 12% / reading 37%, grade F, #611 of 729 statewide, top 88%, 405 students, 79% FRL); Lawrence Senior High School (math 87% / reading 30%, grade C, #877 of 1,100 statewide, top 80%, 770 students, 70% FRL) — zoned schools average 81% FRL vs 52% district-wide (29 pts higher); higher-poverty schools than district average — tighter screening recommended.
- Market conditions: 28 active listings in the ZIP; 1 comparable units currently listed for rent nearby; 824 units permitted in Nassau County in 2024 (153 in 5+ unit buildings).
Forward outlook
- Local home prices are declining (-3.0%/yr); year-one equity from $6k of loan paydown is wiped out by about $27k of value loss. Plan a longer hold.
- Nassau County population projected at +7% by 2050 — modest demand growth; plan on rents tracking national, not racing it.
Negotiation context
- Only 2 days on market — expect competitive offers; lowballing is unlikely to land.
- Current owner paid $122k; list at $899k implies a 637% gain — meaningful room to come down on a strong offer.
Risks & watch-outs
- Watch-outs: built in 1908 — expect roof / HVAC / electrical / plumbing capex.
- Climate carrying-cost: severe wind risk, 80% chance of damaging wind over 30y; extreme-heat days projected 7→16/yr by 2055 (HVAC capex compounding) — expect insurance premiums to compound above CPI over the hold.
Questions for the listing agent
- Can we see the unit-by-unit rent roll, current vacancy, and any below-market leases? What's the average tenancy length?
- What capital expenditures (roof, boiler, parking lot, exteriors) have been made in the last 5 years, and what's planned in the next 2?
- Built in 1908 — when were the roof, HVAC, electrical panel, plumbing, and water heater last replaced?
- Is there a deadline driving the sale (1031 exchange, divorce, estate, relocation)? That informs how much negotiation room exists.
- Schools are D-rated, which usually means shorter tenancies and higher turnover. Who's the typical renter profile here, and what's been the actual vacancy rate?
- The area grade is low — what's the realistic commute time and amenity access for the typical tenant pool here? Any planned neighborhood developments (good or bad) we should know about?
- What's the average days-on-market for RENTAL listings here right now (not sales)? A rising rental-DOM trend means longer vacancies and softer asking-rent achievability than the comps imply.
- What's the recent tenant-quality profile in this submarket — average credit score on applications, eviction rate, late-payment / NSF rate, and stable-employment percentage? A property-management company in the area should have these aggregated.
- How much new apartment / multifamily construction is in the pipeline within 1–3 miles? Heavy new supply (>2% of stock underway) typically softens rents 12–24 months out; light construction supports rent growth.
Investment metrics
- 1% rule
- 0.91% ✗
- Cap rate
- 7.13%
- Cash-on-cash
- 3.00%
- DSCR
- 1.13
- GRM
- 9.1
CMA / ARV
No comps found within radius.
Projected returns pro-forma
-3.0% appreciation · 3.0% rent growth · sell at horizon
- IRR
- -11.6%
- Equity multiple
- 0.58×
- Total profit
- $-105,661
- Equity at exit
- $134,044
- IRR
- -2.4%
- Equity multiple
- 0.84×
- Total profit
- $-40,755
- Equity at exit
- $77,729
Cash invested: $251,720 (down + closing). Projections, not guarantees.
Landlord ↔ Tenant lean methodology
- Overall (STATE)
- 15 Strongly Tenant-Friendly
- State New York
- 15 Strongly Tenant-Friendly · D+10
- County
- — inherits STATE
- City
- — inherits STATE
ZIP-level market 11096
- Home prices YoY
- -13.8%
- Active inventory
- 28
- Price-to-rent
- 18.3×
Monthly cashflow live
- Estimated rent
- $8,203 medium interval (Pro) →
- Mortgage (P&I)
- −$4,714
- Tax from tax record
- −$761 /mo · $9,138/yr
- Insurance
- −$375
- HOA
- −$0
- Vacancy / Maint / Mgmt
- −$1,723
- Net cashflow
- $630
Break-even live
Sensitivity live
| Price | -10% $1,139 | -5% $884 | +0% $630 | +5% $375 | +10% $121 |
|---|---|---|---|---|---|
| Rent | -10% $-18 | -5% $306 | +0% $630 | +5% $954 | +10% $1,278 |
| Rate | -1.0pp $1,083 | -0.5pp $858 | base $630 | +0.5pp $397 | +1.0pp $160 |
2-unit breakdown (identical units grouped — click to expand)
| Units | Beds | Baths | Est. rent |
|---|---|---|---|
| 2× units | 3 | 2 | $8,204 |
| #1 | 3 | 2 | $4,102 |
| #2 | 3 | 2 | $4,102 |
| Total (2 units) | $8,203 | ||
UW: 25.0% down · 7.5% · 30yr · 1.5% tax · 5.0% vac · 8.0% maint · 8.0% mgmt
Financing live
Cash to close
- Down payment
- $224,750
- Closing costs
- $26,970
- Reserves months
- —
- Total cash needed
- —
Loan-product check · same deal, 3 products live
Conventional
25% down · 7.5% · 30yr
- Down + closing
- —
- Monthly P&I
- —
- Monthly cashflow
- —
- DSCR
- —
- Eligible?
- —
Personal DTI + credit; lowest rate.
DSCR
20% down · 8.5% · 30yr
- Down + closing
- —
- Monthly P&I
- —
- Monthly cashflow
- —
- DSCR
- —
- Eligible?
- —
No personal income docs; deal must DSCR.
Hard money
10% down · 12.0% · 12mo
- Down + closing
- —
- Monthly P&I
- —
- Monthly cashflow
- —
- DSCR
- —
- Eligible?
- —
Short-term bridge; refi at stabilization.
Rent comps 1 comps
| Address | Beds | Baths | Sqft | Rent | $/sqft | DOM | Units | Dist |
|---|---|---|---|---|---|---|---|---|
| 94 Roger Ave Inwood, NY | 5.0 | 3.0 | 2328 | $4,800 | $2.06 | 45d | 1 | 0.92mi |
Listing history 2 events
-
2026-06-21remarks 617-char remark
-
2026-06-21$899,000 Active 2 DOM
ⓘ Source: listings_history table (triggers on properties + properties_extension) + one-shot
backfill from property_details.listing_events for pre-trigger history.
Tax reassessment forecast NY · Partial reset (capped growth)
- Current annual tax
- $9,138 · $761/mo
- Projected year-2 tax
- $12,166 · $1,014/mo
- Expected delta
- +$3,028/yr (+$252/mo · 33.1%)
ⓘ Screening estimate from a state-policy table — verify with the county assessor before closing.
Climate risk First Street
- Flood 1/10 Low FEMA zone X (unshaded) · 0% chance over 30 yrs
- Wildfire 1/10 Low
- Heat 6/10 Major 7 d/yr ≥95°F today · 16 d/yr by 30 yrs out
- Wind 8/10 Severe 80% chance of damaging wind over 30 yrs
- Air quality 4/10 Moderate 4 unhealthy d/yr today · 6 by 30 yrs out
Nearby sold comps map
Loading sold comps map…
Walkable amenities ~0.75 mi
Loading nearby amenities…
Taxation est. · year 1
- Rental income
- $98,436
- − Mortgage interest
- −$50,358
- − Property taxes
- −$9,138
- − Insurance
- −$4,495
- − Repairs & maintenance
- −$7,875
- − Management
- −$7,875
- − Depreciation
- −$26,153
- Taxable loss
- −$7,457
- Est. tax savings @ 24.0%
- +$1,790
- After-tax cash flow
- $9,348/yr
For passive investors: Depreciation is non-cash, so a rental often shows a tax loss while cash-flowing — sheltering income. Rental losses are passive: they offset passive income freely, and up to $25,000/yr can offset ordinary (W-2) income if you actively participate and your MAGI is under $100k (phasing out to $0 by $150k); unused losses carry forward. On sale, claimed depreciation is recaptured at up to 25%, and gains may owe capital-gains tax (a 1031 exchange can defer both). Figures are a year-1 estimate at your 24.0% rate — not tax advice; consult a CPA.
Schools (NCES district)
- District
- Lawrence Union Free School District
- NCES district ID
- 3616830
- Math proficiency
- 43% ▼ -2.00%
- Reading proficiency
- 46% ▼ -8.00%
- Median HH income
- $91,008
- Composite
- 42.14/100
- National rank
- #3307
- State rank
- #399 of 590 in NY
Livability — Inwood
- Score
- 71/100
- State rank
- #399
- US rank
- #6565
Category grades
Schools grade is shown separately in the Schools card above.
Census & demographics
- Census place
- Inwood, NY
- City population
- 9,897
- Population (ZIP)
- 9,897
Population outlook (Nassau County) Hauer SSP2
- Today (2025)
- 1,409,302 people
- By 2030
- 1,431,482 · +1.6%
- By 2040
- 1,471,607 · +4.4%
- By 2050
- 1,502,845 · +6.6%
- By 2075
- 1,575,403 · +11.8%
- By 2100
- 1,554,356 · +10.3%
Race, ethnicity, and origin ACS 2023
- Neighborhood character
- Diverse neighborhood (Simpson 0.67)
- Race & ethnicity
- Hispanic / Latino 47% White 30% Black 14% Asian 8% Two or more races 8%
- Hispanic origin (detail)
- Mexican 3% Dominican 2%
- Common ancestry
- Italian 2% Romanian 1% Hispanic 1%
- Foreign-born
- 43% · Canada, South Korea
- Languages at home
- 38% English-only · Spanish 42% Other Indo-European 8% French/Haitian/Cajun 4%
Political lean MEDSL · Nassau
- 2024 margin
- Toss-up / Even · D 47.9% · R 52.1%
- 2008→2024 swing
- -12.6pp toward R · 2008: 8.4pp · 2024: -4.2pp
- All cycles
- 2024: R+4.2 2020: D+9.5 2016: D+5.3 2012: D+6.7 2008: D+8.4
Not yet ingested
- Civics
- —
Market trends
- HPI YoY
- ▼ -66.48%
- Current HPI
- 415.4969
- Rent YoY
- —
- Metro
- —
- State GDP YoY
- ▲ 2.60%
- F500 in state
- 92
Industry mix (Fortune 500 HQ in NY)
| Industry | F500 HQs | Revenue |
|---|---|---|
| Financial Services | 10 | $950B |
|
||
| Consumer Goods | 9 | $162B |
|
||
| Insurance | 4 | $225B |
|
||
| Telecommunications | 2 | $144B |
|
||
| Pharmaceuticals | 2 | $112B |
|
||
| Media / Entertainment | 2 | $69B |
|
||
Price history
+636.9% since first listed2 events — show timeline
- 2026-06-15 Listed $899,000 OneKey® MLS as Distributed by MLS Grid
- 1993-09-01 Sold (Public Records) $122,000 Public Records
Property tax history
+2.4%/yrLatest (2024): $9,138 · +0.4% YoY. Source: county tax records.
Cash-flow waterfall
monthlySold comps — $/sqft
last 12 mo · ≤1 miLoading sold comps…