 🏗️ New Construction
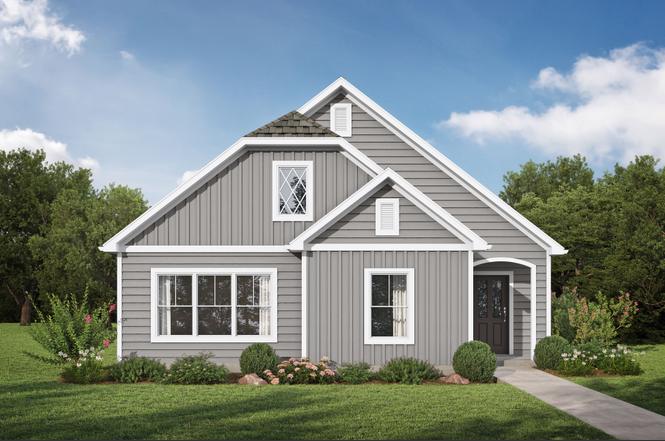
Lauderdale I Plan · Freeport, FL
Flood risk 1/10 · Minimal
- FEMA flood zone
- X (unshaded)
- Chance of flooding over 30 yrs
- 0.0%
- Est. flood insurance / yr
- $507 – $1,088
Fire risk 6/10 · Moderate
- Est. fire insurance / yr
- $947 – $1,759
Heat risk 10/10 · Severe
- Hot days now (above 106°F)
- 7 days/yr
- Hot days in 30 yrs
- 23 days/yr
Wind risk 9/10 · Severe
- Chance of severe wind over 30 yrs
- 99.0%
Air-quality risk 1/10 · Minimal
- Unhealthy air days now
- 0 days/yr
- Unhealthy air days in 30 yrs
- 0 days/yr
Risk factors via First Street. Map © Google.
Why this score? — see what drove the D grade
The composite is a weighted blend of 9 inputs, each scored 0–100. Each bar is that input's sub-score; the figure is the points it added to the 100-point composite (weight × sub-score).
- Appreciation +10.0/10.0
- ARV discount +7.5/15.0
- Cash flow +7.0/30.0
- Schools +5.2/10.0
- Livability +3.4/5.0
- 1% rule +2.7/10.0
- Rent growth +2.5/5.0
- Condition / age +2.5/5.0
- DSCR +1.2/10.0
$344,850
🖨 Deal sheet 📄 Offer letter ✓ Due diligence
Listing remarks
The Lauderdale I. You are going to LOVE this home! From the moment you step inside you feel the spaciousness of the vaulted ceiling in the main living area. The open layout of the family, dining & kitchen area provides for the best gatherings with friends & family. Come together around the quartz island in the kitchen or step outside the family room to the huge covered porch. Your secluded primary suite features a trey ceiling, separate tub & shower, dual sinks and large walk-in closet. On the other side of the home you find 2 bedrooms with trey ceilings and a full bathroom. Rear entry garage & quartz countertops throughout the home. Photos/videos of a similar home,
Key facts
- Quartz island
- Vaulted ceiling
- Open layout
Tags
Property features AI
Finance
- Other: Address: Lauderdale I Plan, Freeport, FL 32435; Listing status: Active; List price provided (not included here per instructions)
- HOA & community: Association fee of 200 (frequency not specified)
Exterior
- Parking: 2 parking spaces
- Utilities: Has heating; Has cooling
- Home design: Single-family plan (Lauderdale I)
Interior
- Bedrooms: 3 bedrooms
- Bathrooms: 2 full bathrooms
- Heating & cooling: Forced air heating; Central air conditioning
- Interior features: Plan: Lauderdale I (new construction plan); Living area of 1,828
Neighborhood map
What this means for you Summary
Snapshot
- This is a 3-bed/2.0-bath single-family listed at $345k.
Deal economics
- At list price, monthly cash flow is $-487 ($-6k/yr) — negative.
- To cash-flow at today's rent, offer at most $260k (24.5% below list).
- To meet the 1% rule (rent ≥ 1% of price), the offer needs to be $253k (26.6% below list).
- Recommended offer: $253k (26.6% below list) — sets the bar for 1% rule.
- Cap rate 4.5% vs local median 3.0% in Freeport — top-decile yield for the area; either an underpriced asset or a hidden risk that comps aren't pricing in. Stress-test before assuming the spread holds.
Location & tenants
- Location reads 68/100 on livability (#520 in FL) — a middle-class / working-renter tenant base. Strengths: crime A+, housing A+, employment B+; Watch: health & safety C-, amenities F, commute F.
- Walton (rural): math 62% / reading 61% proficiency, ranked #10 of 73 in FL (top 14%) — acceptable for families but not a draw, mixed tenant base, ~2y average lease.
- Market conditions: 122 active listings in the ZIP; 9 comparable units currently listed for rent nearby; rentals at typical pace (median 21d on market — plan ~3-4 weeks tenant-placement turnaround); 2,883 units permitted in Walton County in 2024 (1,322 in 5+ unit buildings).
Forward outlook
- In year one you build about $35k of equity ($2k loan paydown + $33k appreciation (10.0% local appreciation)).
- Walton County population projected at +46% by 2050 — long-run rental-demand tailwind backs the buy-and-hold thesis.
- By year 2, paydown + projected appreciation supports a ~$57k cash-out refi (75% LTV) — recoverable capital for the next deal without selling this one.
Negotiation context
- It's been on market 139 days — a 12% lower offer ($303k) is reasonable based on typical stale-listing flexibility.
Risks & watch-outs
- Climate carrying-cost: severe wind risk, 99% chance of damaging wind over 30y; major wildfire risk; extreme-heat days projected 7→23/yr by 2055 (HVAC capex compounding) — expect insurance premiums to compound above CPI over the hold.
Questions for the listing agent
- What do current leases actually rent for vs. the listed asking? Can we see a recent rent roll and the last 12 months of T-12 income?
- It's been on market 139 days. Have you received any prior offers? Is the seller open to a 27% concession, seller financing, or rate buy-down credit?
- What does the HOA fee cover, when was the last increase, and are there any pending special assessments or reserve-fund shortfalls?
- Why hasn't it sold? Are there any deal-killer items the seller is aware of (foundation, flood, title, zoning, code violations)?
- Is there a deadline driving the sale (1031 exchange, divorce, estate, relocation)? That informs how much negotiation room exists.
- The area grade is low — what's the realistic commute time and amenity access for the typical tenant pool here? Any planned neighborhood developments (good or bad) we should know about?
- What's the average days-on-market for RENTAL listings here right now (not sales)? A rising rental-DOM trend means longer vacancies and softer asking-rent achievability than the comps imply.
- What's the recent tenant-quality profile in this submarket — average credit score on applications, eviction rate, late-payment / NSF rate, and stable-employment percentage? A property-management company in the area should have these aggregated.
- How much new for-sale + rental construction is in the pipeline within 1–3 miles? Heavy new supply typically softens prices + rents 12–24 months out; constrained supply supports both.
Investment metrics
- 1% rule
- 0.77% ✗
- Cap rate
- 4.53%
- Cash-on-cash
- -6.30%
- DSCR
- 0.72
- GRM
- 10.9
CMA / ARV
- ARV (on-the-fly)
- $330,868
- Comps found
- 12
Show comp detail 12 sales within ~0.75 mi
| Address | Dist | Beds/Ba | Sqft | Sold | Price | $/sf | Match |
|---|---|---|---|---|---|---|---|
| 165 Sweetclover St | 0.29mi | 3/2.0 | 1,828 (0%) | 1mo | $339,850 | $186 | 86 |
| 216 Huckleberry St | 0.14mi | 3/2.0 | 1,682 (-8%) | 1mo | $322,100 | $191 | 79 |
| 214 Sweetthorn St | 0.37mi | 3/2.0 | 1,822 (-0%) | 4mo | $328,600 | $180 | 79 |
| 57 Huckleberry St | 0.29mi | 3/2.0 | 1,720 (-6%) | 4mo | $335,467 | $195 | 74 |
| 41 Woodsorrel St | 0.20mi | 3/2.0 | 1,682 (-8%) | 5mo | $299,900 | $178 | 73 |
| 104 Sweetthorn St | 0.34mi | 3/2.0 | 1,720 (-6%) | 3mo | $330,175 | $192 | 72 |
| 226 Huckleberry St | 0.34mi | 4/2.5 (+1) | 1,963 (+7%) | 4mo | $337,900 | $172 | 62 |
| 11 W Gray Owl Dr | 0.71mi | 4/2.0 (+1) | 1,856 (+2%) | 2mo | $327,900 | $177 | 57 |
| 47 E Gray Owl Dr | 0.74mi | 4/2.0 (+1) | 1,856 (+2%) | 1mo | $336,367 | $181 | 57 |
| 31 E Gray Owl Dr | 0.73mi | 4/2.0 (+1) | 1,856 (+2%) | 2mo | $341,284 | $184 | 57 |
| 206 Huckleberry St | 0.32mi | 4/3.0 (+1) | 2,038 (+12%) | 1mo | $286,848 | $141 | 56 |
| 24 W Gray Owl Dr | 0.73mi | 4/2.0 (+1) | 1,856 (+2%) | 5mo | $318,900 | $172 | 55 |
Match score weights: distance 35% · size 25% · config 20% · recency 20%. Top-matched comps best support the ARV.
Projected returns pro-forma
10.0% appreciation · 3.0% rent growth · sell at horizon
- IRR
- 19.8%
- Equity multiple
- 2.61×
- Total profit
- $149,367
- Equity at exit
- $298,072
- IRR
- 18.2%
- Equity multiple
- 6.01×
- Total profit
- $464,554
- Equity at exit
- $642,804
Cash invested: $92,643 (down + closing). Projections, not guarantees.
Landlord ↔ Tenant lean methodology
- Overall (STATE)
- 87 Strongly Landlord-Friendly
- State Florida
- 87 Strongly Landlord-Friendly · R+3
- County
- — inherits STATE
- City
- — inherits STATE
ZIP-level market 32435
- Home prices YoY
- 4.0%
- Active inventory
- 122
- Price-to-rent
- 11.4×
Monthly cashflow live
- Estimated rent
- $2,532 high interval (Pro) →
- Mortgage (P&I)
- −$1,735
- Tax est. 1.5%
- −$414 /mo · $4,963/yr
- Insurance
- −$138
- HOA
- −$200
- Vacancy / Maint / Mgmt
- −$532
- Net cashflow
- $-487
Break-even live
UW: 25.0% down · 7.5% · 30yr · 1.5% tax · 5.0% vac · 8.0% maint · 8.0% mgmt
Financing live
Cash to close
- Down payment
- $82,717
- Closing costs
- $9,926
- Reserves months
- —
- Total cash needed
- —
Loan-product check · same deal, 3 products live
Conventional
25% down · 7.5% · 30yr
- Down + closing
- —
- Monthly P&I
- —
- Monthly cashflow
- —
- DSCR
- —
- Eligible?
- —
Personal DTI + credit; lowest rate.
DSCR
20% down · 8.5% · 30yr
- Down + closing
- —
- Monthly P&I
- —
- Monthly cashflow
- —
- DSCR
- —
- Eligible?
- —
No personal income docs; deal must DSCR.
Hard money
10% down · 12.0% · 12mo
- Down + closing
- —
- Monthly P&I
- —
- Monthly cashflow
- —
- DSCR
- —
- Eligible?
- —
Short-term bridge; refi at stabilization.
Rent comps 9 comps
| Address | Beds | Baths | Sqft | Rent | $/sqft | DOM | Units | Dist |
|---|---|---|---|---|---|---|---|---|
| 133 Staggerbush St Freeport, FL | 4.0 | 2.5 | 2048 | $2,645 | $1.29 | 13d | 1 | 0.17mi |
| 50 Sedge Cir Freeport, FL | 1.0–3.0 | 1.0–2.0 | 1156 | $2,700 | $2.33 | 21d | 1 | 0.24mi |
| 80 Silverthorn St Freeport, FL | 3.0 | 2.0 | 1662 | $2,200 | $1.32 | 21d | 1 | 0.27mi |
| 36 Gray Owl Dr E Freeport, FL | 4.0 | 2.0 | 2108 | $2,800 | $1.33 | 21d | 1 | 0.69mi |
| 585 Claudia Cir Freeport, FL | 1.0–3.0 | 1.0–2.0 | 1082 | $2,040 | $1.89 | 21d | 47 | 0.99mi |
| 593 Alleyoak Ln Freeport, FL | 3.0 | 2.0 | 1634 | $2,600 | $1.59 | 21d | 1 | 1.10mi |
| 530 Alleyoak Ln Defuniak Springs, FL | 3.0 | 2.0 | 1711 | $2,500 | $1.46 | 21d | 1 | 1.11mi |
| 664 Alleyoak Ln Defuniak Springs, FL | 3.0 | 2.0 | 1634 | $2,600 | $1.59 | 21d | 1 | 1.18mi |
| 692 Alleyoak Ln Defuniak Springs, FL | 3.0 | 2.0 | 1776 | $2,500 | $1.41 | 21d | 1 | 1.22mi |
HOA detail
- Monthly dues
- $200 · $2,400/yr
Listing history 16 events
-
2026-06-18days on market $344,850 Active 139 DOM
-
2026-06-17days on market $344,850 Active 138 DOM
-
2026-06-16days on market $344,850 Active 137 DOM
-
2026-06-15days on market $344,850 Active 136 DOM
-
2026-06-14days on market $344,850 Active 134 DOM
-
2026-06-13days on market $344,850 Active 133 DOM
-
2026-06-10days on market $344,850 Active 131 DOM
-
2026-06-09days on market $344,850 Active 130 DOM
-
2026-06-08days on market $344,850 Active 129 DOM
-
2026-06-07days on market $344,850 Active 128 DOM
-
2026-06-05days on market $344,850 Active 125 DOM
-
2026-06-03days on market $344,850 Active 124 DOM
-
2026-06-03days on market $344,850 Active 123 DOM
-
2026-06-01days on market $344,850 Active 122 DOM
-
2026-05-31days on market $344,850 Active 121 DOM
-
2026-05-30days on market $344,850 Active 120 DOM
ⓘ Source: listings_history table (triggers on properties + properties_extension) + one-shot
backfill from property_details.listing_events for pre-trigger history.
Climate risk First Street
- Flood 1/10 Low FEMA zone X (unshaded) · 0% chance over 30 yrs
- Wildfire 6/10 Major
- Heat 10/10 Extreme 7 d/yr ≥106°F today · 23 d/yr by 30 yrs out
- Wind 9/10 Extreme 99% chance of damaging wind over 30 yrs
- Air quality 1/10 Low 0 unhealthy d/yr today · 0 by 30 yrs out
Nearby sold comps map
Loading sold comps map…
Walkable amenities ~0.75 mi
Loading nearby amenities…
Taxation est. · year 1
- Rental income
- $30,379
- − Mortgage interest
- −$18,534
- − Property taxes
- −$4,963
- − Insurance
- −$1,654
- − Repairs & maintenance
- −$2,430
- − Management
- −$2,430
- − HOA
- −$2,400
- − Depreciation
- −$9,625
- Taxable loss
- −$11,658
- Est. tax savings @ 24.0%
- +$2,798
- After-tax cash flow
- $-3,042/yr
For passive investors: Depreciation is non-cash, so a rental often shows a tax loss while cash-flowing — sheltering income. Rental losses are passive: they offset passive income freely, and up to $25,000/yr can offset ordinary (W-2) income if you actively participate and your MAGI is under $100k (phasing out to $0 by $150k); unused losses carry forward. On sale, claimed depreciation is recaptured at up to 25%, and gains may owe capital-gains tax (a 1031 exchange can defer both). Figures are a year-1 estimate at your 24.0% rate — not tax advice; consult a CPA.
Schools (NCES district)
- District
- Walton
- NCES district ID
- 1201980
- Math proficiency
- 62% ▼ -4.00%
- Reading proficiency
- 61% ▼ -2.00%
- Median HH income
- $46,794
- Composite
- 52.03/100
- National rank
- #1634
- State rank
- #10 of 73 in FL
Livability — Freeport
- Score
- 68/100
- State rank
- #520
- US rank
- #9579
Category grades
Schools grade is shown separately in the Schools card above.
Census & demographics
- Census place
- Freeport, FL
- City population
- 15,328
- Population (ZIP)
- 6,359
Population outlook (Walton County) Hauer SSP2
- Today (2025)
- 80,014 people
- By 2030
- 88,120 · +10.1%
- By 2040
- 103,537 · +29.4%
- By 2050
- 117,034 · +46.3%
- By 2075
- 143,901 · +79.8%
- By 2100
- 155,138 · +93.9%
Race, ethnicity, and origin ACS 2023
- Neighborhood character
- Predominantly White (83%)
- Race & ethnicity
- White 83% Black 6% Two or more races 6% Hispanic / Latino 4%
- Common ancestry
- Slovak 5% Scottish 2% Serbian 1%
- Foreign-born
- 3% · Canada
- Languages at home
- 97% English-only · Spanish 2%
Political lean MEDSL · Walton
- 2024 margin
- Solid R (+57.8) · D 20.7% · R 78.6%
- 2008→2024 swing
- -12.0pp toward R · 2008: -45.8pp · 2024: -57.8pp
- All cycles
- 2024: R+57.8 2020: R+51.7 2016: R+56.1 2012: R+52.0 2008: R+45.8
Not yet ingested
- Civics
- —
Market trends
- HPI YoY
- ▲ 12.25%
- Current HPI
- 314.8146
- Rent YoY
- —
- Metro
- —
- State GDP YoY
- ▲ 3.28%
- F500 in state
- 36
Industry mix (Fortune 500 HQ in FL)
| Industry | F500 HQs | Revenue |
|---|---|---|
| Industrial Technology | 2 | $29B |
|
||
| Insurance | 2 | $17B |
|
||
| Retail | 1 | $60B |
|
||
| Technology Distribution | 1 | $58B |
|
||
| Homebuilding | 1 | $35B |
|
||
| Technology Manufacturing | 1 | $35B |
|
||
Cash-flow waterfall
monthlySold comps — $/sqft
last 12 mo · ≤1 miLoading sold comps…