 🏗️ New Construction
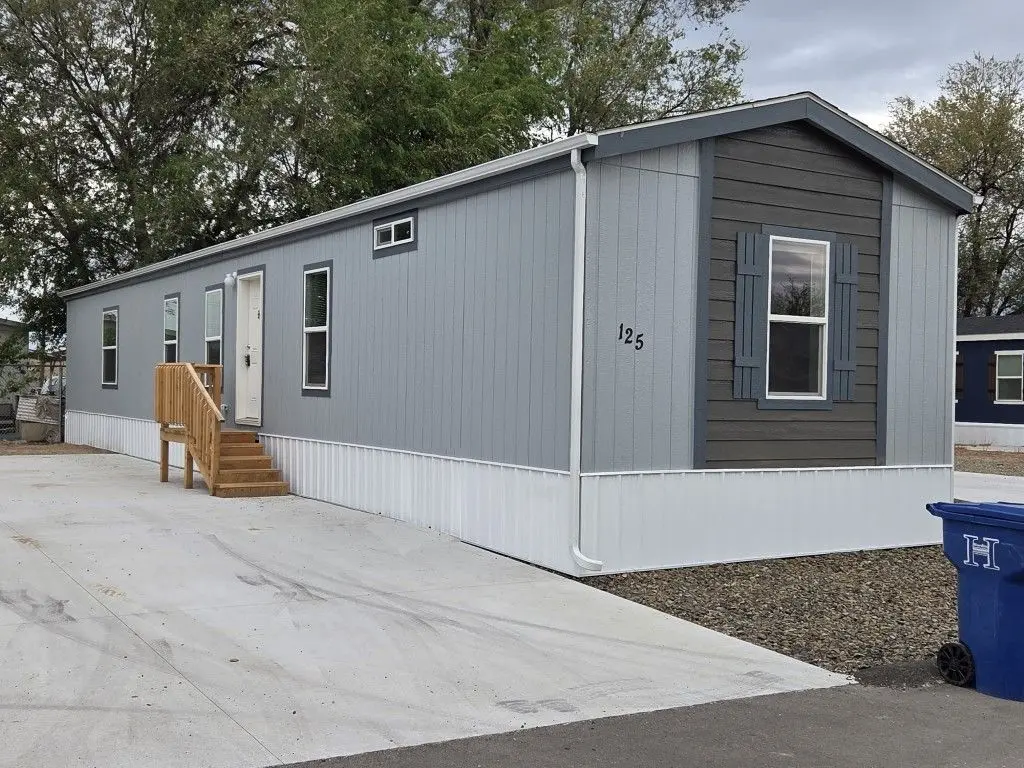
Pure Series - The Lux Plan · Fruitland, ID
Flood risk 1/10 · Minimal
- FEMA flood zone
- —
- Chance of flooding over 30 yrs
- 0.0%
- Est. flood insurance / yr
- —
Fire risk 1/10 · Minimal
- Est. fire insurance / yr
- $584 – $1,086
Heat risk 5/10 · Moderate
- Hot days now (above 99°F)
- 7 days/yr
- Hot days in 30 yrs
- 19 days/yr
Wind risk 1/10 · Minimal
- Chance of severe wind over 30 yrs
- —
Air-quality risk 7/10 · Major
- Unhealthy air days now
- 10 days/yr
- Unhealthy air days in 30 yrs
- 12 days/yr
Risk factors via First Street. Map © Google.
Why this score? — see what drove the F grade
The composite is a weighted blend of 9 inputs, each scored 0–100. Each bar is that input's sub-score; the figure is the points it added to the 100-point composite (weight × sub-score).
- ARV discount +7.5/15.0
- Livability +3.6/5.0
- Schools +3.5/10.0
- Rent growth +2.5/5.0
- Condition / age +2.5/5.0
- Cash flow +2.0/30.0
- 1% rule +0.8/10.0
- DSCR +0.0/10.0
- Appreciation +0.0/10.0
$114,900
🖨 Deal sheet (PDF) 📄 Offer letter ✓ Due diligence
Key facts
- Listed 956 days
Property features AI
Finance
- Other: List price $114,900
- HOA & community: Association fee of $325
Exterior
- Home design: New construction plan (Pure Series - The Lux)
- Exterior features: Living area of 1,080
Interior
- Bedrooms: 3 bedrooms
- Bathrooms: 2 bathrooms (full)
- Heating & cooling: Central air conditioning
- Interior features: Plan model home (Pure Series - The Lux)
Neighborhood map
What this means for you Summary
Snapshot
- This is a 3-bed/2.0-bath single-family listed at $115k.
Deal economics
- At list price, monthly cash flow is $-884 ($-11k/yr) — negative.
- To cash-flow at today's rent, offer at most $112k (2.6% below list).
- Meets the 1% rule at list price ($1k rent vs $115k).
- Recommended offer: $101k (12.0% below list) — sets the bar for market timing.
- Cap rate 1.9% vs local median 2.9% in Fruitland — below-typical yield; the buyer is paying a premium for something (appreciation thesis, condition, location) that the cap rate doesn't capture.
Location & tenants
- Location reads 71/100 on livability (#51 in ID) — a middle-class / working-renter tenant base. Strengths: crime A+, cost of living A+, housing A+; Watch: employment C-, amenities F, commute F.
- Fruitland District (town): math 33% / reading 50% proficiency, ranked #60 of 92 in ID (top 65%) — families likely to look elsewhere, expect single-tenant / working-renter base with shorter leases.
- Zoned schools: Fruitland Elementary School (math 38% / reading 40%, grade F, #247 of 357 statewide, top 70%, 557 students, 45% FRL); Fruitland Middle School (math 34% / reading 52%, grade D-, #62 of 109 statewide, top 58%, 510 students, 39% FRL); Fruitland High School (math 27% / reading 62%, grade F, #61 of 169 statewide, top 41%, 542 students, 25% FRL) — zoned schools at 36% FRL track the district average.
- Market conditions: 111 active listings in the ZIP; 3 comparable units currently listed for rent nearby; rentals leasing fast (median 5d on market — plan ~1-2 weeks tenant-placement turnaround); 230 units permitted in Payette County in 2024 (0 in 5+ unit buildings).
Forward outlook
- Local home prices are declining (-3.0%/yr); year-one equity from $2k of loan paydown is wiped out by about $7k of value loss. Plan a longer hold.
Negotiation context
- It's been on market 956 days — a 12% lower offer ($101k) is reasonable based on typical stale-listing flexibility.
Risks & watch-outs
- Watch-outs: property tax is 3.1% of price; HOA is 23% of rent.
- Climate carrying-cost: extreme-heat days projected 7→19/yr by 2055 (HVAC capex compounding) — expect insurance premiums to compound above CPI over the hold.
Questions for the listing agent
- What do current leases actually rent for vs. the listed asking? Can we see a recent rent roll and the last 12 months of T-12 income?
- It's been on market 956 days. Have you received any prior offers? Is the seller open to a 12% concession, seller financing, or rate buy-down credit?
- Property tax is high relative to price — has the assessment been appealed recently, and will the sale trigger a re-assessment?
- What does the HOA fee cover, when was the last increase, and are there any pending special assessments or reserve-fund shortfalls?
- Why hasn't it sold? Are there any deal-killer items the seller is aware of (foundation, flood, title, zoning, code violations)?
- Is there a deadline driving the sale (1031 exchange, divorce, estate, relocation)? That informs how much negotiation room exists.
- Schools are D-rated, which usually means shorter tenancies and higher turnover. Who's the typical renter profile here, and what's been the actual vacancy rate?
- The area grade is low — what's the realistic commute time and amenity access for the typical tenant pool here? Any planned neighborhood developments (good or bad) we should know about?
- What's the average days-on-market for RENTAL listings here right now (not sales)? A rising rental-DOM trend means longer vacancies and softer asking-rent achievability than the comps imply.
- What's the recent tenant-quality profile in this submarket — average credit score on applications, eviction rate, late-payment / NSF rate, and stable-employment percentage? A property-management company in the area should have these aggregated.
- How much new for-sale + rental construction is in the pipeline within 1–3 miles? Heavy new supply typically softens prices + rents 12–24 months out; constrained supply supports both.
Investment metrics
- 1% rule
- 0.58% ✗
- Cap rate
- 1.87%
- Cash-on-cash
- -15.80%
- DSCR
- 0.30
- GRM
- 14.4
CMA / ARV
- ARV (on-the-fly)
- $239,760
- Comps found
- 4
Show comp detail 4 sales within ~0.75 mi
| Address | Dist | Beds/Ba | Sqft | Sold | Price | $/sf | Match |
|---|---|---|---|---|---|---|---|
| 110 NE 14th Dr | 0.17mi | 3/1.0 | 1,031 (-4%) | 15mo | $300,000 | $291 | 68 |
| 8180 N Pennsylvania Ave | 0.47mi | 3/1.0 | 1,134 (+5%) | 3mo | $190,000 | $168 | 63 |
| 1504 N Pennsylvania Ave | 0.09mi | 3/1.0 | 1,172 (+8%) | 20mo | $260,000 | $222 | 61 |
| 1004 Victoria Ave | 0.59mi | 2/1.0 (-1) | 960 (-11%) | 22mo | $190,000 | $198 | 27 |
Match score weights: distance 35% · size 25% · config 20% · recency 20%. Top-matched comps best support the ARV.
Projected returns pro-forma
-3.0% appreciation · 3.0% rent growth · sell at horizon
- IRR
- -46.8%
- Equity multiple
- -0.41×
- Total profit
- $-94,913
- Equity at exit
- $35,749
- IRR
- -86.8%
- Equity multiple
- -1.30×
- Total profit
- $-154,225
- Equity at exit
- $20,730
Cash invested: $67,133 (down + closing). Projections, not guarantees.
Landlord ↔ Tenant lean methodology
- Overall (STATE)
- 91 Strongly Landlord-Friendly
- State Idaho
- 91 Strongly Landlord-Friendly · R+18
- County
- — inherits STATE
- City
- — inherits STATE
ZIP-level market 83619
- Home prices YoY
- -30.4%
- Active inventory
- 111
- Price-to-rent
- 6.9×
Monthly cashflow live
- Estimated rent
- $1,390 medium interval (Pro) →
- Mortgage (P&I)
- −$1,257
- Tax est. 1.5%
- −$300 /mo · $3,596/yr
- Insurance
- −$100
- HOA
- −$325
- Vacancy / Maint / Mgmt
- −$292
- Net cashflow
- $-884
Break-even live
Sensitivity live
| Price | -10% $-718 | -5% $-801 | +0% $-884 | +5% $-967 | +10% $-1,049 |
|---|---|---|---|---|---|
| Rent | -10% $-994 | -5% $-939 | +0% $-884 | +5% $-829 | +10% $-774 |
| Rate | -1.0pp $-763 | -0.5pp $-823 | base $-884 | +0.5pp $-946 | +1.0pp $-1,009 |
UW: 25.0% down · 7.5% · 30yr · 1.5% tax · 5.0% vac · 8.0% maint · 8.0% mgmt
Financing live
Cash to close
- Down payment
- $59,940
- Closing costs
- $7,193
- Reserves months
- —
- Total cash needed
- —
Loan-product check · same deal, 3 products live
Conventional
25% down · 7.5% · 30yr
- Down + closing
- —
- Monthly P&I
- —
- Monthly cashflow
- —
- DSCR
- —
- Eligible?
- —
Personal DTI + credit; lowest rate.
DSCR
20% down · 8.5% · 30yr
- Down + closing
- —
- Monthly P&I
- —
- Monthly cashflow
- —
- DSCR
- —
- Eligible?
- —
No personal income docs; deal must DSCR.
Hard money
10% down · 12.0% · 12mo
- Down + closing
- —
- Monthly P&I
- —
- Monthly cashflow
- —
- DSCR
- —
- Eligible?
- —
Short-term bridge; refi at stabilization.
Rent comps 3 comps
| Address | Beds | Baths | Sqft | Rent | $/sqft | DOM | Units | Dist |
|---|---|---|---|---|---|---|---|---|
| 909 Victoria Ave Fruitland, ID | 3.0 | 1.0 | 1152 | $700 | $0.61 | 21d | 1 | 0.58mi |
| 210 N Johnson Ave Fruitland, ID | 3.0 | 2.0 | 1450 | $1,700 | $1.17 | 5d | 1 | 0.86mi |
| 202 N Park Ave Apt 2 Fruitland, ID | 2.0 | 1.0 | 930 | $1,250 | $1.34 | 4d | 1 | 0.97mi |
HOA detail
- Monthly dues
- $325 · $3,900/yr
Listing history 16 events
-
2026-06-21days on market $114,900 Active 956 DOM
-
2026-06-18days on market $114,900 Active 953 DOM
-
2026-06-17days on market $114,900 Active 952 DOM
-
2026-06-16days on market $114,900 Active 951 DOM
-
2026-06-15days on market $114,900 Active 950 DOM
-
2026-06-13days on market $114,900 Active 948 DOM
-
2026-06-13days on market $114,900 Active 947 DOM
-
2026-06-10days on market $114,900 Active 945 DOM
-
2026-06-09days on market $114,900 Active 944 DOM
-
2026-06-08days on market $114,900 Active 943 DOM
-
2026-06-07days on market $114,900 Active 942 DOM
-
2026-06-05days on market $114,900 Active 939 DOM
-
2026-06-03days on market $114,900 Active 938 DOM
-
2026-06-03days on market $114,900 Active 937 DOM
-
2026-06-01days on market $114,900 Active 936 DOM
-
2026-05-31days on market $114,900 Active 935 DOM
ⓘ Source: listings_history table (triggers on properties + properties_extension) + one-shot
backfill from property_details.listing_events for pre-trigger history.
Climate risk First Street
- Flood 1/10 Low 0% chance over 30 yrs
- Wildfire 1/10 Low
- Heat 5/10 Major 7 d/yr ≥99°F today · 19 d/yr by 30 yrs out
- Wind 1/10 Low
- Air quality 7/10 Severe 10 unhealthy d/yr today · 12 by 30 yrs out
Nearby sold comps map
Loading sold comps map…
Walkable amenities ~0.75 mi
Loading nearby amenities…
Taxation est. · year 1
- Rental income
- $16,682
- − Mortgage interest
- −$13,430
- − Property taxes
- −$3,596
- − Insurance
- −$1,199
- − Repairs & maintenance
- −$1,335
- − Management
- −$1,335
- − HOA
- −$3,900
- − Depreciation
- −$6,975
- Taxable loss
- −$15,087
- Est. tax savings @ 24.0%
- +$3,621
- After-tax cash flow
- $-6,983/yr
For passive investors: Depreciation is non-cash, so a rental often shows a tax loss while cash-flowing — sheltering income. Rental losses are passive: they offset passive income freely, and up to $25,000/yr can offset ordinary (W-2) income if you actively participate and your MAGI is under $100k (phasing out to $0 by $150k); unused losses carry forward. On sale, claimed depreciation is recaptured at up to 25%, and gains may owe capital-gains tax (a 1031 exchange can defer both). Figures are a year-1 estimate at your 24.0% rate — not tax advice; consult a CPA.
Schools (NCES district)
- District
- Fruitland District
- NCES district ID
- 1601140
- Math proficiency
- 33% ▼ -8.00%
- Reading proficiency
- 50% ▼ -6.00%
- Median HH income
- $47,510
- Composite
- 35.43/100
- National rank
- #4933
- State rank
- #60 of 92 in ID
Livability — Fruitland
- Score
- 71/100
- State rank
- #51
- US rank
- #6760
Category grades
Schools grade is shown separately in the Schools card above.
Census & demographics
- Census place
- Fruitland, ID
- County
- Payette County · 19,928 people
- City population
- 8,823
- Metro
- Ontario, OR-ID
- Population (ZIP)
- 8,823
- Household income
- $66,267
- Rent vs Own
- Severe rent burden
- 211.0
Population outlook (Payette County) Hauer SSP2
- Today (2025)
- 23,392 people
- By 2030
- 23,523 · +0.6%
- By 2040
- 23,792 · +1.7%
- By 2050
- 24,002 · +2.6%
- By 2075
- 25,286 · +8.1%
- By 2100
- 26,673 · +14.0%
Race, ethnicity, and origin ACS 2023
- Neighborhood character
- Predominantly White (77%)
- Race & ethnicity
- White 77% Hispanic / Latino 18% Two or more races 12% Asian 1%
- Hispanic origin (detail)
- Mexican 17%
- Common ancestry
- Slovak 3% Scottish 3% Portuguese 2%
- Foreign-born
- 7% · Canada
- Languages at home
- 86% English-only · Spanish 14%
Political lean MEDSL · Payette
- 2024 margin
- Solid R (+62.9) · D 17.6% · R 80.4% · Other 2.0%
- 2008→2024 swing
- -21.4pp toward R · 2008: -41.5pp · 2024: -62.9pp
- All cycles
- 2024: R+62.9 2020: R+59.3 2016: R+59.9 2012: R+44.0 2008: R+41.5
Not yet ingested
- Civics
- —
Market trends
- HPI YoY
- ▼ -116.19%
- Current HPI
- 266.5112
- Rent YoY
- —
- Metro
- Ontario, OR-ID
- State GDP YoY
- ▲ 4.51%
- F500 in state
- 6
Industry mix (Fortune 500 HQ in ID)
| Industry | F500 HQs | Revenue |
|---|---|---|
| Retail | 1 | $79B |
|
||
| Technology | 1 | $25B |
|
||
| Food / Agriculture | 1 | $6B |
|
||
Cash-flow waterfall
monthlySold comps — $/sqft
last 12 mo · ≤1 miLoading sold comps…