13183 SW 113th Pl · On Top of the World, FL
Flood risk 1/10 · Minimal
- FEMA flood zone
- X (unshaded)
- Chance of flooding over 30 yrs
- 0.0%
- Est. flood insurance / yr
- $507 – $1,088
Fire risk 5/10 · Moderate
- Est. fire insurance / yr
- $947 – $1,759
Heat risk 8/10 · Major
- Hot days now (above 107°F)
- 7 days/yr
- Hot days in 30 yrs
- 23 days/yr
Wind risk 9/10 · Severe
- Chance of severe wind over 30 yrs
- 99.0%
Air-quality risk 3/10 · Minor
- Unhealthy air days now
- 3 days/yr
- Unhealthy air days in 30 yrs
- 3 days/yr
Risk factors via First Street. Map © Google.
Why this score? — see what drove the D+ grade
The composite is a weighted blend of 9 inputs, each scored 0–100. Each bar is that input's sub-score; the figure is the points it added to the 100-point composite (weight × sub-score).
- Cash flow +17.3/30.0
- ARV discount +11.8/15.0
- DSCR +5.4/10.0
- Schools +3.6/10.0
- 1% rule +3.3/10.0
- Rent growth +2.5/5.0
- Livability +2.5/5.0
- Condition / age +2.5/5.0
- Appreciation +0.0/10.0
$205,000
🖨 Deal sheet 📄 Offer letter ✓ Due diligence
Listing remarks MLS
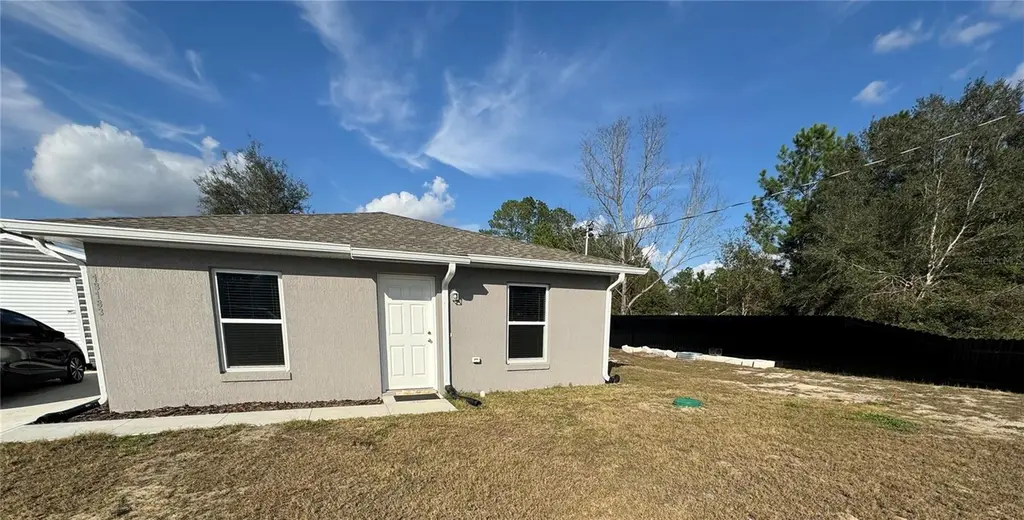
BEAUTIFUL COZY 1 YEAR OLD HOME OFFERING THE PERFECT BLEND OF MODERN COMFORT AND PEACEFUL COUNTRY LIVING . THIS 3-BEDROOM, 2-BATH RESIDENCE FEATURES A THOUGHTFULLY DESIGNED OPEN FLOOR PLAN THAT CREATES A BRIGHT AIRY ATMOSPHERE FOR BOTH EVERYDAY LIVING AND ENTERTAINING. THE LIVING AREA FLOWS SEAMLESSLY INTO THE KITCHEN AND DINING SPACE , MAKING EASY TO HOST FAMILY AND FRIENDS . THE OWNER HAS ALSO INSTALLED A WATER SOFTENER , GUTTERS AND IS ALREADY FENCED TO HAVE THE PRIVACY YOU NEED . ALSO A SHED TO KEEP SAVED TOOLS AND MORE . NATURE AROUND THE AREA INCLUDING THE RAINBOW SPRINGS STATE PARK WHICH IS A BEAUTIFUL SPRINGS JUST MINUTES DOWN THE ROAD. ALSO 15 MIN AWAY FROM RESTAURANTS AND SHOPPING. DON’T MISS THE OPPORTUNITY TO MAKE THIS WONDERFUL PROPERTY YOUR OWN .
Key facts
- Open floor plan
- Shed
- Fenced yard
Tags
Neighborhood map
What this means for you Summary
Snapshot
- This is a 3-bed/2.0-bath single-family listed at $205k.
Deal economics
- At list price, monthly cash flow is $149 ($2k/yr) — positive.
- The deal already cash-flows at list — no discount required.
- To meet the 1% rule (rent ≥ 1% of price), the offer needs to be $171k (16.6% below list).
- Recommended offer: $171k (16.6% below list) — sets the bar for 1% rule.
- Cap rate 7.2% vs local median 2.9% in On Top of the World — top-decile yield for the area; either an underpriced asset or a hidden risk that comps aren't pricing in. Stress-test before assuming the spread holds.
Location & tenants
- Location reads: area grade D — affects rentability + tenant quality, not the cash-flow math above.
- Marion (rural): math 42% / reading 43% proficiency, ranked #61 of 73 in FL (top 84%) — families likely to look elsewhere, expect single-tenant / working-renter base with shorter leases; 61% free/reduced lunch — lower-income household profile, screen leases tightly.
- Market conditions: 550 active listings in the ZIP; 7 comparable units currently listed for rent nearby; rentals at typical pace (median 21d on market — plan ~3-4 weeks tenant-placement turnaround); 7,071 units permitted in Marion County in 2024 (534 in 5+ unit buildings).
Forward outlook
- Local home prices are declining (-3.0%/yr); year-one equity from $1k of loan paydown is wiped out by about $6k of value loss. Plan a longer hold.
- Marion County population projected at +13% by 2050 — modest demand growth; plan on rents tracking national, not racing it.
Negotiation context
- It's been on market 129 days — a 12% lower offer ($180k) is reasonable based on typical stale-listing flexibility.
Risks & watch-outs
- Climate carrying-cost: severe wind risk, 99% chance of damaging wind over 30y; moderate wildfire risk; extreme-heat days projected 7→23/yr by 2055 (HVAC capex compounding) — expect insurance premiums to compound above CPI over the hold.
Questions for the listing agent
- It's been on market 129 days. Have you received any prior offers? Is the seller open to a 17% concession, seller financing, or rate buy-down credit?
- Why hasn't it sold? Are there any deal-killer items the seller is aware of (foundation, flood, title, zoning, code violations)?
- Is there a deadline driving the sale (1031 exchange, divorce, estate, relocation)? That informs how much negotiation room exists.
- The area grade is low — what's the realistic commute time and amenity access for the typical tenant pool here? Any planned neighborhood developments (good or bad) we should know about?
- What's the average days-on-market for RENTAL listings here right now (not sales)? A rising rental-DOM trend means longer vacancies and softer asking-rent achievability than the comps imply.
- What's the recent tenant-quality profile in this submarket — average credit score on applications, eviction rate, late-payment / NSF rate, and stable-employment percentage? A property-management company in the area should have these aggregated.
- How much new for-sale + rental construction is in the pipeline within 1–3 miles? Heavy new supply typically softens prices + rents 12–24 months out; constrained supply supports both.
Investment metrics
- 1% rule
- 0.83% ✗
- Cap rate
- 7.17%
- Cash-on-cash
- 3.12%
- DSCR
- 1.14
- GRM
- 10.0
CMA / ARV
- ARV (median comp)
- $226,494
- List price
- $205,000
- Delta
- -9.49%
- Verdict
- FAIR
- Comps
- 20 within 1.0 mi
Show comp detail 4 sales within ~0.75 mi
| Address | Dist | Beds/Ba | Sqft | Sold | Price | $/sf | Match |
|---|---|---|---|---|---|---|---|
| 13703 SW 113th Pl | 0.53mi | 3/2.0 | 1,127 (+12%) | 13mo | $217,900 | $193 | 45 |
| 13588 SW 112th Pl | 0.42mi | 3/2.0 | 1,127 (+12%) | 23mo | $228,000 | $202 | 42 |
| 13423 SW 108 St | 0.53mi | 3/2.0 | 1,140 (+13%) | 22mo | $238,000 | $209 | 36 |
| 10729 SW 130th Ct | 0.61mi | 3/2.0 | 1,127 (+12%) | 22mo | $224,900 | $200 | 34 |
Match score weights: distance 35% · size 25% · config 20% · recency 20%. Top-matched comps best support the ARV.
Projected returns pro-forma
-3.0% appreciation · 3.0% rent growth · sell at horizon
- IRR
- -11.5%
- Equity multiple
- 0.58×
- Total profit
- $-23,831
- Equity at exit
- $30,566
- IRR
- -2.3%
- Equity multiple
- 0.84×
- Total profit
- $-8,958
- Equity at exit
- $17,725
Cash invested: $57,400 (down + closing). Projections, not guarantees.
Landlord ↔ Tenant lean methodology
- Overall (STATE)
- 87 Strongly Landlord-Friendly
- State Florida
- 87 Strongly Landlord-Friendly · R+3
- County
- — inherits STATE
- City
- — inherits STATE
ZIP-level market 34432
- Home prices YoY
- -21.5%
- Active inventory
- 550
- Price-to-rent
- 10.0×
Monthly cashflow live
- Estimated rent
- $1,709 high interval (Pro) →
- Mortgage (P&I)
- −$1,075
- Tax from tax record
- −$41 /mo · $491/yr
- Insurance
- −$85
- HOA
- −$0
- Vacancy / Maint / Mgmt
- −$359
- Net cashflow
- $149
Break-even live
UW: 25.0% down · 7.5% · 30yr · 1.5% tax · 5.0% vac · 8.0% maint · 8.0% mgmt
Financing live
Cash to close
- Down payment
- $51,250
- Closing costs
- $6,150
- Reserves months
- —
- Total cash needed
- —
Loan-product check · same deal, 3 products live
Conventional
25% down · 7.5% · 30yr
- Down + closing
- —
- Monthly P&I
- —
- Monthly cashflow
- —
- DSCR
- —
- Eligible?
- —
Personal DTI + credit; lowest rate.
DSCR
20% down · 8.5% · 30yr
- Down + closing
- —
- Monthly P&I
- —
- Monthly cashflow
- —
- DSCR
- —
- Eligible?
- —
No personal income docs; deal must DSCR.
Hard money
10% down · 12.0% · 12mo
- Down + closing
- —
- Monthly P&I
- —
- Monthly cashflow
- —
- DSCR
- —
- Eligible?
- —
Short-term bridge; refi at stabilization.
Rent comps 7 comps
| Address | Beds | Baths | Sqft | Rent | $/sqft | DOM | Units | Dist |
|---|---|---|---|---|---|---|---|---|
| 13359 SW 112th St Dunnellon, FL | 3.0 | 2.0 | 1127 | $1,750 | $1.55 | 21d | 1 | 0.25mi |
| 13669 SW 113th Pl Dunnellon, FL | 3.0 | 2.0 | 1397 | $1,650 | $1.18 | 13d | 1 | 0.50mi |
| 13775 SW 115 Pl Unit 1331069P Dunnellon, FL | 3.0 | 2.0 | 1399 | $9,815 | $7.02 | 21d | 1 | 0.66mi |
| 13439 SW 106th Pl Dunnellon, FL | 3.0 | 2.0 | 1397 | $1,700 | $1.22 | 21d | 1 | 0.77mi |
| 10711 SW 136th Court Rd Dunnellon, FL | 2.0 | 1.0 | 928 | $1,450 | $1.56 | 21d | 1 | 0.80mi |
| 13469 SW 106th St Dunnellon, FL | 3.0 | 2.0 | 1226 | $1,750 | $1.43 | 21d | 1 | 0.84mi |
| 13527 SW 100th Ln Dunnellon, FL | 3.0 | 2.0 | 1352 | $2,100 | $1.55 | 21d | 1 | 1.40mi |
Listing history 9 events
-
2026-06-10days on market $205,000 Active 129 DOM
-
2026-06-09days on market $205,000 Active 128 DOM
-
2026-06-08days on market $205,000 Active 127 DOM
-
2026-06-07days on market $205,000 Active 126 DOM
-
2026-06-03days on market $205,000 Active 122 DOM
-
2026-06-02days on market $205,000 Active 121 DOM
-
2026-05-31days on market $205,000 Active 119 DOM
-
2026-05-30days on market $205,000 Active 118 DOM
-
2026-02-01$205,000 Active 776-char remark
Show marketing remark (776 chars)
BEAUTIFUL COZY 1 YEAR OLD HOME OFFERING THE PERFECT BLEND OF MODERN COMFORT AND PEACEFUL COUNTRY LIVING . THIS 3-BEDROOM, 2-BATH RESIDENCE FEATURES A THOUGHTFULLY DESIGNED OPEN FLOOR PLAN THAT CREATES A BRIGHT AIRY ATMOSPHERE FOR BOTH EVERYDAY LIVING AND ENTERTAINING. THE LIVING AREA FLOWS SEAMLESSLY INTO THE KITCHEN AND DINING SPACE , MAKING EASY TO HOST FAMILY AND FRIENDS . THE OWNER HAS ALSO INSTALLED A WATER SOFTENER , GUTTERS AND IS ALREADY FENCED TO HAVE THE PRIVACY YOU NEED . ALSO A SHED TO KEEP SAVED TOOLS AND MORE . NATURE AROUND THE AREA INCLUDING THE RAINBOW SPRINGS STATE PARK WHICH IS A BEAUTIFUL SPRINGS JUST MINUTES DOWN THE ROAD. ALSO 15 MIN AWAY FROM RESTAURANTS AND SHOPPING. DON’T MISS THE OPPORTUNITY TO MAKE THIS WONDERFUL PROPERTY YOUR OWN .
ⓘ Source: listings_history table (triggers on properties + properties_extension) + one-shot
backfill from property_details.listing_events for pre-trigger history.
Tax reassessment forecast FL · Resets to sale price
- Current annual tax
- $491 · $41/mo
- Projected year-2 tax
- $1,702 · $142/mo
- Expected delta
- +$1,211/yr (+$101/mo · 246.7%)
ⓘ Screening estimate from a state-policy table — verify with the county assessor before closing.
Climate risk First Street
- Flood 1/10 Low FEMA zone X (unshaded) · 0% chance over 30 yrs
- Wildfire 5/10 Major
- Heat 8/10 Severe 7 d/yr ≥107°F today · 23 d/yr by 30 yrs out
- Wind 9/10 Extreme 99% chance of damaging wind over 30 yrs
- Air quality 3/10 Moderate 3 unhealthy d/yr today · 3 by 30 yrs out
Nearby sold comps map
Loading sold comps map…
Walkable amenities ~0.75 mi
Loading nearby amenities…
Taxation est. · year 1
- Rental income
- $20,513
- − Mortgage interest
- −$11,483
- − Property taxes
- −$491
- − Insurance
- −$1,025
- − Repairs & maintenance
- −$1,641
- − Management
- −$1,641
- − Depreciation
- −$5,964
- Taxable loss
- −$1,732
- Est. tax savings @ 24.0%
- +$416
- After-tax cash flow
- $2,205/yr
For passive investors: Depreciation is non-cash, so a rental often shows a tax loss while cash-flowing — sheltering income. Rental losses are passive: they offset passive income freely, and up to $25,000/yr can offset ordinary (W-2) income if you actively participate and your MAGI is under $100k (phasing out to $0 by $150k); unused losses carry forward. On sale, claimed depreciation is recaptured at up to 25%, and gains may owe capital-gains tax (a 1031 exchange can defer both). Figures are a year-1 estimate at your 24.0% rate — not tax advice; consult a CPA.
Schools (NCES district)
- District
- Marion
- NCES district ID
- 1201260
- Math proficiency
- 42% ▼ -7.00%
- Reading proficiency
- 43% ▼ -4.00%
- Median HH income
- $40,015
- Composite
- 35.61/100
- National rank
- #4890
- State rank
- #61 of 73 in FL
Livability — On Top of the World
No livability data for this city. (Only ~50 U.S. cities are tracked.)
Census & demographics
- City population
- 25,668
- Population (ZIP)
- 13,197
Population outlook (Marion County) Hauer SSP2
- Today (2025)
- 365,905 people
- By 2030
- 376,768 · +3.0%
- By 2040
- 396,555 · +8.4%
- By 2050
- 412,723 · +12.8%
- By 2075
- 446,090 · +21.9%
- By 2100
- 436,193 · +19.2%
Race, ethnicity, and origin ACS 2023
- Neighborhood character
- Predominantly White (79%)
- Race & ethnicity
- White 79% Hispanic / Latino 16% Two or more races 11% Black 1%
- Hispanic origin (detail)
- Mexican 2% Puerto Rican 7% Cuban 2%
- Common ancestry
- Romanian 4% Slovak 3% Lithuanian 3%
- Foreign-born
- 8% · Canada
- Languages at home
- 90% English-only · Spanish 9% Other Indo-European 1%
Political lean MEDSL · Marion
- 2024 margin
- Solid R (+31.6) · D 33.8% · R 65.5%
- 2008→2024 swing
- -20.0pp toward R · 2008: -11.6pp · 2024: -31.6pp
- All cycles
- 2024: R+31.6 2020: R+25.9 2016: R+26.2 2012: R+16.2 2008: R+11.6
Not yet ingested
- Civics
- —
Market trends
- HPI YoY
- ▼ -57.34%
- Current HPI
- 209.595
- Rent YoY
- —
- Metro
- —
- State GDP YoY
- ▲ 3.28%
- F500 in state
- 36
Industry mix (Fortune 500 HQ in FL)
| Industry | F500 HQs | Revenue |
|---|---|---|
| Industrial Technology | 2 | $29B |
|
||
| Insurance | 2 | $17B |
|
||
| Retail | 1 | $60B |
|
||
| Technology Distribution | 1 | $58B |
|
||
| Homebuilding | 1 | $35B |
|
||
| Technology Manufacturing | 1 | $35B |
|
||
Price history
1 event — show timeline
- 2026-02-01 Listed $205,000 Stellar MLS as Distributed by MLS Grid
Property tax history
+20.5%/yrLatest (2025): $491 · +171.9% YoY. Source: county tax records.
Cash-flow waterfall
monthlySold comps — $/sqft
last 12 mo · ≤1 miLoading sold comps…