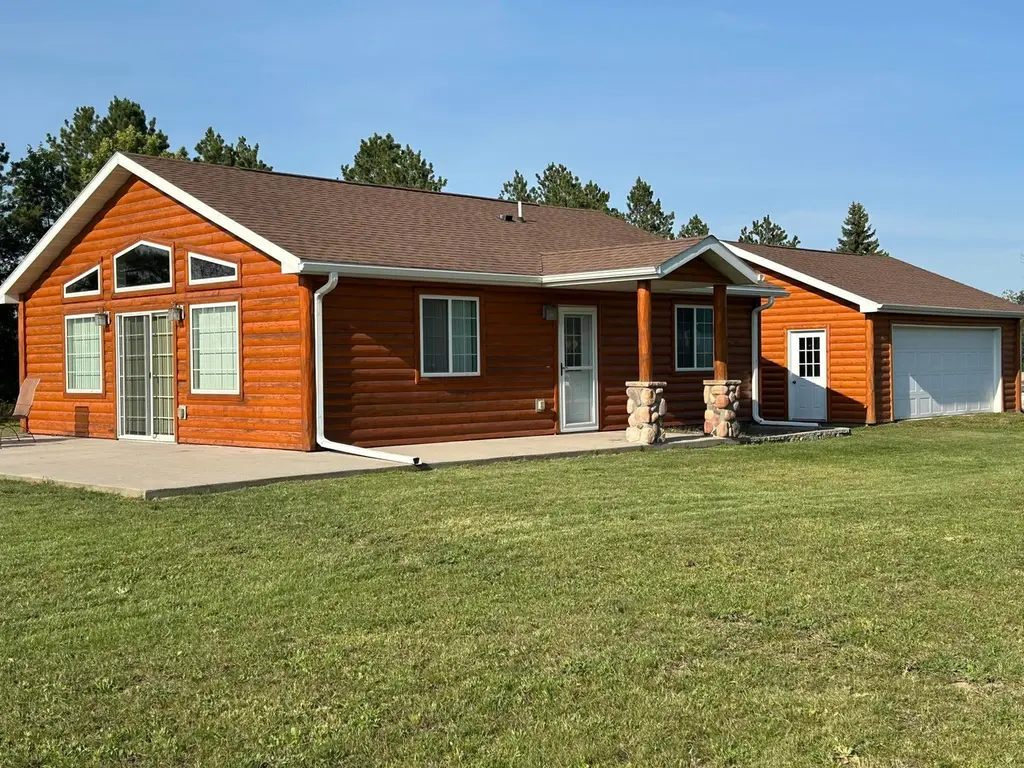
13492 Edgewood Ln SE · Mentor, MN
Flood risk 1/10 · Minimal
- FEMA flood zone
- —
- Chance of flooding over 30 yrs
- 0.0%
- Est. flood insurance / yr
- —
Fire risk 5/10 · Moderate
- Est. fire insurance / yr
- $888 – $1,650
Heat risk 1/10 · Minimal
- Hot days now (above 94°F)
- 7 days/yr
- Hot days in 30 yrs
- 12 days/yr
Wind risk 1/10 · Minimal
- Chance of severe wind over 30 yrs
- —
Air-quality risk 3/10 · Minor
- Unhealthy air days now
- 3 days/yr
- Unhealthy air days in 30 yrs
- 3 days/yr
Risk factors via First Street. Map © Google.
Why this score? — see what drove the F grade
The composite is a weighted blend of 9 inputs, each scored 0–100. Each bar is that input's sub-score; the figure is the points it added to the 100-point composite (weight × sub-score).
- Appreciation +9.4/10.0
- ARV discount +7.5/15.0
- Schools +5.1/10.0
- Cash flow +4.6/30.0
- Livability +2.9/5.0
- Rent growth +2.5/5.0
- Condition / age +2.5/5.0
- 1% rule +0.5/10.0
- DSCR +0.0/10.0
$185,000
🖨 Deal sheet (PDF) 📄 Offer letter ✓ Due diligence
Listing remarks
Association no longer has dock space. Discover the perfect blend of comfort and convenience with this delightful 2-bedroom, 1-bathroom home nestled on 1.5 acres right next to the serene Maple Lake. Whether you're seeking a year-round residence or a cozy weekend getaway, this property has something for everyone. Enjoy the benefits of association access to a beautiful beach. The spacious lot offers a get away and room to enjoy outdoor activities. This charming home combines access to Maple Lake with the potential for year-round enjoyment. Don't miss your chance to own a slice of tranquility!
Key facts
- Spacious lot
- Access to maple lake
- 1.59 acre lot
Tags
Property features AI
Finance
- Other: Lot approximately 1.593 acres (dimensions 154 x 444 x 150 x 481); City street frontage
- HOA & community: Member of Shalom Estates Association Inc; Annual association fee of $300 (includes beach access, professional management, and shared amenities)
Exterior
- Parking: Gravel parking area; 2-car detached garage (25 x 25)
- Utilities: Well water; Mound septic system; Electric service
- Home design: Residential property; One-story home; Entry and living areas on main level; Facing direction not specified
- Construction: Shingle roof (over 8 years old); 952 sq ft foundation area
- Exterior features: Wood exterior; Patio; Association access to waterfront; Storage shed; Garage(s)
Interior
- Kitchen: Range; Refrigerator; Dishwasher
- Bedrooms: 2 bedrooms (both on the main level)
- Bathrooms: 1 full bathroom (main level)
- Heating & cooling: Baseboard heat; Ductless mini-split heating and cooling
- Interior features: Ceiling fan(s); Main floor primary bedroom; Patio; Stainless steel appliances
- Laundry & utility: Washer; Dryer; Electric water heater
Neighborhood map
What this means for you Summary
Snapshot
- This is a 3-bed/1.0-bath single-family listed at $185k.
Deal economics
- At list price, monthly cash flow is $-473 ($-6k/yr) — negative.
- To cash-flow at today's rent, offer at most $102k (45.1% below list).
- To meet the 1% rule (rent ≥ 1% of price), the offer needs to be $101k (45.2% below list).
- Recommended offer: $101k (45.2% below list) — sets the bar for 1% rule.
Location & tenants
- Location reads 57/100 on livability (#827 in MN) — a working-class tenant base; expect higher turnover. Strengths: cost of living A+, crime A, housing A; Watch: health & safety D+, amenities F, commute F.
- Fertile-Beltrami School District (rural): math 55% / reading 64% proficiency, ranked #47 of 301 in MN (top 16%) — acceptable for families but not a draw, mixed tenant base, ~2y average lease.
- Zoned schools: Fertile-Beltrami Elementary (math 57% / reading 72%, grade B, #130 of 857 statewide, top 18%, 260 students, 50% FRL); Fertile-Beltrami Secondary (math 52% / reading 57%, grade C-, #87 of 471 statewide, top 22%, 244 students, 37% FRL) — zoned schools average 43% FRL vs 22% district-wide (21 pts higher); higher-poverty schools than district average — tighter screening recommended.
- Market conditions: 25 active listings in the ZIP; 42 units permitted in Polk County in 2024 (0 in 5+ unit buildings).
Forward outlook
- In year one you build about $18k of equity ($1k loan paydown + $16k appreciation (8.8% local appreciation)).
- Polk County population projected to shrink 7% by 2050 — rents likely to lag national; underwrite the cash flow, not the appreciation.
- By year 3, paydown + projected appreciation supports a ~$44k cash-out refi (75% LTV) — recoverable capital for the next deal without selling this one.
Negotiation context
- It's been on market 26 days — a 2% lower offer ($182k) is reasonable based on typical stale-listing flexibility.
- 6 sale attempts since 2y ago with the ask held roughly flat each time — persistent listings suggest the price (not the market) is what's stuck; bring a comps-based counter.
- Current owner paid $145k; 28% above their basis — modest negotiation headroom, anchor on the comps not their cost.
Risks & watch-outs
- Climate carrying-cost: moderate wildfire risk — expect insurance premiums to compound above CPI over the hold.
Questions for the listing agent
- What do current leases actually rent for vs. the listed asking? Can we see a recent rent roll and the last 12 months of T-12 income?
- What does the HOA fee cover, when was the last increase, and are there any pending special assessments or reserve-fund shortfalls?
- Is there a deadline driving the sale (1031 exchange, divorce, estate, relocation)? That informs how much negotiation room exists.
- Schools are F-rated, which usually means shorter tenancies and higher turnover. Who's the typical renter profile here, and what's been the actual vacancy rate?
- The area grade is low — what's the realistic commute time and amenity access for the typical tenant pool here? Any planned neighborhood developments (good or bad) we should know about?
- What's the average days-on-market for RENTAL listings here right now (not sales)? A rising rental-DOM trend means longer vacancies and softer asking-rent achievability than the comps imply.
- What's the recent tenant-quality profile in this submarket — average credit score on applications, eviction rate, late-payment / NSF rate, and stable-employment percentage? A property-management company in the area should have these aggregated.
- How much new for-sale + rental construction is in the pipeline within 1–3 miles? Heavy new supply typically softens prices + rents 12–24 months out; constrained supply supports both.
Investment metrics
- 1% rule
- 0.55% ✗
- Cap rate
- 3.23%
- Cash-on-cash
- -10.95%
- DSCR
- 0.51
- GRM
- 15.2
CMA / ARV
- ARV (median comp)
- $444,708
- List price
- $185,000
- Delta
- -58.40%
- Verdict
- UNDERPRICED
- Comps
- 4 within 2.0 mi
Projected returns pro-forma
8.8% appreciation · 3.0% rent growth · sell at horizon
- IRR
- 13.8%
- Equity multiple
- 2.08×
- Total profit
- $55,747
- Equity at exit
- $150,788
- IRR
- 13.8%
- Equity multiple
- 4.57×
- Total profit
- $185,017
- Equity at exit
- $309,643
Cash invested: $51,800 (down + closing). Projections, not guarantees.
Landlord ↔ Tenant lean methodology
- Overall (STATE)
- 46 Balanced
- State Minnesota
- 46 Balanced · D+2
- County
- — inherits STATE
- City
- — inherits STATE
ZIP-level market 56736
- Home prices YoY
- 5.0%
- Active inventory
- 25
- Price-to-rent
- 15.2×
Monthly cashflow live
- Estimated rent
- $1,013 medium interval (Pro) →
- Mortgage (P&I)
- −$970
- Tax from tax record
- −$201 /mo · $2,408/yr
- Insurance
- −$77
- HOA
- −$25
- Vacancy / Maint / Mgmt
- −$213
- Net cashflow
- $-473
Break-even live
Sensitivity live
| Price | -10% $-368 | -5% $-420 | +0% $-473 | +5% $-525 | +10% $-577 |
|---|---|---|---|---|---|
| Rent | -10% $-553 | -5% $-513 | +0% $-473 | +5% $-433 | +10% $-393 |
| Rate | -1.0pp $-379 | -0.5pp $-426 | base $-473 | +0.5pp $-521 | +1.0pp $-569 |
UW: 25.0% down · 7.5% · 30yr · 1.5% tax · 5.0% vac · 8.0% maint · 8.0% mgmt
Financing live
Cash to close
- Down payment
- $46,250
- Closing costs
- $5,550
- Reserves months
- —
- Total cash needed
- —
Loan-product check · same deal, 3 products live
Conventional
25% down · 7.5% · 30yr
- Down + closing
- —
- Monthly P&I
- —
- Monthly cashflow
- —
- DSCR
- —
- Eligible?
- —
Personal DTI + credit; lowest rate.
DSCR
20% down · 8.5% · 30yr
- Down + closing
- —
- Monthly P&I
- —
- Monthly cashflow
- —
- DSCR
- —
- Eligible?
- —
No personal income docs; deal must DSCR.
Hard money
10% down · 12.0% · 12mo
- Down + closing
- —
- Monthly P&I
- —
- Monthly cashflow
- —
- DSCR
- —
- Eligible?
- —
Short-term bridge; refi at stabilization.
HOA detail
- Monthly dues
- $25 · $300/yr
Listing history 26 events
-
2026-06-09statusdays on market $185,000 Pending 26 DOM
-
2026-06-08days on market $185,000 Contingent - Subject to Statutory Rescission 25 DOM
-
2026-06-07days on market $185,000 Contingent - Subject to Statutory Rescission 24 DOM
-
2026-06-04days on market $185,000 Contingent - Subject to Statutory Rescission 20 DOM
-
2026-06-02days on market $185,000 Contingent - Subject to Statutory Rescission 19 DOM
-
2026-06-01days on market $185,000 Contingent - Subject to Statutory Rescission 18 DOM
-
2026-05-31days on market $185,000 Contingent - Subject to Statutory Rescission 17 DOM
-
2026-05-31days on market $185,000 Contingent - Subject to Statutory Rescission 16 DOM
-
2026-05-17historical Contingent - Inspection 596-char remark
-
2026-05-14$185,000 Active 596-char remark
-
2026-05-14historical
-
2026-03-11status Active
-
2025-06-20$225,000 Active
-
2025-06-20historical
-
2025-04-17$250,000 Active
-
2025-04-17historical
-
2025-02-06$280,000 Active
-
2025-02-04historical
-
2025-02-04historical
-
2024-09-30price $300,000
-
2024-09-16$315,000 Active
-
2020-03-31soldstatus $145,000
-
2017-11-07$140,000
-
2015-07-01soldstatus
-
2015-07-01$150,000
-
2015-06-29soldstatus $150,000
ⓘ Source: listings_history table (triggers on properties + properties_extension) + one-shot
backfill from property_details.listing_events for pre-trigger history.
Tax reassessment forecast MN · Partial reset (capped growth)
- Current annual tax
- $2,408 · $201/mo
- Projected year-2 tax
- $2,408 · $201/mo
- Expected delta
- $0/yr ($0/mo · 0.0%)
ⓘ Screening estimate from a state-policy table — verify with the county assessor before closing.
Climate risk First Street
- Flood 1/10 Low 0% chance over 30 yrs
- Wildfire 5/10 Major
- Heat 1/10 Low 7 d/yr ≥94°F today · 12 d/yr by 30 yrs out
- Wind 1/10 Low
- Air quality 3/10 Moderate 3 unhealthy d/yr today · 3 by 30 yrs out
Nearby sold comps map
Loading sold comps map…
Walkable amenities ~0.75 mi
Loading nearby amenities…
Taxation est. · year 1
- Rental income
- $12,157
- − Mortgage interest
- −$10,363
- − Property taxes
- −$2,408
- − Insurance
- −$925
- − Repairs & maintenance
- −$973
- − Management
- −$973
- − HOA
- −$300
- − Depreciation
- −$5,382
- Taxable loss
- −$9,166
- Est. tax savings @ 24.0%
- +$2,200
- After-tax cash flow
- $-3,471/yr
For passive investors: Depreciation is non-cash, so a rental often shows a tax loss while cash-flowing — sheltering income. Rental losses are passive: they offset passive income freely, and up to $25,000/yr can offset ordinary (W-2) income if you actively participate and your MAGI is under $100k (phasing out to $0 by $150k); unused losses carry forward. On sale, claimed depreciation is recaptured at up to 25%, and gains may owe capital-gains tax (a 1031 exchange can defer both). Figures are a year-1 estimate at your 24.0% rate — not tax advice; consult a CPA.
Schools (NCES district)
- District
- Fertile-Beltrami School District
- NCES district ID
- 2711910
- Math proficiency
- 55% ▼ -9.00%
- Reading proficiency
- 64% ▼ -7.00%
- Median HH income
- $52,616
- Composite
- 50.88/100
- National rank
- #1792
- State rank
- #47 of 301 in MN
Livability — Mentor
- Score
- 57/100
- State rank
- #827
- US rank
- #21637
Category grades
Schools grade is shown separately in the Schools card above.
Census & demographics
- Population (ZIP)
- 670
Population outlook (Polk County) Hauer SSP2
- Today (2025)
- 31,123 people
- By 2030
- 30,720 · -1.3%
- By 2040
- 29,806 · -4.2%
- By 2050
- 29,022 · -6.8%
- By 2075
- 27,972 · -10.1%
- By 2100
- 26,953 · -13.4%
Race, ethnicity, and origin ACS 2023
- Neighborhood character
- Predominantly White (97%)
- Race & ethnicity
- White 97% Two or more races 1%
- Common ancestry
- Portuguese 49% Lithuanian 11% Scottish 5%
- Foreign-born
- 1%
Political lean MEDSL · Polk
- 2024 margin
- Solid R (+33.8) · D 32.3% · R 66.0% · Other 1.7%
- 2008→2024 swing
- -38.3pp toward R · 2008: 4.6pp · 2024: -33.8pp
- All cycles
- 2024: R+33.8 2020: R+28.4 2016: R+29.0 2012: R+5.8 2008: D+4.6
Not yet ingested
- Civics
- —
Market trends
- HPI YoY
- ▲ 8.80%
- Current HPI
- 186.0436
- Rent YoY
- —
- Metro
- —
- State GDP YoY
- ▲ 2.41%
- F500 in state
- 34
Industry mix (Fortune 500 HQ in MN)
| Industry | F500 HQs | Revenue |
|---|---|---|
| Healthcare | 2 | $407B |
|
||
| Retail | 2 | $150B |
|
||
| Consumer Goods | 2 | $32B |
|
||
| Industrial Machinery | 2 | $6B |
|
||
| Agriculture | 1 | $40B |
|
||
| Healthcare / Medical Devices | 1 | $32B |
|
||
Price history
+23.3% since first listed16 events — show timeline
- 2026-06-09 Pending — NORTHSTARMLS as Distributed by MLS Grid
- 2026-05-17 Contingent — NORTHSTARMLS as Distributed by MLS Grid
- 2026-05-14 Listing Removed — NORTHSTARMLS as Distributed by MLS Grid
- 2026-05-14 Listed $185,000 NORTHSTARMLS as Distributed by MLS Grid
- 2026-03-11 Relisted — NORTHSTARMLS as Distributed by MLS Grid
- 2025-06-20 Listing Removed — NORTHSTARMLS as Distributed by MLS Grid
- 2025-06-20 Listed $225,000 NORTHSTARMLS as Distributed by MLS Grid
- 2025-04-17 Listing Removed — NORTHSTARMLS as Distributed by MLS Grid
- 2025-04-17 Listed $250,000 NORTHSTARMLS as Distributed by MLS Grid
- 2025-02-06 Listed $280,000 NORTHSTARMLS as Distributed by MLS Grid
- 2025-02-04 Coming Soon — NORTHSTARMLS as Distributed by MLS Grid
- 2025-02-04 Listing Removed — NORTHSTARMLS as Distributed by MLS Grid
- 2024-09-30 Price Changed $300,000 NORTHSTARMLS as Distributed by MLS Grid
- 2024-09-16 Listed $315,000 NORTHSTARMLS as Distributed by MLS Grid
- 2020-03-31 Sold (Public Records) $145,000 Public Records
- 2015-06-29 Sold (Public Records) $150,000 Public Records
Property tax history
+4.3%/yrLatest (2026): $2,408 · -2.5% YoY. Source: county tax records.
Cash-flow waterfall
monthlySold comps — $/sqft
last 12 mo · ≤1 miLoading sold comps…