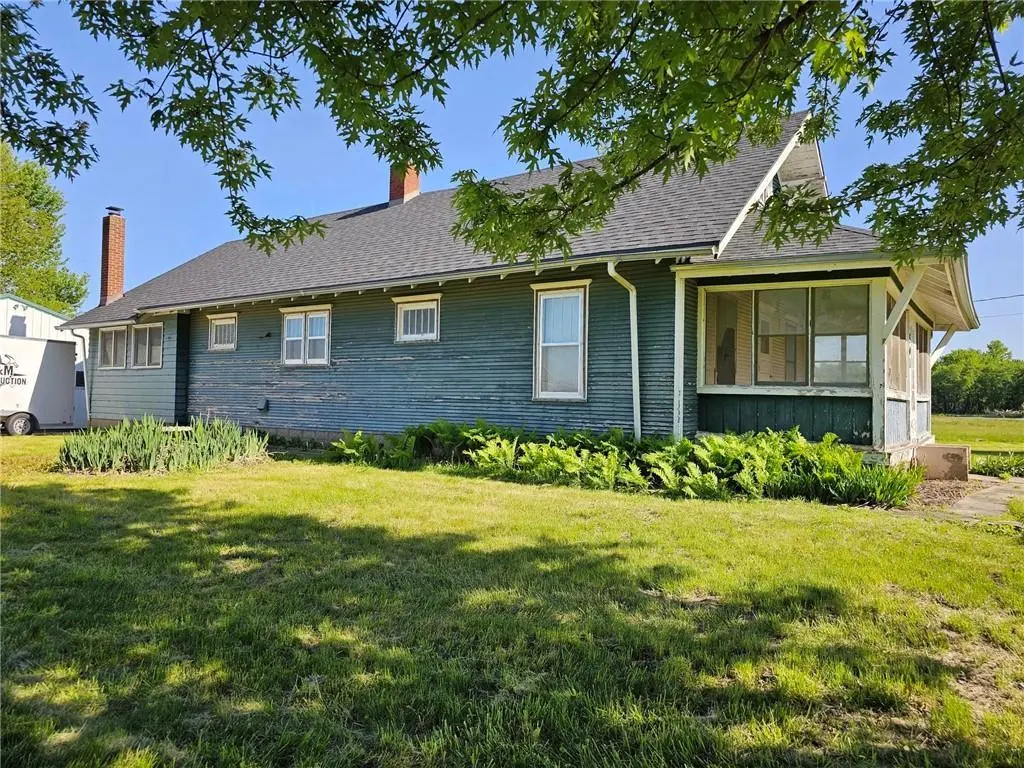
501 S Lake St · Rosendale, MO
Flood risk 3/10 · Minor
- FEMA flood zone
- A
- Chance of flooding over 30 yrs
- 0.17%
- Est. flood insurance / yr
- $946 – $6,584
Fire risk 3/10 · Minor
- Est. fire insurance / yr
- $1,054 – $1,958
Heat risk 4/10 · Minor
- Hot days now (above 106°F)
- 7 days/yr
- Hot days in 30 yrs
- 16 days/yr
Wind risk 2/10 · Minimal
- Chance of severe wind over 30 yrs
- —
Air-quality risk 1/10 · Minimal
- Unhealthy air days now
- 0 days/yr
- Unhealthy air days in 30 yrs
- 0 days/yr
Risk factors via First Street. Map © Google.
Why this score? — see what drove the B+ grade
The composite is a weighted blend of 9 inputs, each scored 0–100. Each bar is that input's sub-score; the figure is the points it added to the 100-point composite (weight × sub-score).
- Cash flow +30.0/30.0
- DSCR +10.0/10.0
- Appreciation +9.1/10.0
- 1% rule +8.6/10.0
- ARV discount +7.5/15.0
- Schools +3.9/10.0
- Livability +2.8/5.0
- Rent growth +2.5/5.0
- Condition / age +2.5/5.0
$89,900
🖨 Deal sheet (PDF) 📄 Offer letter ✓ Due diligence
Listing remarks MLS
4 bedroom cottage in Rosendale, MO. This home has a main floor rec room, detached garage, original wood floors, and tons of original character including a window seat.
Key facts
- 24x20 outbuilding
- Cozy window seat
- Spiral staircase
Tags
Property features AI
Finance
- Other: Property sits on approximately 2 acres; Lot is level; Located in a flood plain
- HOA & community: No association fees
Exterior
- Parking: Detached 2-car garage with garage door opener
- Utilities: Public water; Public sewer
- Home design: Single-family residence; 1.5-story floor plan; Residential property
- Construction: Frame construction; Composition roof; Has basement with inside entrance; Approximately 101+ years old
- Exterior features: Screened porch; Porch; Metal fencing; Outbuilding
Interior
- Kitchen: Gas range
- Bedrooms: 4 bedrooms
- Bathrooms: 1 full bathroom
- Heating & cooling: Forced air heating; Electric cooling
- Interior features: Formal dining area; Gas range
- Laundry & utility: Main-level laundry
Neighborhood map
What this means for you Summary
Snapshot
- This is a 4-bed/1.0-bath single-family listed at $90k.
Deal economics
- At list price, monthly cash flow is $83 ($998/yr) — positive.
- The deal already cash-flows at list — no discount required.
- Meets the 1% rule at list price ($1k rent vs $90k).
- Recommended offer: $89k (1.5% below list) — sets the bar for market timing.
Location & tenants
- Location reads 55/100 on livability (#756 in MO) — a working-class tenant base; expect higher turnover. Strengths: cost of living A+, housing A+; Watch: crime F, amenities F, commute F.
- North Andrew County R-VI (rural): math 35% / reading 50% proficiency, ranked #236 of 535 in MO (top 44%) — families likely to look elsewhere, expect single-tenant / working-renter base with shorter leases.
- Zoned schools: North Andrew Elem. (math 67% / reading 57%, grade B, #98 of 1,115 statewide, top 10%, 115 students, 29% FRL); North Andrew Middle (math 27% / reading 42%, grade F, #243 of 391 statewide, top 65%, 72 students, 29% FRL); North Andrew High (math 44% / reading 34%, grade F, #247 of 521 statewide, top 55%, 113 students, 24% FRL) — zoned schools at 27% FRL track the district average.
- Market conditions: 2 active listings in the ZIP; 4 units permitted in Andrew County in 2024 (0 in 5+ unit buildings).
Forward outlook
- In year one you build about $8k of equity ($622 loan paydown + $7k appreciation (8.2% local appreciation)).
- Andrew County population projected to shrink 6% by 2050 — rents likely to lag national; underwrite the cash flow, not the appreciation.
- At projected returns (8.2% appreciation + 3.0% rent growth), your $25k cash investment doubles in ~3 years — after that, you're playing with house money.
- By year 5, paydown + projected appreciation supports a ~$36k cash-out refi (75% LTV) — recoverable capital for the next deal without selling this one.
Negotiation context
- It's been on market 30 days — a 2% lower offer ($89k) is reasonable based on typical stale-listing flexibility.
- 3 sale attempts since 20y ago with the ask held roughly flat each time — persistent listings suggest the price (not the market) is what's stuck; bring a comps-based counter.
Risks & watch-outs
- Watch-outs: flood insurance adds $314/mo; built in 1900 — expect roof / HVAC / electrical / plumbing capex.
- Climate carrying-cost: in FEMA flood zone A (mandatory federal flood insurance) — expect insurance premiums to compound above CPI over the hold.
Questions for the listing agent
- Built in 1900 — when were the roof, HVAC, electrical panel, plumbing, and water heater last replaced?
- What's the actual annual flood-insurance premium (NFIP or private), and is the property in a SFHA with mandatory coverage?
- Is there a deadline driving the sale (1031 exchange, divorce, estate, relocation)? That informs how much negotiation room exists.
- Schools are F-rated, which usually means shorter tenancies and higher turnover. Who's the typical renter profile here, and what's been the actual vacancy rate?
- Crime grade is F in this area — have there been break-ins, vandalism, or insurance claims at this property in the last 3 years? What carrier currently insures it and at what premium?
- What's the average days-on-market for RENTAL listings here right now (not sales)? A rising rental-DOM trend means longer vacancies and softer asking-rent achievability than the comps imply.
- What's the recent tenant-quality profile in this submarket — average credit score on applications, eviction rate, late-payment / NSF rate, and stable-employment percentage? A property-management company in the area should have these aggregated.
- How much new for-sale + rental construction is in the pipeline within 1–3 miles? Heavy new supply typically softens prices + rents 12–24 months out; constrained supply supports both.
Investment metrics
- 1% rule
- 1.36% ✓
- Cap rate
- 11.59%
- Cash-on-cash
- 18.92%
- DSCR
- 1.84
- GRM
- 6.1
CMA / ARV
- ARV (median comp)
- $89,900
- List price
- $89,900
- Delta
- —
- Verdict
- FAIR
- Comps
- 3 within 1.0 mi
Show comp detail 3 sales within ~0.75 mi
| Address | Dist | Beds/Ba | Sqft | Sold | Price | $/sf | Match |
|---|---|---|---|---|---|---|---|
| 501 S Lake St | 0.00mi | 4/1.0 | 1,338 (0%) | 0mo | $89,900 | $67 | 100 |
| 404 S Lake St | 0.04mi | 4/1.5 | 1,198 (-10%) | 4mo | $31,000 | $26 | 75 |
| 6087 149th County Rd | 0.57mi | 3/2.0 (-1) | 1,248 (-7%) | 21mo | $224,900 | $180 | 36 |
Match score weights: distance 35% · size 25% · config 20% · recency 20%. Top-matched comps best support the ARV.
Projected returns pro-forma
8.18% appreciation · 3.0% rent growth · sell at horizon
- IRR
- 23.5%
- Equity multiple
- 2.73×
- Total profit
- $43,536
- Equity at exit
- $69,391
- IRR
- 21.4%
- Equity multiple
- 5.88×
- Total profit
- $122,797
- Equity at exit
- $138,796
Cash invested: $25,172 (down + closing). Projections, not guarantees.
Landlord ↔ Tenant lean methodology
- Overall (STATE)
- 81 Strongly Landlord-Friendly
- State Missouri
- 81 Strongly Landlord-Friendly · R+10
- County
- — inherits STATE
- City
- — inherits STATE
ZIP-level market 64483
- Home prices YoY
- 3.3%
- Active inventory
- 2
- Price-to-rent
- 6.1×
Monthly cashflow live
- Estimated rent
- $1,226 medium interval (Pro) →
- Mortgage (P&I)
- −$471
- Tax from tax record
- −$63 /mo · $753/yr
- Insurance
- −$37
- Flood insurance flood zone
- −$314 /mo · $3,765/yr
- HOA
- −$0
- Vacancy / Maint / Mgmt
- −$257
- Net cashflow
- $83
Break-even live
Sensitivity live
| Price | -10% $134 | -5% $109 | +0% $83 | +5% $58 | +10% $32 |
|---|---|---|---|---|---|
| Rent | -10% $-14 | -5% $35 | +0% $83 | +5% $132 | +10% $180 |
| Rate | -1.0pp $128 | -0.5pp $106 | base $83 | +0.5pp $60 | +1.0pp $36 |
UW: 25.0% down · 7.5% · 30yr · 1.5% tax · 5.0% vac · 8.0% maint · 8.0% mgmt
Financing live
Cash to close
- Down payment
- $22,475
- Closing costs
- $2,697
- Reserves months
- —
- Total cash needed
- —
Loan-product check · same deal, 3 products live
Conventional
25% down · 7.5% · 30yr
- Down + closing
- —
- Monthly P&I
- —
- Monthly cashflow
- —
- DSCR
- —
- Eligible?
- —
Personal DTI + credit; lowest rate.
DSCR
20% down · 8.5% · 30yr
- Down + closing
- —
- Monthly P&I
- —
- Monthly cashflow
- —
- DSCR
- —
- Eligible?
- —
No personal income docs; deal must DSCR.
Hard money
10% down · 12.0% · 12mo
- Down + closing
- —
- Monthly P&I
- —
- Monthly cashflow
- —
- DSCR
- —
- Eligible?
- —
Short-term bridge; refi at stabilization.
Listing history 10 events
-
2026-06-04statusdays on market $89,900 Pending 30 DOM
-
2026-06-02days on market $89,900 Active 29 DOM
-
2026-06-01days on market $89,900 Active 28 DOM
-
2026-05-31days on market $89,900 Active 27 DOM
-
2026-05-04$89,900 Active 806-char remark
-
2014-04-15soldstatus 167-char remark
Show marketing remark (167 chars)
4 bedroom cottage in Rosendale, MO. This home has a main floor rec room, detached garage, original wood floors, and tons of original character including a window seat.
-
2014-02-10$20,000 167-char remark
Show marketing remark (167 chars)
4 bedroom cottage in Rosendale, MO. This home has a main floor rec room, detached garage, original wood floors, and tons of original character including a window seat.
-
2006-06-28soldstatus
Show marketing remark (123 chars)
Rosendale-Small town living-Updated decor-Large level lot-Detached garage-Fenced back yard-Nice home-Priced below appraisal
-
2006-03-16$62,500
Show marketing remark (123 chars)
Rosendale-Small town living-Updated decor-Large level lot-Detached garage-Fenced back yard-Nice home-Priced below appraisal
-
2002-05-01soldstatus
ⓘ Source: listings_history table (triggers on properties + properties_extension) + one-shot
backfill from property_details.listing_events for pre-trigger history.
Tax reassessment forecast MO · Resets to sale price
- Current annual tax
- $753 · $63/mo
- Projected year-2 tax
- $872 · $73/mo
- Expected delta
- +$119/yr (+$10/mo · 15.8%)
ⓘ Screening estimate from a state-policy table — verify with the county assessor before closing.
Climate risk First Street
- Flood 3/10 Moderate FEMA zone A · 17% chance over 30 yrs
- Wildfire 3/10 Moderate
- Heat 4/10 Moderate 7 d/yr ≥106°F today · 16 d/yr by 30 yrs out
- Wind 2/10 Low
- Air quality 1/10 Low 0 unhealthy d/yr today · 0 by 30 yrs out
Nearby sold comps map
Loading sold comps map…
Walkable amenities ~0.75 mi
Loading nearby amenities…
Taxation est. · year 1
- Rental income
- $14,712
- − Mortgage interest
- −$5,036
- − Property taxes
- −$753
- − Insurance
- −$4,214
- − Repairs & maintenance
- −$1,177
- − Management
- −$1,177
- − Depreciation
- −$2,615
- Taxable loss
- −$260
- Est. tax savings @ 24.0%
- +$63
- After-tax cash flow
- $1,060/yr
For passive investors: Depreciation is non-cash, so a rental often shows a tax loss while cash-flowing — sheltering income. Rental losses are passive: they offset passive income freely, and up to $25,000/yr can offset ordinary (W-2) income if you actively participate and your MAGI is under $100k (phasing out to $0 by $150k); unused losses carry forward. On sale, claimed depreciation is recaptured at up to 25%, and gains may owe capital-gains tax (a 1031 exchange can defer both). Figures are a year-1 estimate at your 24.0% rate — not tax advice; consult a CPA.
Schools (NCES district)
- District
- North Andrew County R-VI
- NCES district ID
- 2922710
- Math proficiency
- 35% ▬ 0.00%
- Reading proficiency
- 50% ▲ 10.00%
- Median HH income
- $51,808
- Composite
- 39.03/100
- National rank
- #8279
- State rank
- #236 of 535 in MO
Livability — Rosendale
- Score
- 55/100
- State rank
- #756
- US rank
- #23515
Category grades
Schools grade is shown separately in the Schools card above.
Census & demographics
- Census place
- Rosendale, MO
- Population (ZIP)
- 530
Population outlook (Andrew County) Hauer SSP2
- Today (2025)
- 17,463 people
- By 2030
- 17,412 · -0.3%
- By 2040
- 17,051 · -2.4%
- By 2050
- 16,359 · -6.3%
- By 2075
- 14,483 · -17.1%
- By 2100
- 11,788 · -32.5%
Race, ethnicity, and origin ACS 2023
- Neighborhood character
- Predominantly White (94%)
- Race & ethnicity
- White 94% Black 5% Two or more races 2%
- Common ancestry
- Portuguese 5% European 3% Italian 1%
- Languages at home
- 91% English-only · Spanish 9%
Political lean MEDSL · Andrew
- 2024 margin
- Solid R (+51.8) · D 23.5% · R 75.2% · Other 1.3%
- 2008→2024 swing
- -29.7pp toward R · 2008: -22.0pp · 2024: -51.8pp
- All cycles
- 2024: R+51.8 2020: R+50.3 2016: R+50.5 2012: R+33.8 2008: R+22.0
Not yet ingested
- Civics
- —
Market trends
- HPI YoY
- ▲ 8.18%
- Current HPI
- 258.0805
- Rent YoY
- —
- Metro
- —
- State GDP YoY
- ▲ 1.84%
- F500 in state
- 20
Industry mix (Fortune 500 HQ in MO)
| Industry | F500 HQs | Revenue |
|---|---|---|
| Healthcare | 1 | $163B |
|
||
| Insurance | 1 | $21B |
|
||
| Industrial Technology | 1 | $17B |
|
||
| Retail | 1 | $16B |
|
||
| Industrial Distribution | 1 | $10B |
|
||
| Utilities | 1 | $9B |
|
||
Price history
+43.8% since first listed8 events — show timeline
- 2026-06-12 Sold (MLS) — Heartland MLS as Distributed by MLS Grid
- 2026-06-03 Pending — Heartland MLS as Distributed by MLS Grid
- 2026-05-04 Listed $89,900 Heartland MLS as Distributed by MLS Grid
- 2014-04-15 Sold (MLS) — Heartland MLS as Distributed by MLS Grid
- 2014-02-10 Listed $20,000 Heartland MLS as Distributed by MLS Grid
- 2006-06-28 Sold (MLS) — Heartland MLS as Distributed by MLS Grid
- 2006-03-16 Listed $62,500 Heartland MLS as Distributed by MLS Grid
- 2002-05-01 Sold (Public Records) — Public Records
Property tax history
+1.0%/yrLatest (2025): $753 · +9.8% YoY. Source: county tax records.
Cash-flow waterfall
monthlySold comps — $/sqft
last 12 mo · ≤1 miLoading sold comps…