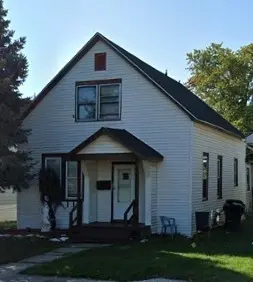
2728 Jackson Ave · South Chicago Heights, IL
Flood risk 1/10 · Minimal
- FEMA flood zone
- X (unshaded)
- Chance of flooding over 30 yrs
- 0.0%
- Est. flood insurance / yr
- $507 – $1,088
Fire risk 1/10 · Minimal
- Est. fire insurance / yr
- $804 – $1,492
Heat risk 3/10 · Minor
- Hot days now (above 101°F)
- 7 days/yr
- Hot days in 30 yrs
- 16 days/yr
Wind risk 2/10 · Minimal
- Chance of severe wind over 30 yrs
- —
Air-quality risk 2/10 · Minimal
- Unhealthy air days now
- 2 days/yr
- Unhealthy air days in 30 yrs
- 2 days/yr
Risk factors via First Street. Map © Google.
Why this score? — see what drove the D grade
The composite is a weighted blend of 9 inputs, each scored 0–100. Each bar is that input's sub-score; the figure is the points it added to the 100-point composite (weight × sub-score).
- Cash flow +15.0/30.0
- ARV discount +7.5/15.0
- 1% rule +5.0/10.0
- DSCR +5.0/10.0
- Rent growth +4.1/5.0
- Livability +3.8/5.0
- Condition / age +2.5/5.0
- Schools +0.7/10.0
- Appreciation +0.0/10.0
$39,000
🖨 Deal sheet 📄 Offer letter ✓ Due diligence
Listing remarks
Please note - property sold AS-IS/WHERE-IS, no survey delivered, taxes paid through 2021 1st installment - with no tax prorations for the 2021 2nd installment, 2022, 2023, 2024 or 2025 tax year or years thereafter, inspections waived. Seller rider is attached and is required to be signed by all parties. A $3,000 non-refundable earnest money deposit is required.
Key facts
- 4,687 sq ft lot
- Built 1913
- Listed 66 days
Property features AI
Finance
- Other: Parcel number 32294140290000
- HOA & community: No master association fee required
Exterior
- Utilities: Public water; Public sewer
- Home design: Detached single-family home; 1.5-story layout; Fee simple ownership; Built more than 100 years ago; Property was built before 1978
- Construction: Aluminum siding
- Exterior features: Less than 0.25-acre lot; Lot dimensions: 4687
Interior
- Kitchen: Kitchen on the main level (11 x 11)
- Bedrooms: Three bedrooms (all on the main level); Bedroom dimensions include 11 x 10 and 14 x 14; Master bedroom on the main level (11 x 11)
- Bathrooms: Two full bathrooms
- Heating & cooling: Natural gas heating; Forced air system
- Interior features: Six total rooms; School bus service and commuter transit access nearby
- Laundry & utility: Laundry room
Neighborhood map
What this means for you Summary
Snapshot
- This is a 3-bed/1.0-bath single-family listed at $39k.
Deal economics
- At list price, monthly cash flow is $1k ($14k/yr) — positive.
- The deal already cash-flows at list — no discount required.
- Meets the 1% rule at list price ($2k rent vs $39k).
- Recommended offer: $37k (6.0% below list) — sets the bar for market timing.
Location & tenants
- Location reads 76/100 on livability (#173 in IL, #3,304 nationally) — a middle-class / working-renter tenant base. Strengths: commute A+, cost of living A+, housing A+; Watch: amenities C-, crime D+, employment D+.
- Bloom Twp Hsd 206 (suburban): math 8% / reading 9% proficiency, ranked #591 of 620 in IL (top 95%) — low school quality limits family demand, transient renter base, plan for 1-2y turnover.
- Market conditions: Rents rising fast (+6.5%/yr); 222 active listings in the ZIP; 16 comparable units currently listed for rent nearby; rentals at typical pace (median 21d on market — plan ~3-4 weeks tenant-placement turnaround); 6,272 units permitted in Cook County in 2024 (4,658 in 5+ unit buildings).
- This rent runs 34% of the median local income ($62k/yr) — at the standard rent-burdened threshold; future hikes will face affordability resistance.
Forward outlook
- Local home prices are declining (-3.0%/yr); year-one equity from $270 of loan paydown is wiped out by about $1k of value loss. Plan a longer hold.
- At projected returns (-3.0% appreciation + 6.5% rent growth), your $11k cash investment doubles in ~1 year — after that, you're playing with house money.
Negotiation context
- It's been on market 66 days — a 6% lower offer ($37k) is reasonable based on typical stale-listing flexibility.
- 7 sale attempts since 4y ago with the ask held roughly flat each time — persistent listings suggest the price (not the market) is what's stuck; bring a comps-based counter.
Risks & watch-outs
- Watch-outs: built in 1913 — expect roof / HVAC / electrical / plumbing capex.
Questions for the listing agent
- It's been on market 66 days. Have you received any prior offers? Is the seller open to a 6% concession, seller financing, or rate buy-down credit?
- Built in 1913 — when were the roof, HVAC, electrical panel, plumbing, and water heater last replaced?
- Why hasn't it sold? Are there any deal-killer items the seller is aware of (foundation, flood, title, zoning, code violations)?
- Is there a deadline driving the sale (1031 exchange, divorce, estate, relocation)? That informs how much negotiation room exists.
- Schools are F-rated, which usually means shorter tenancies and higher turnover. Who's the typical renter profile here, and what's been the actual vacancy rate?
- Crime grade is D in this area — have there been break-ins, vandalism, or insurance claims at this property in the last 3 years? What carrier currently insures it and at what premium?
- The area grade is low — what's the realistic commute time and amenity access for the typical tenant pool here? Any planned neighborhood developments (good or bad) we should know about?
- What's the average days-on-market for RENTAL listings here right now (not sales)? A rising rental-DOM trend means longer vacancies and softer asking-rent achievability than the comps imply.
- What's the recent tenant-quality profile in this submarket — average credit score on applications, eviction rate, late-payment / NSF rate, and stable-employment percentage? A property-management company in the area should have these aggregated.
- How much new for-sale + rental construction is in the pipeline within 1–3 miles? Heavy new supply typically softens prices + rents 12–24 months out; constrained supply supports both.
Investment metrics
- 1% rule
- 4.55% ✓
- Cap rate
- 41.10%
- Cash-on-cash
- 124.31%
- DSCR
- 6.53
- GRM
- 1.8
CMA / ARV
- ARV (on-the-fly)
- $209,898
- Comps found
- 12
Show comp detail 12 sales within ~0.75 mi
| Address | Dist | Beds/Ba | Sqft | Sold | Price | $/sf | Match |
|---|---|---|---|---|---|---|---|
| 97 W 29th St | 0.22mi | 3/1.0 | 1,200 (-3%) | 3mo | $209,000 | $174 | 82 |
| 147 W 27th Pl | 0.32mi | 3/1.5 | 1,259 (+1%) | 10mo | $185,000 | $147 | 73 |
| 175 W 28th St | 0.32mi | 3/2.0 | 1,280 (+3%) | 16mo | $295,000 | $230 | 62 |
| 3208 Enterprise Park Ave | 0.70mi | 3/1.0 | 1,326 (+7%) | 8mo | $202,000 | $152 | 49 |
| 3033 Commercial Ave | 0.39mi | 3/1.0 | 1,082 (-13%) | 14mo | $170,000 | $157 | 48 |
| 202 Interocean Ave | 0.42mi | 3/1.5 | 1,080 (-13%) | 11mo | $183,000 | $169 | 47 |
| 3033 Enterprise Park Ave | 0.49mi | 3/2.0 | 1,100 (-11%) | 14mo | $210,000 | $191 | 42 |
| 233 Magnolia Plz | 0.59mi | 3/1.0 | 1,094 (-12%) | 16mo | $120,000 | $110 | 39 |
| 3201 Dornell Ave | 0.74mi | 3/1.0 | 1,100 (-11%) | 13mo | $169,000 | $154 | 36 |
| 75 W 23rd St | 0.54mi | 3/2.0 | 1,426 (+15%) | 13mo | $110,000 | $77 | 35 |
| 247 E 25th St | 0.59mi | 3/2.0 | 1,080 (-13%) | 16mo | $192,000 | $178 | 33 |
| 3113 Euclid Dr | 0.65mi | 3/2.0 | 1,066 (-14%) | 12mo | $232,000 | $218 | 32 |
Match score weights: distance 35% · size 25% · config 20% · recency 20%. Top-matched comps best support the ARV.
Projected returns pro-forma
-3.0% appreciation · 6.48% rent growth · sell at horizon
- IRR
- —
- Equity multiple
- 7.61×
- Total profit
- $72,177
- Equity at exit
- $5,815
- IRR
- —
- Equity multiple
- 17.85×
- Total profit
- $184,052
- Equity at exit
- $3,372
Cash invested: $10,920 (down + closing). Projections, not guarantees.
Landlord ↔ Tenant lean methodology
- Overall (STATE)
- 43 Moderately Tenant-Leaning
- State Illinois
- 43 Moderately Tenant-Leaning · D+7
- County
- — inherits STATE
- City
- — inherits STATE
ZIP-level market 60411
- Home prices YoY
- -33.9%
- Rents YoY
- 6.5%
- Active inventory
- 222
- Price-to-rent
- 1.8×
Monthly cashflow live
- Estimated rent
- $1,773 high interval (Pro) →
- Mortgage (P&I)
- −$205
- Tax est. 1.5%
- −$49 /mo · $585/yr
- Insurance
- −$16
- HOA
- −$0
- Vacancy / Maint / Mgmt
- −$372
- Net cashflow
- $1,131
Break-even live
UW: 25.0% down · 7.5% · 30yr · 1.5% tax · 5.0% vac · 8.0% maint · 8.0% mgmt
Financing live
Cash to close
- Down payment
- $9,750
- Closing costs
- $1,170
- Reserves months
- —
- Total cash needed
- —
Loan-product check · same deal, 3 products live
Conventional
25% down · 7.5% · 30yr
- Down + closing
- —
- Monthly P&I
- —
- Monthly cashflow
- —
- DSCR
- —
- Eligible?
- —
Personal DTI + credit; lowest rate.
DSCR
20% down · 8.5% · 30yr
- Down + closing
- —
- Monthly P&I
- —
- Monthly cashflow
- —
- DSCR
- —
- Eligible?
- —
No personal income docs; deal must DSCR.
Hard money
10% down · 12.0% · 12mo
- Down + closing
- —
- Monthly P&I
- —
- Monthly cashflow
- —
- DSCR
- —
- Eligible?
- —
Short-term bridge; refi at stabilization.
Rent comps 16 comps
| Address | Beds | Baths | Sqft | Rent | $/sqft | DOM | Units | Dist |
|---|---|---|---|---|---|---|---|---|
| 169 E 23rd St Unit 1F Chicago Heights, IL | 3.0 | 1.0 | 1200 | $1,550 | $1.29 | 12d | 1 | 0.52mi |
| 41 E Main St Unit 2 Chicago Heights, IL | 2.0 | 1.0 | 1000 | $1,550 | $1.55 | 7d | 1 | 0.55mi |
| 236 Chestnut Ave Unit S South Chicago Heights, IL | 3.0 | 1.0 | 1032 | $2,000 | $1.94 | 24d | 1 | 0.74mi |
| 63 Hickory St Unit 2 Chicago Heights, IL | 3.0 | 1.0 | 900 | $1,700 | $1.89 | 24d | 1 | 0.81mi |
| 1667 Buena Vista Ave Unit 1st floor Chicago Heights, IL | 2.0 | 1.0 | 1300 | $1,525 | $1.17 | 24d | 1 | 0.91mi |
| 1631 Buena Vista Ave Unit 2 Chicago Heights, IL | 4.0 | 1.0 | 1200 | $1,900 | $1.58 | 24d | 1 | 0.97mi |
| 3135 Chicago Rd Unit 2nd Steger, IL | 2.0 | 1.0 | 1300 | $1,650 | $1.27 | 24d | 1 | 1.04mi |
| 83 W 15th St #1 Chicago Heights, IL | 3.0 | 1.0 | 1050 | $1,500 | $1.43 | 3d | 1 | 1.14mi |
| 41 W 14th Pl Unit 1 Chicago Heights, IL | 3.0 | 1.0 | 1250 | $1,750 | $1.40 | 11d | 1 | 1.17mi |
| 370 E 17th St Chicago Heights, IL | 3.0 | 1.0 | 1058 | $2,600 | $2.46 | 16d | 1 | 1.32mi |
| 417 W Hickory St Unit 2 Chicago Heights, IL | 3.0 | 1.0 | 900 | $1,800 | $2.00 | 20d | 1 | 1.42mi |
| 1203 Emerald Ave Unit 1 Chicago Heights, IL | 3.0 | 1.0 | 1200 | $1,550 | $1.29 | 1d | 1 | 1.43mi |
| 432 Hickory St Unit 2 Chicago Heights, IL | 3.0 | 1.0 | 1200 | $1,800 | $1.50 | 20d | 1 | 1.45mi |
| 436 W Hickory St Unit Na Chicago Heights, IL | 3.0 | 1.0 | 1091 | $1,800 | $1.65 | 1d | 1 | 1.46mi |
| 444 Hickory St Unit 2A Chicago Heights, IL | 3.0 | 1.0 | 900 | $1,695 | $1.88 | 1d | 1 | 1.47mi |
| 22 E 35th St Steger, IL | 2.0 | 1.0 | 740 | $1,250 | $1.69 | 24d | 1 | 1.48mi |
Listing history 31 events
-
2026-06-18days on market $39,000 Active 66 DOM
-
2026-06-17days on market $39,000 Active 65 DOM
-
2026-06-16days on market $39,000 Active 64 DOM
-
2026-06-15days on market $39,000 Active 63 DOM
-
2026-06-13days on market $39,000 Active 61 DOM
-
2026-06-13days on market $39,000 Active 60 DOM
-
2026-06-09days on market $39,000 Active 57 DOM
-
2026-06-08days on market $39,000 Active 56 DOM
-
2026-06-07days on market $39,000 Active 55 DOM
-
2026-06-04days on market $39,000 Active 52 DOM
-
2026-06-03days on market $39,000 Active 51 DOM
-
2026-06-02days on market $39,000 Active 50 DOM
-
2026-06-01days on market $39,000 Active 49 DOM
-
2026-05-31days on market $39,000 Active 48 DOM
-
2026-04-11$39,000 Active
-
2025-12-02historical
-
2025-09-25price
-
2025-08-20Active
-
2023-12-11historical
-
2023-09-07Active
-
2023-07-19historical
-
2023-07-05Active
-
2023-06-30historical
-
2023-05-25Active
-
2023-05-25historical
-
2023-03-29price
-
2023-03-09Active
-
2022-04-26historical
-
2022-03-05Active
-
1992-10-27soldstatus $51,000
-
1984-09-01soldstatus $25,000
ⓘ Source: listings_history table (triggers on properties + properties_extension) + one-shot
backfill from property_details.listing_events for pre-trigger history.
Climate risk First Street
- Flood 1/10 Low FEMA zone X (unshaded) · 0% chance over 30 yrs
- Wildfire 1/10 Low
- Heat 3/10 Moderate 7 d/yr ≥101°F today · 16 d/yr by 30 yrs out
- Wind 2/10 Low
- Air quality 2/10 Low 2 unhealthy d/yr today · 2 by 30 yrs out
Nearby sold comps map
Loading sold comps map…
Walkable amenities ~0.75 mi
Loading nearby amenities…
Taxation est. · year 1
- Rental income
- $21,276
- − Mortgage interest
- −$2,185
- − Property taxes
- −$585
- − Insurance
- −$195
- − Repairs & maintenance
- −$1,702
- − Management
- −$1,702
- − Depreciation
- −$1,135
- Taxable income
- $13,773
- Est. tax owed @ 24.0%
- −$3,306
- After-tax cash flow
- $10,269/yr
For passive investors: Depreciation is non-cash, so a rental often shows a tax loss while cash-flowing — sheltering income. Rental losses are passive: they offset passive income freely, and up to $25,000/yr can offset ordinary (W-2) income if you actively participate and your MAGI is under $100k (phasing out to $0 by $150k); unused losses carry forward. On sale, claimed depreciation is recaptured at up to 25%, and gains may owe capital-gains tax (a 1031 exchange can defer both). Figures are a year-1 estimate at your 24.0% rate — not tax advice; consult a CPA.
Schools (NCES district)
- District
- Bloom Twp Hsd 206
- NCES district ID
- 1706420
- Math proficiency
- 8% ▼ -3.00%
- Reading proficiency
- 9% ▼ -8.00%
- Median HH income
- $39,795
- Composite
- 7.4/100
- National rank
- #9952
- State rank
- #591 of 620 in IL
Livability — South Chicago Heights
- Score
- 76/100
- State rank
- #173
- US rank
- #3304
Category grades
Schools grade is shown separately in the Schools card above.
Census & demographics
- Census place
- South Chicago Heights, IL
- County
- Cook County · 4,486,803 people
- Metro
- Chicago-Naperville-Elgin, IL-IN-WI
- Population (ZIP)
- 52,175
- Household income
- $62,073
- Rent vs Own
- Severe rent burden
- 1714.0
Population outlook (Cook County) Hauer SSP2
- Today (2025)
- 5,347,519 people
- By 2030
- 5,357,703 · +0.2%
- By 2040
- 5,324,924 · -0.4%
- By 2050
- 5,230,762 · -2.2%
- By 2075
- 4,785,735 · -10.5%
- By 2100
- 4,188,836 · -21.7%
Race, ethnicity, and origin ACS 2023
- Neighborhood character
- Diverse neighborhood (Simpson 0.66)
- Race & ethnicity
- Black 49% Hispanic / Latino 26% White 19% Two or more races 11%
- Hispanic origin (detail)
- Mexican 22% Puerto Rican 2%
- Common ancestry
- Romanian 4% Portuguese 1% Lithuanian 1%
- Foreign-born
- 12% · Canada
- Languages at home
- 76% English-only · Spanish 21% Russian/Polish/Slavic 1% Other Indo-European 1%
Political lean MEDSL · Cook
- 2024 margin
- Solid D (+42.0) · D 70.4% · R 28.4% · Other 1.2%
- 2008→2024 swing
- -11.4pp toward R · 2008: 53.4pp · 2024: 42.0pp
- All cycles
- 2024: D+42.0 2020: D+50.3 2016: D+53.0 2012: D+49.4 2008: D+53.4
Not yet ingested
- Civics
- —
Market trends
- HPI YoY
- ▼ -108.75%
- Current HPI
- 212.4058
- Rent YoY
- ▲ 6.48%
- Metro
- Chicago-Naperville-Elgin, IL-IN-WI
- State GDP YoY
- ▲ 1.59%
- F500 in state
- 60
Industry mix (Fortune 500 HQ in IL)
| Industry | F500 HQs | Revenue |
|---|---|---|
| Insurance | 4 | $201B |
|
||
| Consumer Goods | 4 | $87B |
|
||
| Industrial Machinery | 3 | $64B |
|
||
| Healthcare | 2 | $55B |
|
||
| Retail / Pharmacy | 1 | $148B |
|
||
| Agriculture / Food | 1 | $86B |
|
||
Price history
+56.0% since first listed17 events — show timeline
- 2026-04-11 Listed $39,000 MRED as Distributed by MLS Grid
- 2025-12-02 Listing Removed — MRED as Distributed by MLS Grid
- 2025-09-25 Price Changed — MRED as Distributed by MLS Grid
- 2025-08-20 Listed — MRED as Distributed by MLS Grid
- 2023-12-11 Listing Removed — MRED as Distributed by MLS Grid
- 2023-09-07 Listed — MRED as Distributed by MLS Grid
- 2023-07-19 Listing Removed — MRED as Distributed by MLS Grid
- 2023-07-05 Listed — MRED as Distributed by MLS Grid
- 2023-06-30 Listing Removed — MRED as Distributed by MLS Grid
- 2023-05-25 Listing Removed — MRED as Distributed by MLS Grid
- 2023-05-25 Listed — MRED as Distributed by MLS Grid
- 2023-03-29 Price Changed — MRED as Distributed by MLS Grid
- 2023-03-09 Listed — MRED as Distributed by MLS Grid
- 2022-04-26 Listing Removed — MRED as Distributed by MLS Grid
- 2022-03-05 Listed — MRED as Distributed by MLS Grid
- 1992-10-27 Sold (Public Records) $51,000 Public Records
- 1984-09-01 Sold (Public Records) $25,000 Public Records
Property tax history
+5.6%/yrLatest (2023): $3,571 · -4.9% YoY. Source: county tax records.
Cash-flow waterfall
monthlySold comps — $/sqft
last 12 mo · ≤1 miLoading sold comps…