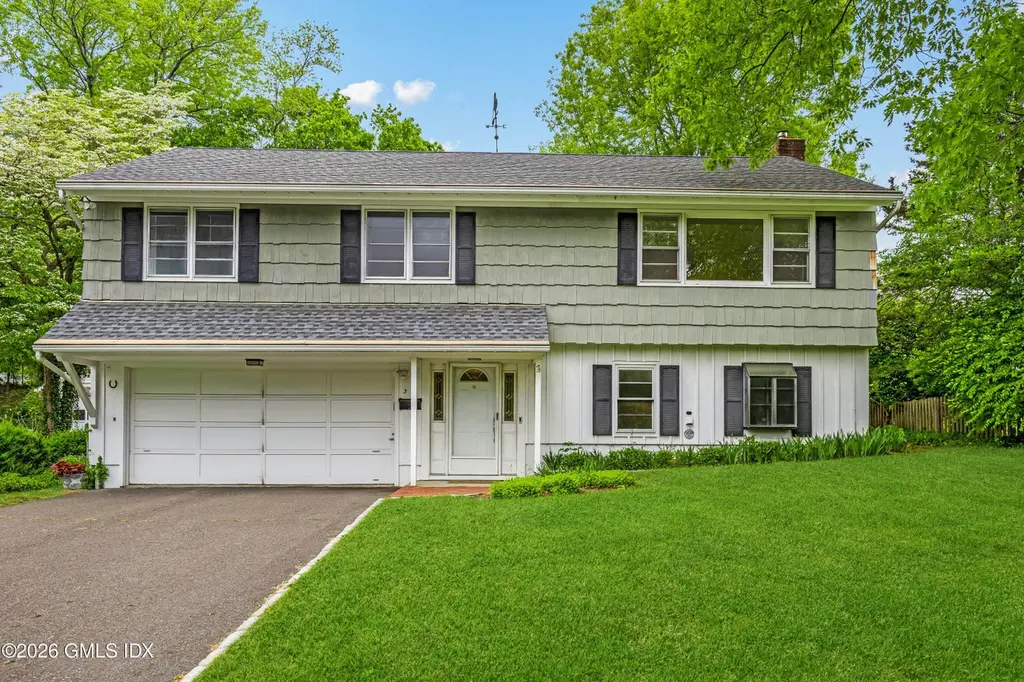
34 Ridge Rd · Cos Cob, CT
Flood risk 1/10 · Minimal
- FEMA flood zone
- X (unshaded)
- Chance of flooding over 30 yrs
- 0.0%
- Est. flood insurance / yr
- $473 – $860
Fire risk 1/10 · Minimal
- Est. fire insurance / yr
- $829 – $1,539
Heat risk 6/10 · Moderate
- Hot days now (above 98°F)
- 7 days/yr
- Hot days in 30 yrs
- 15 days/yr
Wind risk 6/10 · Moderate
- Chance of severe wind over 30 yrs
- 67.0%
Air-quality risk 6/10 · Moderate
- Unhealthy air days now
- 9 days/yr
- Unhealthy air days in 30 yrs
- 13 days/yr
Risk factors via First Street. Map © Google.
Why this score? — see what drove the D+ grade
The composite is a weighted blend of 9 inputs, each scored 0–100. Each bar is that input's sub-score; the figure is the points it added to the 100-point composite (weight × sub-score).
- ARV discount +15.0/15.0
- Appreciation +9.0/10.0
- Cash flow +7.7/30.0
- Schools +6.6/10.0
- Livability +3.7/5.0
- Rent growth +2.5/5.0
- Condition / age +2.5/5.0
- DSCR +1.8/10.0
- 1% rule +1.3/10.0
$1,495,000
🖨 Deal sheet 📄 Offer letter ✓ Due diligence
Listing remarks
Tucked away in the heart of Cos Cob, this spacious 3-bedroom, 2-bath home offers an incredible opportunity to enjoy convenience, comfort, and potential in one of Greenwich's most desirable neighborhoods. Featuring approximately 2,400 sq ft of living space, this 1966 built residence is ideally located within close distance to schools, shops, and metro-north for an easy commute to New York City. Inside, the home offers generously sized rooms throughout, including a large eat-in kitchen with access to the oversize deck, expansive living and dining rooms, and a substantial lower-level family room, with fireplace, perfect for entertaining, recreation or flexible living space. Step outside to enj
Key facts
- 8,276 sq ft lot
- 2 garage spots
- Pool
Property features AI
Finance
- Other: Trust sale
Exterior
- Parking: 2-car garage
- Utilities: Public water
- Home design: Single-family residence; Built in 1966 (effective year 1985); Asphalt roof; Shingle siding; Zoned R-7
- Construction: Shingle siding construction
- Exterior features: Deck; Private pool; Fenced, level lot
Interior
- Kitchen: Eat-in kitchen
- Bathrooms: 2 full bathrooms
- Heating & cooling: Central air conditioning; Natural gas heating; Hot water heating
- Interior features: Eat-in kitchen; Fireplace (1)
Neighborhood map
What this means for you Summary
Snapshot
- This is a 3-bed/2.0-bath single-family listed at $1.50M.
Deal economics
- At list price, monthly cash flow is $-2k ($-20k/yr) — negative.
- To cash-flow at today's rent, offer at most $1.19M (20.1% below list).
- To meet the 1% rule (rent ≥ 1% of price), the offer needs to be $935k (37.5% below list).
- Recommended offer: $935k (37.5% below list) — sets the bar for 1% rule.
Location & tenants
- Location reads 73/100 on livability (#72 in CT) — a middle-class / working-renter tenant base. Strengths: crime A+, employment A+, health & safety B; Watch: housing D+, amenities F, commute F.
- Greenwich School District (suburban): math 64% / reading 73% proficiency, ranked #12 of 153 in CT (top 8%) — acceptable for families but not a draw, mixed tenant base, ~2y average lease; only 11% free/reduced lunch — higher-income household profile.
- Zoned schools: Cos Cob School (math 62% / reading 67%, grade B, #118 of 553 statewide, top 23%, 337 students, 13% FRL); Central Middle School (math 60% / reading 71%, grade A-, #26 of 175 statewide, top 16%, 506 students, 18% FRL).
- Market conditions: 31 active listings in the ZIP; 21 comparable units currently listed for rent nearby; rentals at typical pace (median 22d on market — plan ~3-4 weeks tenant-placement turnaround); 1,151 units permitted in Western Connecticut Planning Region in 2024 (714 in 5+ unit buildings).
Forward outlook
- In year one you build about $129k of equity ($10k loan paydown + $118k appreciation (7.9% local appreciation)).
- By year 2, paydown + projected appreciation supports a ~$206k cash-out refi (75% LTV) — recoverable capital for the next deal without selling this one.
Negotiation context
- Only 8 days on market — expect competitive offers; lowballing is unlikely to land.
- Current owner paid $339k; list at $1.50M implies a 341% gain — meaningful room to come down on a strong offer.
Risks & watch-outs
- Climate carrying-cost: major wind risk, 67% chance of damaging wind over 30y; extreme-heat days projected 7→15/yr by 2055 (HVAC capex compounding) — expect insurance premiums to compound above CPI over the hold.
Questions for the listing agent
- What do current leases actually rent for vs. the listed asking? Can we see a recent rent roll and the last 12 months of T-12 income?
- Built in 1966 — when were the roof, HVAC, electrical panel, plumbing, and water heater last replaced?
- Is there a deadline driving the sale (1031 exchange, divorce, estate, relocation)? That informs how much negotiation room exists.
- Schools are A-rated — typically a magnet for longer-tenancy family renters. What's the average tenant stay here, and is there a school-zone premium baked into asking?
- The area grade is low — what's the realistic commute time and amenity access for the typical tenant pool here? Any planned neighborhood developments (good or bad) we should know about?
- What's the average days-on-market for RENTAL listings here right now (not sales)? A rising rental-DOM trend means longer vacancies and softer asking-rent achievability than the comps imply.
- What's the recent tenant-quality profile in this submarket — average credit score on applications, eviction rate, late-payment / NSF rate, and stable-employment percentage? A property-management company in the area should have these aggregated.
- How much new for-sale + rental construction is in the pipeline within 1–3 miles? Heavy new supply typically softens prices + rents 12–24 months out; constrained supply supports both.
Investment metrics
- 1% rule
- 0.63% ✗
- Cap rate
- 4.93%
- Cash-on-cash
- -4.88%
- DSCR
- 0.78
- GRM
- 13.3
CMA / ARV
- ARV (median comp)
- $1,806,591
- List price
- $1,495,000
- Delta
- -17.25%
- Verdict
- UNDERPRICED
- Comps
- 20 within 1.0 mi
Show comp detail 12 sales within ~0.75 mi
| Address | Dist | Beds/Ba | Sqft | Sold | Price | $/sf | Match |
|---|---|---|---|---|---|---|---|
| 12 Osee Pl | 0.21mi | 3/2.5 | 2,384 (+2%) | 13mo | $1,895,000 | $795 | 74 |
| 16 Kent Pl | 0.29mi | 4/2.5 (+1) | 2,410 (+3%) | 1mo | $1,690,000 | $701 | 74 |
| 76 Sinawoy Rd | 0.21mi | 4/2.5 (+1) | 2,423 (+3%) | 7mo | $2,250,000 | $929 | 72 |
| 68 Valleywood Rd | 0.11mi | 3/2.0 | 2,096 (-11%) | 8mo | $1,610,000 | $768 | 71 |
| 15 Ridge Rd | 0.07mi | 4/2.0 (+1) | 2,073 (-12%) | 8mo | $1,420,000 | $685 | 66 |
| 26 Valleywood Rd | 0.17mi | 4/2.0 (+1) | 2,439 (+4%) | 18mo | $1,700,000 | $697 | 65 |
| 95 Valleywood Rd | 0.26mi | 3/4.0 | 2,405 (+3%) | 16mo | $1,915,000 | $796 | 62 |
| 12 Annjim Dr | 0.15mi | 4/2.5 (+1) | 2,520 (+8%) | 18mo | $2,419,000 | $960 | 58 |
| 17 Meadow Dr | 0.30mi | 3/2.0 | 2,662 (+14%) | 7mo | $1,152,000 | $433 | 58 |
| 75 Loughlin Ave | 0.67mi | 4/3.5 (+1) | 2,230 (-5%) | 10mo | $2,180,000 | $978 | 41 |
| 6 Cos Cob Ave | 0.36mi | 3/3.5 | 2,686 (+15%) | 15mo | $1,459,000 | $543 | 40 |
| 12 River Ln | 0.43mi | 4/2.5 (+1) | 2,653 (+13%) | 17mo | $2,225,000 | $839 | 36 |
Match score weights: distance 35% · size 25% · config 20% · recency 20%. Top-matched comps best support the ARV.
Projected returns pro-forma
7.9% appreciation · 3.0% rent growth · sell at horizon
- IRR
- 16.1%
- Equity multiple
- 2.19×
- Total profit
- $497,752
- Equity at exit
- $1,126,063
- IRR
- 15.6%
- Equity multiple
- 4.64×
- Total profit
- $1,523,081
- Equity at exit
- $2,226,007
Cash invested: $418,600 (down + closing). Projections, not guarantees.
Landlord ↔ Tenant lean methodology
- Overall (STATE)
- 27 Tenant-Leaning
- State Connecticut
- 27 Tenant-Leaning · D+7
- County
- — inherits STATE
- City
- — inherits STATE
ZIP-level market 06807
- Home prices YoY
- 4.3%
- Active inventory
- 31
- Price-to-rent
- 13.3×
Monthly cashflow live
- Estimated rent
- $9,350 high interval (Pro) →
- Mortgage (P&I)
- −$7,840
- Tax from tax record
- −$625 /mo · $7,496/yr
- Insurance
- −$623
- HOA
- −$0
- Vacancy / Maint / Mgmt
- −$1,964
- Net cashflow
- $-1,701
Break-even live
UW: 25.0% down · 7.5% · 30yr · 1.5% tax · 5.0% vac · 8.0% maint · 8.0% mgmt
Financing live
Cash to close
- Down payment
- $373,750
- Closing costs
- $44,850
- Reserves months
- —
- Total cash needed
- —
Loan-product check · same deal, 3 products live
Conventional
25% down · 7.5% · 30yr
- Down + closing
- —
- Monthly P&I
- —
- Monthly cashflow
- —
- DSCR
- —
- Eligible?
- —
Personal DTI + credit; lowest rate.
DSCR
20% down · 8.5% · 30yr
- Down + closing
- —
- Monthly P&I
- —
- Monthly cashflow
- —
- DSCR
- —
- Eligible?
- —
No personal income docs; deal must DSCR.
Hard money
10% down · 12.0% · 12mo
- Down + closing
- —
- Monthly P&I
- —
- Monthly cashflow
- —
- DSCR
- —
- Eligible?
- —
Short-term bridge; refi at stabilization.
Rent comps 21 comps
| Address | Beds | Baths | Sqft | Rent | $/sqft | DOM | Units | Dist |
|---|---|---|---|---|---|---|---|---|
| 14 Cos Cob Ave Unit 3 Cos Cob, CT | 3.0 | 2.5 | 1900 | $6,500 | $3.42 | 43d | 1 | 0.36mi |
| 28 Pleasant St Cos Cob, CT | 4.0 | 2.5 | 2140 | $6,250 | $2.92 | 11d | 1 | 0.39mi |
| 78 River Rd #15 Cos Cob, CT | 3.0 | 2.5 | 2381 | $12,000 | $5.04 | 44d | 1 | 0.47mi |
| 78 River Rd #15 Cos Cob, CT | 3.0 | 3.5 | 2381 | $12,000 | $5.04 | 43d | 1 | 0.47mi |
| 1 Christiano St Unit B Cos Cob, CT | 2.0 | 2.0 | 2124 | $2,800 | $1.32 | 43d | 1 | 0.49mi |
| 1 Cary Rd Riverside, CT | 4.0 | 3.5 | 3300 | $13,500 | $4.09 | 43d | 1 | 0.72mi |
| 24 Juniper Ln Riverside, CT | 4.0 | 3.5 | 2843 | $14,000 | $4.92 | 3d | 1 | 0.82mi |
| 44 Riverside Ln Riverside, CT | 3.0 | 3.5 | 2404 | $19,000 | $7.90 | 3d | 1 | 0.87mi |
| 17 Circle Dr Greenwich, CT | 3.0 | 3.0 | 1911 | $7,500 | $3.92 | 14d | 1 | 0.92mi |
| 15 Dandy Dr Cos Cob, CT | 3.0 | 2.0 | 1762 | $6,500 | $3.69 | 21d | 1 | 0.94mi |
| 38 Sheephill Rd Riverside, CT | 3.0 | 2.5 | 2600 | $8,200 | $3.15 | 43d | 1 | 1.00mi |
| 40 Mianus View Ter Cos Cob, CT | 4.0 | 3.5 | 2895 | $14,500 | $5.01 | 11d | 1 | 1.11mi |
| 146 E Elm St Unit B Greenwich, CT | 4.0 | 3.5 | 2809 | $9,700 | $3.45 | 19d | 1 | 1.24mi |
| 155 Milbank Ave Greenwich, CT | 4.0 | 3.5 | 2794 | $25,000 | $8.95 | 43d | 1 | 1.30mi |
| 116 E Elm St Unit A Greenwich, CT | 3.0 | 3.5 | 2150 | $7,750 | $3.60 | 3d | 1 | 1.33mi |
| 15 Lancer Rd Riverside, CT | 4.0 | 2.5 | 3031 | $8,889 | $2.93 | 23d | 1 | 1.37mi |
| 8 Perry Pl Riverside, CT | 4.0 | 3.0 | 2556 | $11,500 | $4.50 | 21d | 1 | 1.39mi |
| 197 Sheephill Rd Unit C Riverside, CT | 2.0 | 3.5 | 2354 | $7,500 | $3.19 | 10d | 1 | 1.42mi |
| 272 Valley Rd Unit 2 Cos Cob, CT | 2.0 | 1.0 | 2423 | $2,800 | $1.16 | 23d | 1 | 1.44mi |
| 21 Division St Unit A Greenwich, CT | 2.0 | 1.5 | 1696 | $4,500 | $2.65 | 19d | 1 | 1.47mi |
| 31 Cognewaugh Rd Cos Cob, CT | 3.0 | 2.0 | 1620 | $6,000 | $3.70 | 23d | 1 | 1.49mi |
Listing history 2 events
-
2026-05-15historical $1,495,000 915-char remark
-
1993-12-21soldstatus $339,000
ⓘ Source: listings_history table (triggers on properties + properties_extension) + one-shot
backfill from property_details.listing_events for pre-trigger history.
Tax reassessment forecast CT · Partial reset (capped growth)
- Current annual tax
- $7,496 · $625/mo
- Projected year-2 tax
- $19,744 · $1,645/mo
- Expected delta
- +$12,248/yr (+$1,021/mo · 163.4%)
ⓘ Screening estimate from a state-policy table — verify with the county assessor before closing.
Climate risk First Street
- Flood 1/10 Low FEMA zone X (unshaded) · 0% chance over 30 yrs
- Wildfire 1/10 Low
- Heat 6/10 Major 7 d/yr ≥98°F today · 15 d/yr by 30 yrs out
- Wind 6/10 Major 67% chance of damaging wind over 30 yrs
- Air quality 6/10 Major 9 unhealthy d/yr today · 13 by 30 yrs out
Nearby sold comps map
Loading sold comps map…
Walkable amenities ~0.75 mi
Loading nearby amenities…
Taxation est. · year 1
- Rental income
- $112,201
- − Mortgage interest
- −$83,743
- − Property taxes
- −$7,496
- − Insurance
- −$7,475
- − Repairs & maintenance
- −$8,976
- − Management
- −$8,976
- − Depreciation
- −$43,491
- Taxable loss
- −$47,956
- Est. tax savings @ 24.0%
- +$11,509
- After-tax cash flow
- $-8,902/yr
For passive investors: Depreciation is non-cash, so a rental often shows a tax loss while cash-flowing — sheltering income. Rental losses are passive: they offset passive income freely, and up to $25,000/yr can offset ordinary (W-2) income if you actively participate and your MAGI is under $100k (phasing out to $0 by $150k); unused losses carry forward. On sale, claimed depreciation is recaptured at up to 25%, and gains may owe capital-gains tax (a 1031 exchange can defer both). Figures are a year-1 estimate at your 24.0% rate — not tax advice; consult a CPA.
Schools (NCES district)
- District
- Greenwich School District
- NCES district ID
- 0901710
- Math proficiency
- 64% ▼ -7.00%
- Reading proficiency
- 73% ▼ -5.00%
- Median HH income
- $129,257
- Composite
- 65.67/100
- National rank
- #461
- State rank
- #12 of 153 in CT
Livability — Cos Cob
- Score
- 73/100
- State rank
- #72
- US rank
- #5178
Category grades
Schools grade is shown separately in the Schools card above.
Census & demographics
- Census place
- Cos Cob, CT
- City population
- 7,667
- Population (ZIP)
- 7,667
Population outlook (Western Connecticut County) Hauer SSP2
- By 2040
- 685,031
Race, ethnicity, and origin ACS 2023
- Neighborhood character
- Diverse neighborhood (Simpson 0.58)
- Race & ethnicity
- White 63% Two or more races 15% Hispanic / Latino 13% Asian 7% Black 4%
- Hispanic origin (detail)
- Puerto Rican 6% Dominican 1%
- Common ancestry
- Romanian 4% Estonian 4% Italian 3%
- Foreign-born
- 24% · Canada, China, Jamaica
- Languages at home
- 76% English-only · Other Indo-European 9% Spanish 6% Other Asian/Pacific 5%
Political lean MEDSL · Western Connecticut
- 2024 margin
- D (+19.1) · D 58.8% · R 39.7% · Other 1.6%
- All cycles
- 2024: D+19.1
Not yet ingested
- Civics
- —
Market trends
- HPI YoY
- ▲ 7.90%
- Current HPI
- 191.0957
- Rent YoY
- —
- Metro
- —
- State GDP YoY
- ▲ 1.06%
- F500 in state
- 38
Industry mix (Fortune 500 HQ in CT)
| Industry | F500 HQs | Revenue |
|---|---|---|
| Industrial Machinery | 4 | $38B |
|
||
| Insurance | 3 | $71B |
|
||
| Financial Services | 2 | $25B |
|
||
| Transportation / Logistics | 2 | $18B |
|
||
| Healthcare | 1 | $247B |
|
||
| Telecommunications | 1 | $55B |
|
||
Price history
+341.0% since first listed4 events — show timeline
- 2026-05-29 Pending — GMLS
- 2026-05-21 Listed $1,495,000 GMLS
- 2026-05-15 Coming Soon $1,495,000 GMLS
- 1993-12-21 Sold (Public Records) $339,000 Public Records
Property tax history
+2.9%/yrLatest (2023): $7,496 · +0.9% YoY. Source: county tax records.
Cash-flow waterfall
monthlySold comps — $/sqft
last 12 mo · ≤1 miLoading sold comps…