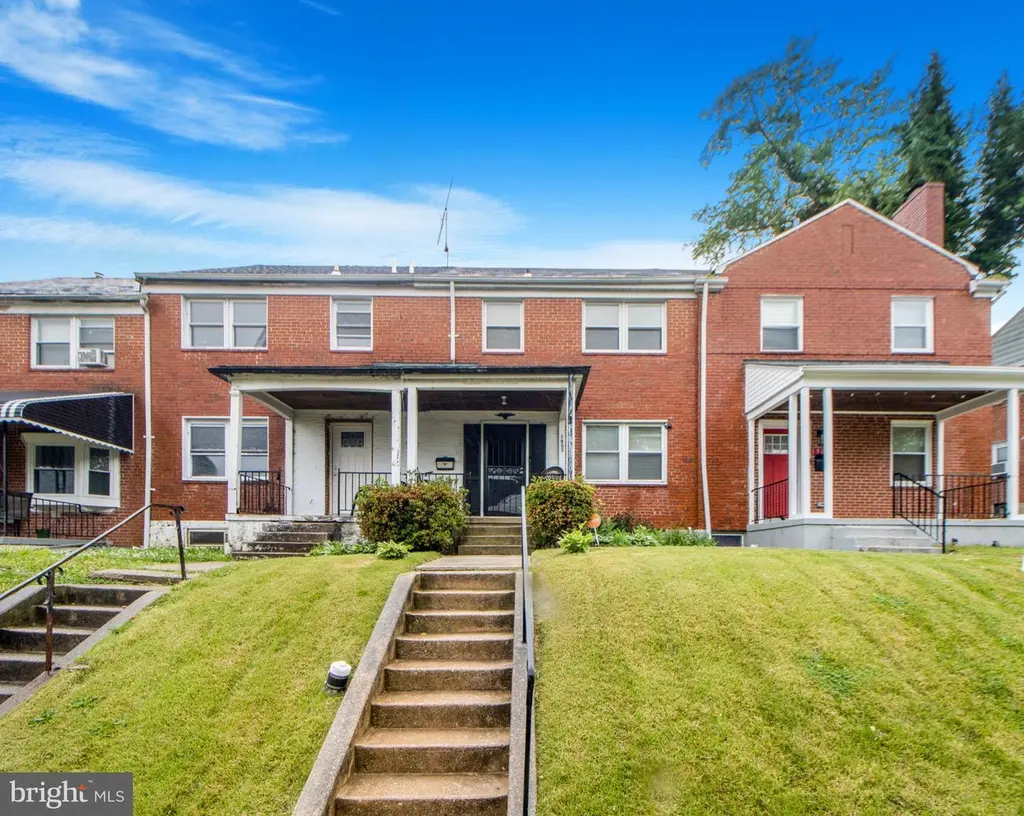
1903 Heathfield Rd · Baltimore, MD
Flood risk 1/10 · Minimal
- FEMA flood zone
- X (unshaded)
- Chance of flooding over 30 yrs
- 0.0%
- Est. flood insurance / yr
- $473 – $860
Fire risk 1/10 · Minimal
- Est. fire insurance / yr
- $755 – $1,403
Heat risk 7/10 · Major
- Hot days now (above 103°F)
- 7 days/yr
- Hot days in 30 yrs
- 15 days/yr
Wind risk 6/10 · Moderate
- Chance of severe wind over 30 yrs
- 27.0%
Air-quality risk 4/10 · Minor
- Unhealthy air days now
- 3 days/yr
- Unhealthy air days in 30 yrs
- 6 days/yr
Risk factors via First Street. Map © Google.
Why this score? — see what drove the D+ grade
The composite is a weighted blend of 9 inputs, each scored 0–100. Each bar is that input's sub-score; the figure is the points it added to the 100-point composite (weight × sub-score).
- Cash flow +15.0/30.0
- ARV discount +12.7/15.0
- DSCR +4.6/10.0
- 1% rule +3.9/10.0
- Livability +3.8/5.0
- Rent growth +3.2/5.0
- Condition / age +2.5/5.0
- Schools +1.0/10.0
- Appreciation +0.0/10.0
$215,000
🖨 Deal sheet 📄 Offer letter ✓ Due diligence
Listing remarks
Wonderful porch front townhome with gleaming wood floors on first and second level. Spacious living room. Formal dining room with chair rails, bay window, bar and pass-through to kitchen. Bright kitchen has recessed lighting, ceiling fans, ceramic tile floors, and soft close drawers. From Kitchen, access to porch, and yard and entry to lower level. 3 bedrooms on second level also have gleaming wood floors. Recently updated bath has "marble" surround, classy vanity. Plenty storage in closet and cabinet. Stairs to spacious 3rd level bonus space which can be storage but has great potential (see sales of homes renovated nearby) as 4th bedroom, 2nd family room, quiet study, art or musi
Key facts
- Bright kitchen
- Formal dining room
- Soft close drawers
Tags
Property features AI
Finance
- Other: Total below-grade finished area exists; Ground rent payment listed as an annual/periodic expense
- Financial info: Ownership interest: Ground rent
- HOA & community: Ground rent exists; paid semi-annually
Exterior
- Parking: On-street parking
- Utilities: Public water; Public sewer; Municipal trash service
- Home design: Interior townhouse/rowhouse; Estimated year built
- Construction: Brick construction; Asphalt roof; Concrete perimeter foundation
- Exterior features: Patio(s); Porch(es); Above grade and below grade finished areas; Daylight, partial basement with walkout stairs and rear entrance
Interior
- Kitchen: Oven/Range - Gas; Microwave; Range hood; Refrigerator
- Bedrooms: 3 bedrooms on main level
- Flooring: Hardwood floors; Wood floors
- Bathrooms: 1 full bathroom on main level; 1 half bathroom on main level
- Heating & cooling: Forced air heating (natural gas); Natural gas hot water; Attic fan; Ceiling fans; Window AC units
- Interior features: Attic; Tub with shower; Ceiling fans; Chair railings; Dining area; Formal dining room; Eat-in kitchen; Recessed lighting; Wood floors
- Laundry & utility: Washer in unit; Dryer; Laundry located in basement / lower level; Utility room
Neighborhood map
What this means for you Summary
Snapshot
- This is a 3-bed/1.0-bath townhouse listed at $215k.
Deal economics
- At list price, monthly cash flow is $65 ($781/yr) — positive.
- The deal already cash-flows at list — no discount required.
- To meet the 1% rule (rent ≥ 1% of price), the offer needs to be $192k (10.6% below list).
- Recommended offer: $192k (10.6% below list) — sets the bar for 1% rule.
Location & tenants
- Location reads 76/100 on livability (#90 in MD, #3,396 nationally) — a middle-class / working-renter tenant base. Strengths: amenities A+, commute A+, housing A+; Watch: schools D, crime F.
- Baltimore City Public Schools (urban): math 7% / reading 16% proficiency, ranked #24 of 24 in MD (top 100%) — low school quality limits family demand, transient renter base, plan for 1-2y turnover; 79% free/reduced lunch — lower-income household profile, screen leases tightly.
- Market conditions: Rents rising (+2.9%/yr); 71 active listings in the ZIP; 40 comparable units currently listed for rent nearby; rentals at typical pace (median 24d on market — plan ~3-4 weeks tenant-placement turnaround); 42% of comp listings sitting > 30 days — soft ceiling on asking rent; 1,273 units permitted in Baltimore city in 2024 (1,104 in 5+ unit buildings).
- This rent runs 37% of the median local income ($63k/yr) — at the standard rent-burdened threshold; future hikes will face affordability resistance.
Forward outlook
- Local home prices are declining (-3.0%/yr); year-one equity from $1k of loan paydown is wiped out by about $6k of value loss. Plan a longer hold.
- Baltimore County population projected to shrink 4% by 2050 — rents likely to lag national; underwrite the cash flow, not the appreciation.
Negotiation context
- It's been on market 26 days — a 2% lower offer ($212k) is reasonable based on typical stale-listing flexibility.
- Current owner paid $50k; list at $215k implies a 330% gain — meaningful room to come down on a strong offer.
Risks & watch-outs
- Watch-outs: built in 1953 — expect roof / HVAC / electrical / plumbing capex.
- Climate carrying-cost: major wind risk, 27% chance of damaging wind over 30y; extreme-heat days projected 7→15/yr by 2055 (HVAC capex compounding) — expect insurance premiums to compound above CPI over the hold.
Questions for the listing agent
- Built in 1953 — when were the roof, HVAC, electrical panel, plumbing, and water heater last replaced?
- Is there a deadline driving the sale (1031 exchange, divorce, estate, relocation)? That informs how much negotiation room exists.
- Schools are D-rated, which usually means shorter tenancies and higher turnover. Who's the typical renter profile here, and what's been the actual vacancy rate?
- Crime grade is F in this area — have there been break-ins, vandalism, or insurance claims at this property in the last 3 years? What carrier currently insures it and at what premium?
- The area grade is low — what's the realistic commute time and amenity access for the typical tenant pool here? Any planned neighborhood developments (good or bad) we should know about?
- What's the average days-on-market for RENTAL listings here right now (not sales)? A rising rental-DOM trend means longer vacancies and softer asking-rent achievability than the comps imply.
- What's the recent tenant-quality profile in this submarket — average credit score on applications, eviction rate, late-payment / NSF rate, and stable-employment percentage? A property-management company in the area should have these aggregated.
- How much new for-sale + rental construction is in the pipeline within 1–3 miles? Heavy new supply typically softens prices + rents 12–24 months out; constrained supply supports both.
Investment metrics
- 1% rule
- 0.89% ✗
- Cap rate
- 6.66%
- Cash-on-cash
- 1.30%
- DSCR
- 1.06
- GRM
- 9.3
CMA / ARV
- ARV (on-the-fly)
- $243,200
- Comps found
- 12
Show comp detail 12 sales within ~0.75 mi
| Address | Dist | Beds/Ba | Sqft | Sold | Price | $/sf | Match |
|---|---|---|---|---|---|---|---|
| 1809 Northbourne Rd | 0.17mi | 4/2.0 (+1) | 1,280 (0%) | 5mo | $256,000 | $200 | 79 |
| 1648 Ingram Rd | 0.09mi | 3/2.0 | 1,344 (+5%) | 8mo | $334,000 | $249 | 77 |
| 1653 Stonewood Rd | 0.26mi | 4/2.0 (+1) | 1,254 (-2%) | 1mo | $237,000 | $189 | 75 |
| 1607 Stonewood Rd | 0.32mi | 3/2.0 | 1,216 (-5%) | 1mo | $273,000 | $225 | 72 |
| 2403 Hermosa Ave | 0.46mi | 3/2.0 | 1,248 (-2%) | 0mo | $250,000 | $200 | 70 |
| 1554 Pentwood Rd | 0.40mi | 3/1.0 | 1,216 (-5%) | 8mo | $150,000 | $123 | 66 |
| 1645 Gleneagle Rd | 0.59mi | 3/1.5 | 1,330 (+4%) | 4mo | $170,000 | $128 | 61 |
| 1662 E Cold Spring Ln | 0.42mi | 4/2.0 (+1) | 1,364 (+7%) | 2mo | $275,000 | $202 | 59 |
| 1324 Crofton Rd | 0.70mi | 3/1.5 | 1,240 (-3%) | 4mo | $235,000 | $190 | 57 |
| 1910 Woodbourne Ave | 0.30mi | 3/1.5 | 1,472 (+15%) | 7mo | $215,000 | $146 | 53 |
| 1530 Burnwood Rd | 0.34mi | 3/3.0 | 1,428 (+12%) | 7mo | $270,000 | $189 | 51 |
| 1632 Northwick Rd | 0.61mi | 3/2.0 | 1,463 (+14%) | 4mo | $230,000 | $157 | 40 |
Match score weights: distance 35% · size 25% · config 20% · recency 20%. Top-matched comps best support the ARV.
Projected returns pro-forma
-3.0% appreciation · 2.86% rent growth · sell at horizon
- IRR
- -14.4%
- Equity multiple
- 0.49×
- Total profit
- $-30,958
- Equity at exit
- $32,057
- IRR
- -5.9%
- Equity multiple
- 0.62×
- Total profit
- $-22,692
- Equity at exit
- $18,589
Cash invested: $60,200 (down + closing). Projections, not guarantees.
Landlord ↔ Tenant lean methodology
- Overall (CITY)
- 12 Strongly Tenant-Friendly
- State Maryland
- 27 Tenant-Leaning · D+14
- County
- — inherits STATE
- City Baltimore
- 12 Strongly Tenant-Friendly · D+58
ZIP-level market 21239
- Rents YoY
- 2.9%
- Active inventory
- 71
- Price-to-rent
- 9.3×
Monthly cashflow live
- Estimated rent
- $1,922 high interval (Pro) →
- Mortgage (P&I)
- −$1,127
- Tax from tax record
- −$236 /mo · $2,833/yr
- Insurance
- −$90
- HOA
- −$0
- Vacancy / Maint / Mgmt
- −$404
- Net cashflow
- $65
Break-even live
UW: 25.0% down · 7.5% · 30yr · 1.5% tax · 5.0% vac · 8.0% maint · 8.0% mgmt
Financing live
Cash to close
- Down payment
- $53,750
- Closing costs
- $6,450
- Reserves months
- —
- Total cash needed
- —
Loan-product check · same deal, 3 products live
Conventional
25% down · 7.5% · 30yr
- Down + closing
- —
- Monthly P&I
- —
- Monthly cashflow
- —
- DSCR
- —
- Eligible?
- —
Personal DTI + credit; lowest rate.
DSCR
20% down · 8.5% · 30yr
- Down + closing
- —
- Monthly P&I
- —
- Monthly cashflow
- —
- DSCR
- —
- Eligible?
- —
No personal income docs; deal must DSCR.
Hard money
10% down · 12.0% · 12mo
- Down + closing
- —
- Monthly P&I
- —
- Monthly cashflow
- —
- DSCR
- —
- Eligible?
- —
Short-term bridge; refi at stabilization.
Rent comps 40 comps
| Address | Beds | Baths | Sqft | Rent | $/sqft | DOM | Units | Dist |
|---|---|---|---|---|---|---|---|---|
| 1804 Winford Rd Baltimore, MD | 3.0 | 1.5 | 1600 | $2,100 | $1.31 | 24d | 1 | 0.12mi |
| 2028 Hillenwood Rd Baltimore, MD | 4.0 | 2.0 | 1820 | $2,100 | $1.15 | 22d | 1 | 0.28mi |
| 2077 Woodbourne Ave Baltimore, MD | 1.0–2.0 | 1.0 | 830 | $1,419 | $1.71 | 1d | 5 | 0.37mi |
| 1908 E Belvedere Ave Baltimore, MD | 4.0 | 2.0 | 1425 | $1,950 | $1.37 | 20d | 1 | 0.44mi |
| 1726 E Belvedere Ave Baltimore, MD | 3.0 | 2.0 | 1140 | $1,895 | $1.66 | 22d | 1 | 0.46mi |
| 1545 E Cold Spring Ln Baltimore, MD | 4.0 | 2.0 | 1240 | $2,000 | $1.61 | 43d | 1 | 0.51mi |
| 1900 Ramblewood Rd Apt A Baltimore, MD | 2.0 | 2.0 | 903 | $1,847 | $2.05 | 43d | 1 | 0.56mi |
| 5204 Kelway Rd Baltimore, MD | 3.0 | 2.0 | 1666 | $2,350 | $1.41 | 24d | 1 | 0.60mi |
| 5781 Edgepark Rd Baltimore, MD | 3.0 | 2.0 | 1568 | $1,975 | $1.26 | 16d | 1 | 0.63mi |
| 5520 Sagra Rd Baltimore, MD | 3.0 | 1.5 | 1650 | $1,900 | $1.15 | 43d | 1 | 0.64mi |
| 1806 Ramblewood Rd Apt A Baltimore, MD | 2.0 | 2.0 | 903 | $1,847 | $2.05 | 43d | 1 | 0.65mi |
| 1275 Kitmore Rd Unit 1262B-A Baltimore, MD | 2.0 | 1.0 | 923 | $1,320 | $1.43 | 2d | 1 | 0.75mi |
| 1275 Kitmore Rd Unit 1245K-T Baltimore, MD | 3.0 | 1.0 | 935 | $1,895 | $2.03 | 4d | 1 | 0.75mi |
| 1646 Wadsworth Way Baltimore, MD | 3.0 | 1.0 | 1520 | $2,100 | $1.38 | 11d | 1 | 0.77mi |
| 1221 Glenwood Ave Baltimore, MD | 3.0 | 2.0 | 1390 | $2,595 | $1.87 | 43d | 1 | 0.78mi |
| 2807 Shirey Ave Baltimore, MD | 4.0 | 3.0 | 1190 | $2,500 | $2.10 | 14d | 1 | 0.80mi |
| 1224 Winston Ave Baltimore, MD | 3.0 | 2.0 | 1248 | $2,100 | $1.68 | 17d | 1 | 0.80mi |
| 1260 Rossiter Ave Baltimore, MD | 2.0 | 1.0 | 710 | $1,250 | $1.76 | 1d | 37 | 0.81mi |
| 1508 Gleneagle Rd Baltimore, MD | 3.0 | 2.0 | 1824 | $2,180 | $1.20 | 4d | 1 | 0.81mi |
| 2911 Shirey Ave Baltimore, MD | 4.0 | 2.0 | 1680 | $2,500 | $1.49 | 20d | 1 | 0.85mi |
| 1617 Argonne Dr Baltimore, MD | 4.0 | 2.0 | 1200 | $2,550 | $2.12 | 43d | 1 | 0.86mi |
| 2900 Ailsa Ave Apt 2 Baltimore, MD | 3.0 | 1.0 | 1300 | $1,750 | $1.35 | 4d | 1 | 0.88mi |
| 1539 Ralworth Rd Baltimore, MD | 3.0 | 2.0 | 1580 | $1,950 | $1.23 | 14d | 1 | 0.94mi |
| 2106 Cloville Ave Baltimore, MD | 3.0 | 1.5 | 1080 | $1,700 | $1.57 | 43d | 1 | 0.96mi |
| 1006 Cameron Rd Baltimore, MD | 2.0 | 1.0 | 1032 | $950 | $0.92 | 43d | 1 | 0.98mi |
| 1008 Tunbridge Rd Baltimore, MD | 3.0 | 2.0 | 1732 | $2,050 | $1.18 | 24d | 1 | 0.99mi |
| 2805 Hamilton Ave Baltimore, MD | 4.0 | 2.0 | 1416 | $2,300 | $1.62 | 43d | 1 | 1.05mi |
| 5622 Midwood Ave Baltimore, MD | 3.0 | 2.0 | 1452 | $2,300 | $1.58 | 43d | 1 | 1.07mi |
| 5626 Midwood Ave Unit 2 Baltimore, MD | 2.0 | 1.0 | 1452 | $1,100 | $0.76 | 24d | 1 | 1.08mi |
| 1111 Gleneagle Rd Unit 2 Baltimore, MD | 2.0 | 1.0 | 1452 | $1,050 | $0.72 | 43d | 1 | 1.11mi |
| 1116 Gleneagle Rd Unit 2 Baltimore, MD | 2.0 | 1.0 | 876 | $1,750 | $2.00 | 43d | 1 | 1.13mi |
| 1106 Gleneagle Rd Unit 2 Baltimore, MD | 2.0 | 1.0 | 1100 | $1,450 | $1.32 | 43d | 1 | 1.14mi |
| 3309 Southern Ave Unit 2 Baltimore, MD | 2.0 | 1.0 | 1200 | $1,600 | $1.33 | 12d | 1 | 1.17mi |
| 804 Radnor Ave Baltimore, MD | 3.0 | 1.0 | 1654 | $2,000 | $1.21 | 43d | 1 | 1.18mi |
| 835 E Cold Spring Ln Baltimore, MD | 2.0 | 1.5 | 997 | $1,400 | $1.40 | 24d | 1 | 1.19mi |
| 6212 Laurelton Ave Baltimore, MD | 2.0 | 1.0 | 960 | $1,325 | $1.38 | 43d | 1 | 1.19mi |
| 1444 Meridene Dr Baltimore, MD | 3.0 | 1.5 | 1520 | $1,950 | $1.28 | 43d | 1 | 1.19mi |
| 828 Saint Dunstans Rd Baltimore, MD | 3.0 | 2.0 | 1544 | $2,000 | $1.30 | 24d | 1 | 1.21mi |
| 6101 Loch Raven Blvd Baltimore, MD | 1.0–2.0 | 1.0–2.0 | 1138 | $2,318 | $2.04 | 2d | 8 | 1.25mi |
| 812 Nat Ct Apt 12 Baltimore, MD | 2.0 | 1.0 | 900 | $1,295 | $1.44 | 43d | 1 | 1.25mi |
Listing history 15 events
-
2026-06-18days on market $215,000 Active 26 DOM
-
2026-06-17days on market $215,000 Active 25 DOM
-
2026-06-16days on market $215,000 Active 24 DOM
-
2026-06-15days on market $215,000 Active 23 DOM
-
2026-06-13days on market $215,000 Active 21 DOM
-
2026-06-09days on market $215,000 Active 17 DOM
-
2026-06-08days on market $215,000 Active 16 DOM
-
2026-06-07days on market $215,000 Active 15 DOM
-
2026-06-04days on market $215,000 Active 12 DOM
-
2026-06-03days on market $215,000 Active 11 DOM
-
2026-06-02days on market $215,000 Active 10 DOM
-
2026-06-01days on market $215,000 Active 9 DOM
-
2026-05-31days on market $215,000 Active 8 DOM
-
2026-05-23$215,000 Active
-
1987-04-15soldstatus $50,000
ⓘ Source: listings_history table (triggers on properties + properties_extension) + one-shot
backfill from property_details.listing_events for pre-trigger history.
Tax reassessment forecast MD · Partial reset (capped growth)
- Current annual tax
- $2,833 · $236/mo
- Projected year-2 tax
- $2,833 · $236/mo
- Expected delta
- $0/yr ($0/mo · 0.0%)
ⓘ Screening estimate from a state-policy table — verify with the county assessor before closing.
Climate risk First Street
- Flood 1/10 Low FEMA zone X (unshaded) · 0% chance over 30 yrs
- Wildfire 1/10 Low
- Heat 7/10 Severe 7 d/yr ≥103°F today · 15 d/yr by 30 yrs out
- Wind 6/10 Major 27% chance of damaging wind over 30 yrs
- Air quality 4/10 Moderate 3 unhealthy d/yr today · 6 by 30 yrs out
Nearby sold comps map
Loading sold comps map…
Walkable amenities ~0.75 mi
Loading nearby amenities…
Taxation est. · year 1
- Rental income
- $23,062
- − Mortgage interest
- −$12,043
- − Property taxes
- −$2,833
- − Insurance
- −$1,075
- − Repairs & maintenance
- −$1,845
- − Management
- −$1,845
- − Depreciation
- −$6,255
- Taxable loss
- −$2,834
- Est. tax savings @ 24.0%
- +$680
- After-tax cash flow
- $1,461/yr
For passive investors: Depreciation is non-cash, so a rental often shows a tax loss while cash-flowing — sheltering income. Rental losses are passive: they offset passive income freely, and up to $25,000/yr can offset ordinary (W-2) income if you actively participate and your MAGI is under $100k (phasing out to $0 by $150k); unused losses carry forward. On sale, claimed depreciation is recaptured at up to 25%, and gains may owe capital-gains tax (a 1031 exchange can defer both). Figures are a year-1 estimate at your 24.0% rate — not tax advice; consult a CPA.
Schools (NCES district)
- District
- Baltimore City Public Schools
- NCES district ID
- 2400090
- Math proficiency
- 7% ▼ -9.00%
- Reading proficiency
- 16% ▼ -5.00%
- Median HH income
- $42,108
- Composite
- 10.08/100
- National rank
- #9805
- State rank
- #24 of 24 in MD
Livability — Baltimore
- Score
- 76/100
- State rank
- #90
- US rank
- #3396
Category grades
Schools grade is shown separately in the Schools card above.
Census & demographics
- Census place
- Baltimore, MD
- County
- Baltimore City · 558,601 people
- City population
- 588,727
- Metro
- Baltimore-Columbia-Towson, MD
- Population (ZIP)
- 27,346
- Household income
- $62,650
- Rent vs Own
- Severe rent burden
- 1103.0
Population outlook (Baltimore County) Hauer SSP2
- Today (2025)
- 624,249 people
- By 2030
- 621,541 · -0.4%
- By 2040
- 609,756 · -2.3%
- By 2050
- 597,249 · -4.3%
- By 2075
- 552,236 · -11.5%
- By 2100
- 513,934 · -17.7%
Race, ethnicity, and origin ACS 2023
- Neighborhood character
- Predominantly Black (76%)
- Race & ethnicity
- Black 76% White 12% Asian 4% Hispanic / Latino 4% Two or more races 4%
- Common ancestry
- Lithuanian 1% Romanian 1% Russian 1%
- Foreign-born
- 10% · Canada, United Kingdom, China
- Languages at home
- 88% English-only · Other Indo-European 3% Spanish 2% French/Haitian/Cajun 2%
Political lean MEDSL · Baltimore
- 2024 margin
- Solid D (+73.0) · D 85.2% · R 12.2% · Other 2.6%
- 2008→2024 swing
- -2.5pp toward R · 2008: 75.5pp · 2024: 73.0pp
- All cycles
- 2024: D+73.0 2020: D+76.6 2016: D+74.6 2012: D+76.4 2008: D+75.5
Not yet ingested
- Civics
- —
Market trends
- HPI YoY
- ▼ -164.48%
- Current HPI
- 258.094
- Rent YoY
- ▲ 2.86%
- Metro
- Baltimore-Columbia-Towson, MD
- State GDP YoY
- ▲ 2.97%
- F500 in state
- 12
Industry mix (Fortune 500 HQ in MD)
| Industry | F500 HQs | Revenue |
|---|---|---|
| Aerospace / Defense | 1 | $71B |
|
||
| Utilities | 1 | $25B |
|
||
| Hotels | 1 | $24B |
|
||
| Consumer Goods | 1 | $7B |
|
||
| Real Estate | 1 | $6B |
|
||
| Chemicals | 1 | $2B |
|
||
Price history
+330.0% since first listed2 events — show timeline
- 2026-05-23 Listed $215,000 BRIGHT MLS
- 1987-04-15 Sold (Public Records) $50,000 Public Records
Property tax history
-0.6%/yrLatest (2025): $2,833 · +1.9% YoY. Source: county tax records.
Cash-flow waterfall
monthlySold comps — $/sqft
last 12 mo · ≤1 miLoading sold comps…