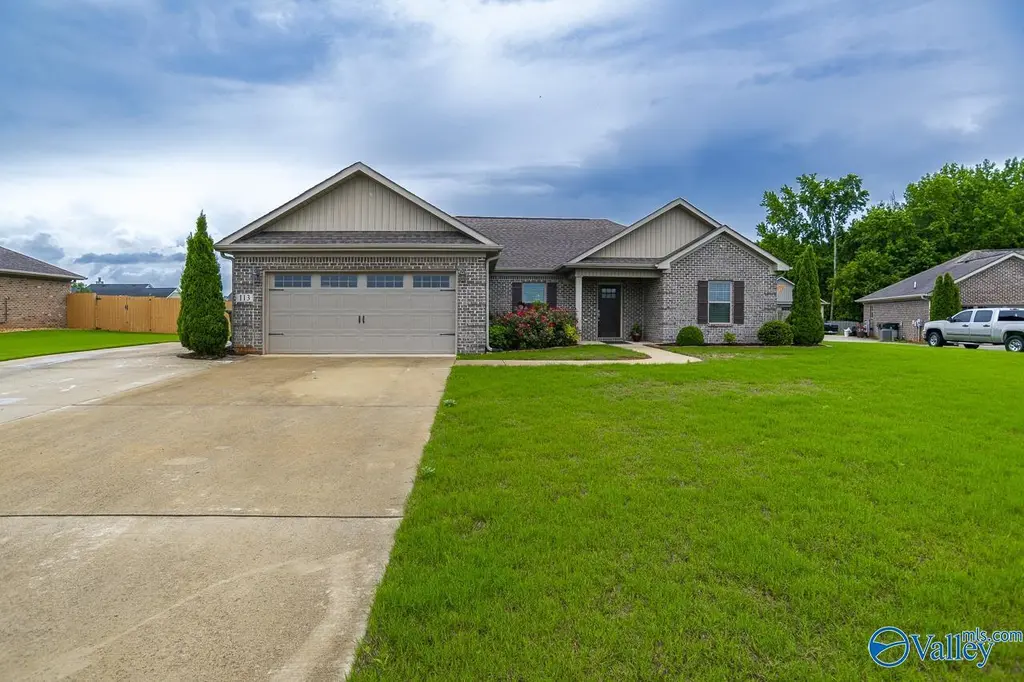
113 Stillwood Dr · Hazel Green, AL
Flood risk 1/10 · Minimal
- FEMA flood zone
- X (unshaded)
- Chance of flooding over 30 yrs
- 0.0%
- Est. flood insurance / yr
- $507 – $1,088
Fire risk 3/10 · Minor
- Est. fire insurance / yr
- $916 – $1,700
Heat risk 5/10 · Moderate
- Hot days now (above 104°F)
- 7 days/yr
- Hot days in 30 yrs
- 19 days/yr
Wind risk 4/10 · Minor
- Chance of severe wind over 30 yrs
- 15.0%
Air-quality risk 2/10 · Minimal
- Unhealthy air days now
- 2 days/yr
- Unhealthy air days in 30 yrs
- 2 days/yr
Risk factors via First Street. Map © Google.
Why this score? — see what drove the F grade
The composite is a weighted blend of 9 inputs, each scored 0–100. Each bar is that input's sub-score; the figure is the points it added to the 100-point composite (weight × sub-score).
- Appreciation +10.0/10.0
- Cash flow +7.0/30.0
- ARV discount +3.7/15.0
- Schools +3.7/10.0
- Livability +3.5/5.0
- Rent growth +2.5/5.0
- Condition / age +2.5/5.0
- DSCR +1.2/10.0
- 1% rule +0.5/10.0
$309,000
🖨 Deal sheet (PDF) 📄 Offer letter ✓ Due diligence
Listing remarks MLS
Under Construction-UNDER CONSTRUCTION TARGET COMPLETION DATE IS 11/30/19. BEAUTIFUL FULL BRICK CUSTOM BUILT HOME! TONS OF AMENITIES , OPEN FLOOR PLAN, LARGE KITCHEN, LVP FLOORING IN MAIN AREAS AND WET AREAS, EXTENSIVE TRIM WORK, COVERED FRONT AND REAR PORCHES, TILE BACKSPLASH, RECESSED LIGHTING, LARGE WIDE LOT, AND MUCH MORE! SEVERAL LOTS AND PLANS AVAILABLE FOR PRESALE! SELLER IS A LICENSED REALTOR.
Key facts
- Walk-in closet
- Spacious bathroom
- Covered back porch
Tags
Property features AI
Finance
- HOA & community: No homeowners association; Subdivision: Coldwater Creek; Community features include curbs
Exterior
- Parking: Attached two-car garage with garage door opener, garage faces front
- Utilities: Public water; Septic sewer
- Home design: Single-family residence; Residential property; Built in 2019; One-story (entry level information not specified)
- Construction: Brick, vinyl siding, and aluminum siding exterior; Slab foundation
- Exterior features: Covered patio; Front porch; Patio; Curbs and gutters; Sidewalk; Underground utilities; Public water source; Septic tank
Interior
- Bathrooms: 2 full bathrooms
- Heating & cooling: Central heating (electric); Central air conditioning
- Interior features: Gas-log fireplace (one)
Neighborhood map
What this means for you Summary
Snapshot
- This is a 3-bed/1.0-bath single-family listed at $309k.
Deal economics
- At list price, monthly cash flow is $-455 ($-5k/yr) — negative.
- To cash-flow at today's rent, offer at most $229k (26.0% below list).
- To meet the 1% rule (rent ≥ 1% of price), the offer needs to be $171k (44.7% below list).
- Recommended offer: $171k (44.7% below list) — sets the bar for 1% rule.
Location & tenants
- Location reads 69/100 on livability (#54 in AL) — a middle-class / working-renter tenant base. Strengths: cost of living A+, housing A+, crime A; Watch: amenities F, commute F, employment F.
- Madison County (rural): math 27% / reading 56% proficiency, ranked #19 of 129 in AL (top 15%) — families likely to look elsewhere, expect single-tenant / working-renter base with shorter leases.
- Zoned schools: Hazel Green Elementary School (math 23% / reading 58%, grade F, #238 of 627 statewide, top 38%, 738 students, 50% FRL); Meridianville Middle School (math 19% / reading 62%, grade F, #56 of 257 statewide, top 22%, 724 students, 45% FRL); Hazel Green High School (math 23% / reading 31%, grade F, #90 of 305 statewide, top 35%, 1,348 students, 42% FRL) — zoned schools average 46% FRL vs 29% district-wide (16 pts higher); higher-poverty schools than district average — tighter screening recommended.
- Market conditions: 256 active listings in the ZIP; 3 comparable units currently listed for rent nearby; rentals at typical pace (median 15d on market — plan ~3-4 weeks tenant-placement turnaround); 4,709 units permitted in Madison County in 2024 (1,186 in 5+ unit buildings).
Forward outlook
- In year one you build about $33k of equity ($2k loan paydown + $31k appreciation (10.0% local appreciation)).
- Madison County population projected at +18% by 2050 — long-run rental-demand tailwind backs the buy-and-hold thesis.
- By year 2, paydown + projected appreciation supports a ~$53k cash-out refi (75% LTV) — recoverable capital for the next deal without selling this one.
Negotiation context
- Only 8 days on market — expect competitive offers; lowballing is unlikely to land.
- 2 sale attempts since 7y ago with the ask held roughly flat each time — persistent listings suggest the price (not the market) is what's stuck; bring a comps-based counter.
- Current owner paid $179k; list at $309k implies a 73% gain — meaningful room to come down on a strong offer.
Risks & watch-outs
- Climate carrying-cost: extreme-heat days projected 7→19/yr by 2055 (HVAC capex compounding) — expect insurance premiums to compound above CPI over the hold.
Questions for the listing agent
- What do current leases actually rent for vs. the listed asking? Can we see a recent rent roll and the last 12 months of T-12 income?
- Is there a deadline driving the sale (1031 exchange, divorce, estate, relocation)? That informs how much negotiation room exists.
- The area grade is low — what's the realistic commute time and amenity access for the typical tenant pool here? Any planned neighborhood developments (good or bad) we should know about?
- What's the average days-on-market for RENTAL listings here right now (not sales)? A rising rental-DOM trend means longer vacancies and softer asking-rent achievability than the comps imply.
- What's the recent tenant-quality profile in this submarket — average credit score on applications, eviction rate, late-payment / NSF rate, and stable-employment percentage? A property-management company in the area should have these aggregated.
- How much new for-sale + rental construction is in the pipeline within 1–3 miles? Heavy new supply typically softens prices + rents 12–24 months out; constrained supply supports both.
Investment metrics
- 1% rule
- 0.55% ✗
- Cap rate
- 4.52%
- Cash-on-cash
- -6.32%
- DSCR
- 0.72
- GRM
- 15.1
CMA / ARV
- ARV (on-the-fly)
- $284,886
- Comps found
- 4
Show comp detail 4 sales within ~0.75 mi
| Address | Dist | Beds/Ba | Sqft | Sold | Price | $/sf | Match |
|---|---|---|---|---|---|---|---|
| 110 Chapel Creek Dr | 0.05mi | 3/2.0 | 1,603 (-4%) | 20mo | $265,000 | $165 | 70 |
| 754 Elkwood Section Rd | 0.20mi | 3/2.0 | 1,508 (-10%) | 13mo | $258,000 | $171 | 60 |
| 117 Cool Creek Rd | 0.17mi | 3/2.0 | 1,464 (-12%) | 21mo | $245,000 | $167 | 50 |
| 536 Hills Chapel Rd | 0.23mi | 3/2.0 | 1,455 (-13%) | 21mo | $265,000 | $182 | 46 |
Match score weights: distance 35% · size 25% · config 20% · recency 20%. Top-matched comps best support the ARV.
Projected returns pro-forma
10.0% appreciation · 3.0% rent growth · sell at horizon
- IRR
- 19.8%
- Equity multiple
- 2.61×
- Total profit
- $139,113
- Equity at exit
- $278,372
- IRR
- 18.1%
- Equity multiple
- 5.99×
- Total profit
- $432,117
- Equity at exit
- $600,319
Cash invested: $86,520 (down + closing). Projections, not guarantees.
Landlord ↔ Tenant lean methodology
- Overall (STATE)
- 90 Strongly Landlord-Friendly
- State Alabama
- 90 Strongly Landlord-Friendly · R+15
- County
- — inherits STATE
- City
- — inherits STATE
ZIP-level market 35750
- Home prices YoY
- 8.2%
- Active inventory
- 256
- Price-to-rent
- 15.1×
Monthly cashflow live
- Estimated rent
- $1,709 medium interval (Pro) →
- Mortgage (P&I)
- −$1,620
- Tax from tax record
- −$56 /mo · $677/yr
- Insurance
- −$129
- HOA
- −$0
- Vacancy / Maint / Mgmt
- −$359
- Net cashflow
- $-455
Break-even live
Sensitivity live
| Price | -10% $-280 | -5% $-368 | +0% $-455 | +5% $-543 | +10% $-999 |
|---|---|---|---|---|---|
| Rent | -10% $-590 | -5% $-523 | +0% $-455 | +5% $-388 | +10% $-320 |
| Rate | -1.0pp $-300 | -0.5pp $-377 | base $-455 | +0.5pp $-535 | +1.0pp $-617 |
UW: 25.0% down · 7.5% · 30yr · 1.5% tax · 5.0% vac · 8.0% maint · 8.0% mgmt
Financing live
Cash to close
- Down payment
- $77,250
- Closing costs
- $9,270
- Reserves months
- —
- Total cash needed
- —
Loan-product check · same deal, 3 products live
Conventional
25% down · 7.5% · 30yr
- Down + closing
- —
- Monthly P&I
- —
- Monthly cashflow
- —
- DSCR
- —
- Eligible?
- —
Personal DTI + credit; lowest rate.
DSCR
20% down · 8.5% · 30yr
- Down + closing
- —
- Monthly P&I
- —
- Monthly cashflow
- —
- DSCR
- —
- Eligible?
- —
No personal income docs; deal must DSCR.
Hard money
10% down · 12.0% · 12mo
- Down + closing
- —
- Monthly P&I
- —
- Monthly cashflow
- —
- DSCR
- —
- Eligible?
- —
Short-term bridge; refi at stabilization.
Rent comps 3 comps
| Address | Beds | Baths | Sqft | Rent | $/sqft | DOM | Units | Dist |
|---|---|---|---|---|---|---|---|---|
| 120 Grip Dr Hazel Green, AL | 4.0 | 2.0 | 1732 | $1,823 | $1.05 | 22d | 1 | 1.21mi |
| 149 Hazel Trce Hazel Green, AL | 3.0 | 2.0 | 1628 | $1,695 | $1.04 | 15d | 1 | 1.23mi |
| 100 Brook Glen Dr Hazel Green, AL | 3.0 | 2.0 | 1336 | $1,595 | $1.19 | 15d | 1 | 1.41mi |
Listing history 7 events
-
2026-06-14status $309,000 Pending 8 DOM
-
2026-06-10days on market $309,000 Active 8 DOM
-
2026-06-09days on market $309,000 Active 7 DOM
-
2026-06-08days on market $309,000 Active 6 DOM
-
2026-06-07days on market $309,000 Active 5 DOM
-
2026-06-03remarks 622-char remark
-
2026-06-03$309,000 Active 1 DOM
ⓘ Source: listings_history table (triggers on properties + properties_extension) + one-shot
backfill from property_details.listing_events for pre-trigger history.
Tax reassessment forecast AL · Resets to sale price
- Current annual tax
- $677 · $56/mo
- Projected year-2 tax
- $1,267 · $106/mo
- Expected delta
- +$590/yr (+$49/mo · 87.1%)
ⓘ Screening estimate from a state-policy table — verify with the county assessor before closing.
Climate risk First Street
- Flood 1/10 Low FEMA zone X (unshaded) · 0% chance over 30 yrs
- Wildfire 3/10 Moderate
- Heat 5/10 Major 7 d/yr ≥104°F today · 19 d/yr by 30 yrs out
- Wind 4/10 Moderate 15% chance of damaging wind over 30 yrs
- Air quality 2/10 Low 2 unhealthy d/yr today · 2 by 30 yrs out
Nearby sold comps map
Loading sold comps map…
Walkable amenities ~0.75 mi
Loading nearby amenities…
Taxation est. · year 1
- Rental income
- $20,510
- − Mortgage interest
- −$17,309
- − Property taxes
- −$677
- − Insurance
- −$1,545
- − Repairs & maintenance
- −$1,641
- − Management
- −$1,641
- − Depreciation
- −$8,989
- Taxable loss
- −$11,291
- Est. tax savings @ 24.0%
- +$2,710
- After-tax cash flow
- $-2,754/yr
For passive investors: Depreciation is non-cash, so a rental often shows a tax loss while cash-flowing — sheltering income. Rental losses are passive: they offset passive income freely, and up to $25,000/yr can offset ordinary (W-2) income if you actively participate and your MAGI is under $100k (phasing out to $0 by $150k); unused losses carry forward. On sale, claimed depreciation is recaptured at up to 25%, and gains may owe capital-gains tax (a 1031 exchange can defer both). Figures are a year-1 estimate at your 24.0% rate — not tax advice; consult a CPA.
Schools (NCES district)
- District
- Madison County
- NCES district ID
- 0102220
- Math proficiency
- 27% ▼ -32.00%
- Reading proficiency
- 56% ▼ -1.00%
- Median HH income
- $66,058
- Composite
- 37.15/100
- National rank
- #4483
- State rank
- #19 of 129 in AL
Livability — Hazel Green
- Score
- 69/100
- State rank
- #54
- US rank
- #8575
Category grades
Schools grade is shown separately in the Schools card above.
Census & demographics
- County
- Madison County · 380,832 people
- City population
- 13,413
- Metro
- Huntsville, AL
- Population (ZIP)
- 13,413
- Household income
- $68,389
- Rent vs Own
- Severe rent burden
- 162.0
Population outlook (Madison County) Hauer SSP2
- Today (2025)
- 392,086 people
- By 2030
- 409,788 · +4.5%
- By 2040
- 440,557 · +12.4%
- By 2050
- 460,990 · +17.6%
- By 2075
- 502,872 · +28.3%
- By 2100
- 513,623 · +31.0%
Race, ethnicity, and origin ACS 2023
- Neighborhood character
- Predominantly White (71%)
- Race & ethnicity
- White 71% Black 19% Asian 5% Two or more races 3% Hispanic / Latino 2%
- Common ancestry
- Slovak 1% Serbian 1% Romanian 1%
- Foreign-born
- 3% · Canada
- Languages at home
- 95% English-only · Spanish 2% Chinese 1% Korean 1%
Political lean MEDSL · Madison
- 2024 margin
- Lean R (+9.0) · D 44.7% · R 53.7% · Other 1.6%
- 2008→2024 swing
- +6.0pp toward D · 2008: -14.9pp · 2024: -9.0pp
- All cycles
- 2024: R+9.0 2020: R+8.0 2016: R+16.8 2012: R+18.7 2008: R+14.9
Not yet ingested
- Civics
- —
Market trends
- HPI YoY
- ▲ 33.59%
- Current HPI
- 444.7418
- Rent YoY
- —
- Metro
- Huntsville, AL
- State GDP YoY
- ▲ 2.94%
- F500 in state
- 4
Industry mix (Fortune 500 HQ in AL)
| Industry | F500 HQs | Revenue |
|---|---|---|
| Financial Services | 1 | $8B |
|
||
| Healthcare | 1 | $5B |
|
||
Price history
+69.9% since first listed4 events — show timeline
- 2026-06-02 Listed $309,000 VMLS
- 2019-12-30 Sold (MLS) $178,900 VMLS
- 2019-10-09 Contingent — VMLS
- 2019-08-08 Listed $181,900 VMLS
Property tax history
+46.4%/yrLatest (2024): $677 · +0.0% YoY. Source: county tax records.
Cash-flow waterfall
monthlySold comps — $/sqft
last 12 mo · ≤1 miLoading sold comps…