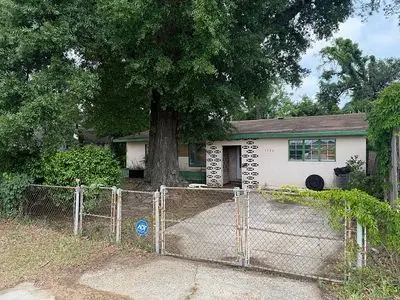
3304 N Roosevelt St · Goulding, FL
Flood risk 1/10 · Minimal
- FEMA flood zone
- X (unshaded)
- Chance of flooding over 30 yrs
- 0.0%
- Est. flood insurance / yr
- $507 – $1,088
Fire risk 1/10 · Minimal
- Est. fire insurance / yr
- $947 – $1,759
Heat risk 10/10 · Severe
- Hot days now (above 105°F)
- 7 days/yr
- Hot days in 30 yrs
- 22 days/yr
Wind risk 9/10 · Severe
- Chance of severe wind over 30 yrs
- 99.0%
Air-quality risk 2/10 · Minimal
- Unhealthy air days now
- 0 days/yr
- Unhealthy air days in 30 yrs
- 1 days/yr
Risk factors via First Street. Map © Google.
Why this score? — see what drove the B grade
The composite is a weighted blend of 9 inputs, each scored 0–100. Each bar is that input's sub-score; the figure is the points it added to the 100-point composite (weight × sub-score).
- Cash flow +30.0/30.0
- 1% rule +10.0/10.0
- DSCR +10.0/10.0
- ARV discount +7.5/15.0
- Livability +3.7/5.0
- Schools +3.6/10.0
- Rent growth +3.3/5.0
- Condition / age +2.5/5.0
- Appreciation +0.0/10.0
$76,000
🖨 Deal sheet 📄 Offer letter ✓ Due diligence
Listing remarks
Distressed 3bd 2ba 1504sqft property. Concrete block home. 1956 build. Large yard. .28 acres. Zoned MDR(Medium Density Residential) NO HOA. HVAC 2018. Roof and water heater need replacing.
Key facts
- Hvac 2018
- Large yard
- Zoned mdr
Tags
Property features AI
Exterior
- Home design: Built in 1956
- Construction: Single-family residence (built 1956)
- Exterior features: Located in the North Pensacola subdivision
Neighborhood map
What this means for you Summary
Snapshot
- This is a 3-bed/1.0-bath single-family listed at $76k.
Deal economics
- At list price, monthly cash flow is $1k ($16k/yr) — positive.
- The deal already cash-flows at list — no discount required.
- Meets the 1% rule at list price ($2k rent vs $76k).
- Recommended offer: $75k (1.5% below list) — sets the bar for market timing.
Location & tenants
- Location reads 73/100 on livability (#296 in FL) — a middle-class / working-renter tenant base. Strengths: cost of living A+, health & safety A+, housing A; Watch: amenities F, commute F, employment F.
- Escambia (suburban): math 40% / reading 45% proficiency, ranked #56 of 73 in FL (top 77%) — families likely to look elsewhere, expect single-tenant / working-renter base with shorter leases.
- Market conditions: Rents rising (+3.4%/yr); 240 active listings in the ZIP; 10 comparable units currently listed for rent nearby; rentals at typical pace (median 23d on market — plan ~3-4 weeks tenant-placement turnaround); 1,479 units permitted in Escambia County in 2024 (0 in 5+ unit buildings).
- This rent runs 40% of the median local income ($71k/yr) — at the standard rent-burdened threshold; future hikes will face affordability resistance.
Forward outlook
- Local home prices are declining (-3.0%/yr); year-one equity from $525 of loan paydown is wiped out by about $2k of value loss. Plan a longer hold.
- Escambia County population projected at +13% by 2050 — modest demand growth; plan on rents tracking national, not racing it.
- At projected returns (-3.0% appreciation + 3.4% rent growth), your $21k cash investment doubles in ~2 years — after that, you're playing with house money.
Negotiation context
- It's been on market 23 days — a 2% lower offer ($75k) is reasonable based on typical stale-listing flexibility.
Risks & watch-outs
- Watch-outs: built in 1956 — expect roof / HVAC / electrical / plumbing capex.
- Climate carrying-cost: severe wind risk, 99% chance of damaging wind over 30y; extreme-heat days projected 7→22/yr by 2055 (HVAC capex compounding) — expect insurance premiums to compound above CPI over the hold.
Questions for the listing agent
- Built in 1956 — when were the roof, HVAC, electrical panel, plumbing, and water heater last replaced?
- Is there a deadline driving the sale (1031 exchange, divorce, estate, relocation)? That informs how much negotiation room exists.
- Schools are A-rated — typically a magnet for longer-tenancy family renters. What's the average tenant stay here, and is there a school-zone premium baked into asking?
- What's the average days-on-market for RENTAL listings here right now (not sales)? A rising rental-DOM trend means longer vacancies and softer asking-rent achievability than the comps imply.
- What's the recent tenant-quality profile in this submarket — average credit score on applications, eviction rate, late-payment / NSF rate, and stable-employment percentage? A property-management company in the area should have these aggregated.
- How much new for-sale + rental construction is in the pipeline within 1–3 miles? Heavy new supply typically softens prices + rents 12–24 months out; constrained supply supports both.
Investment metrics
- 1% rule
- 3.12% ✓
- Cap rate
- 27.05%
- Cash-on-cash
- 74.13%
- DSCR
- 4.30
- GRM
- 2.7
CMA / ARV
- ARV (on-the-fly)
- $211,140
- Comps found
- 12
Show comp detail 12 sales within ~0.75 mi
| Address | Dist | Beds/Ba | Sqft | Sold | Price | $/sf | Match |
|---|---|---|---|---|---|---|---|
| 3110 N 6th Ave | 0.45mi | 3/1.0 | 1,573 (+1%) | 2mo | $115,000 | $73 | 76 |
| 510 E Fisher St | 0.67mi | 3/1.0 | 1,542 (-1%) | 2mo | $135,000 | $88 | 65 |
| 3003 Torres Ave | 0.56mi | 3/1.0 | 1,440 (-8%) | 3mo | $123,000 | $85 | 58 |
| 196 Highland Dr | 0.41mi | 4/2.0 (+1) | 1,482 (-5%) | 8mo | $200,000 | $135 | 56 |
| 4013 N 9th Ave | 0.65mi | 3/2.0 | 1,550 (-1%) | 10mo | $210,000 | $135 | 55 |
| 715 Woodland Dr | 0.66mi | 4/2.0 (+1) | 1,622 (+4%) | 6mo | $205,000 | $126 | 49 |
| 1100 Barcia Dr | 0.63mi | 4/2.0 (+1) | 1,660 (+6%) | 6mo | $240,000 | $145 | 46 |
| 2911 N Miller St | 0.53mi | 3/2.0 | 1,345 (-14%) | 2mo | $240,000 | $178 | 46 |
| 609 E Fisher | 0.72mi | 3/2.0 | 1,400 (-10%) | 1mo | $295,000 | $211 | 44 |
| 25 Escalona Ave | 0.67mi | 3/2.0 | 1,406 (-10%) | 6mo | $270,000 | $192 | 43 |
| 702 Boxwood Dr | 0.74mi | 3/2.0 | 1,451 (-7%) | 12mo | $250,000 | $172 | 39 |
| 704 Woodland Dr | 0.68mi | 3/2.0 | 1,357 (-13%) | 5mo | $160,000 | $118 | 38 |
Match score weights: distance 35% · size 25% · config 20% · recency 20%. Top-matched comps best support the ARV.
Projected returns pro-forma
-3.0% appreciation · 3.39% rent growth · sell at horizon
- IRR
- 74.4%
- Equity multiple
- 4.40×
- Total profit
- $72,404
- Equity at exit
- $11,332
- IRR
- 78.3%
- Equity multiple
- 9.22×
- Total profit
- $174,945
- Equity at exit
- $6,571
Cash invested: $21,280 (down + closing). Projections, not guarantees.
Landlord ↔ Tenant lean methodology
- Overall (STATE)
- 87 Strongly Landlord-Friendly
- State Florida
- 87 Strongly Landlord-Friendly · R+3
- County
- — inherits STATE
- City
- — inherits STATE
ZIP-level market 32503
- Rents YoY
- 3.4%
- Active inventory
- 240
- Price-to-rent
- 2.7×
Monthly cashflow live
- Estimated rent
- $2,368 high interval (Pro) →
- Mortgage (P&I)
- −$399
- Tax from tax record
- −$126 /mo · $1,509/yr
- Insurance
- −$32
- HOA
- −$0
- Vacancy / Maint / Mgmt
- −$497
- Net cashflow
- $1,315
Break-even live
UW: 25.0% down · 7.5% · 30yr · 1.5% tax · 5.0% vac · 8.0% maint · 8.0% mgmt
Financing live
Cash to close
- Down payment
- $19,000
- Closing costs
- $2,280
- Reserves months
- —
- Total cash needed
- —
Loan-product check · same deal, 3 products live
Conventional
25% down · 7.5% · 30yr
- Down + closing
- —
- Monthly P&I
- —
- Monthly cashflow
- —
- DSCR
- —
- Eligible?
- —
Personal DTI + credit; lowest rate.
DSCR
20% down · 8.5% · 30yr
- Down + closing
- —
- Monthly P&I
- —
- Monthly cashflow
- —
- DSCR
- —
- Eligible?
- —
No personal income docs; deal must DSCR.
Hard money
10% down · 12.0% · 12mo
- Down + closing
- —
- Monthly P&I
- —
- Monthly cashflow
- —
- DSCR
- —
- Eligible?
- —
Short-term bridge; refi at stabilization.
Rent comps 10 comps
| Address | Beds | Baths | Sqft | Rent | $/sqft | DOM | Units | Dist |
|---|---|---|---|---|---|---|---|---|
| 3131 N 10th Ave Pensacola, FL | 3.0 | 1.5 | 1085 | $1,700 | $1.57 | 23d | 1 | 0.69mi |
| 4400 N 9th Ave Pensacola, FL | 3.0 | 1.5 | 1713 | $2,000 | $1.17 | 23d | 1 | 0.96mi |
| 531 Ditmar St Unit B Pensacola, FL | 2.0 | 1.0 | 1094 | $1,450 | $1.33 | 23d | 1 | 0.97mi |
| 1301 E Cross St Pensacola, FL | 3.0 | 2.0 | 2200 | $3,900 | $1.77 | 13d | 1 | 1.11mi |
| 407 W Jordan St Unit NA Pensacola, FL | 3.0 | 2.0 | 1300 | $2,200 | $1.69 | 23d | 1 | 1.19mi |
| 2008 N 8th Ave Pensacola, FL | 3.0 | 2.0 | 1058 | $1,250 | $1.18 | 13d | 1 | 1.23mi |
| 1501 E Cross St Pensacola, FL | 4.0 | 2.0 | 1920 | $3,000 | $1.56 | 13d | 1 | 1.25mi |
| 1501 E Cross St Pensacola, FL | 4.0 | 2.0 | 1920 | $3,200 | $1.67 | 23d | 1 | 1.25mi |
| 1121 E Maxwell St Pensacola, FL | 3.0 | 2.5 | 1716 | $3,550 | $2.07 | 23d | 1 | 1.28mi |
| 3014 Magnolia Ave Pensacola, FL | 3.0 | 2.0 | 1650 | $2,750 | $1.67 | 23d | 1 | 1.42mi |
Listing history 14 events
-
2026-06-18days on market $76,000 Active 23 DOM
-
2026-06-17days on market $76,000 Active 22 DOM
-
2026-06-16days on market $76,000 Active 21 DOM
-
2026-06-15days on market $76,000 Active 20 DOM
-
2026-06-14days on market $76,000 Active 18 DOM
-
2026-06-10days on market $76,000 Active 15 DOM
-
2026-06-09days on market $76,000 Active 14 DOM
-
2026-06-08days on market $76,000 Active 13 DOM
-
2026-06-07days on market $76,000 Active 12 DOM
-
2026-06-03days on market $76,000 Active 8 DOM
-
2026-06-02days on market $76,000 Active 7 DOM
-
2026-06-01days on market $76,000 Active 6 DOM
-
2026-05-31days on market $76,000 Active 5 DOM
-
2026-05-27$76,000 Active
ⓘ Source: listings_history table (triggers on properties + properties_extension) + one-shot
backfill from property_details.listing_events for pre-trigger history.
Tax reassessment forecast FL · Resets to sale price
- Current annual tax
- $1,509 · $126/mo
- Projected year-2 tax
- $1,509 · $126/mo
- Expected delta
- $0/yr ($0/mo · 0.0%)
ⓘ Screening estimate from a state-policy table — verify with the county assessor before closing.
Climate risk First Street
- Flood 1/10 Low FEMA zone X (unshaded) · 0% chance over 30 yrs
- Wildfire 1/10 Low
- Heat 10/10 Extreme 7 d/yr ≥105°F today · 22 d/yr by 30 yrs out
- Wind 9/10 Extreme 99% chance of damaging wind over 30 yrs
- Air quality 2/10 Low 0 unhealthy d/yr today · 1 by 30 yrs out
Nearby sold comps map
Loading sold comps map…
Walkable amenities ~0.75 mi
Loading nearby amenities…
Taxation est. · year 1
- Rental income
- $28,415
- − Mortgage interest
- −$4,257
- − Property taxes
- −$1,509
- − Insurance
- −$380
- − Repairs & maintenance
- −$2,273
- − Management
- −$2,273
- − Depreciation
- −$2,211
- Taxable income
- $15,511
- Est. tax owed @ 24.0%
- −$3,723
- After-tax cash flow
- $12,053/yr
For passive investors: Depreciation is non-cash, so a rental often shows a tax loss while cash-flowing — sheltering income. Rental losses are passive: they offset passive income freely, and up to $25,000/yr can offset ordinary (W-2) income if you actively participate and your MAGI is under $100k (phasing out to $0 by $150k); unused losses carry forward. On sale, claimed depreciation is recaptured at up to 25%, and gains may owe capital-gains tax (a 1031 exchange can defer both). Figures are a year-1 estimate at your 24.0% rate — not tax advice; consult a CPA.
Schools (NCES district)
- District
- Escambia
- NCES district ID
- 1200510
- Math proficiency
- 40% ▼ -9.00%
- Reading proficiency
- 45% ▼ -4.00%
- Median HH income
- $44,649
- Composite
- 36.04/100
- National rank
- #4773
- State rank
- #56 of 73 in FL
Livability — Goulding
- Score
- 73/100
- State rank
- #296
- US rank
- #5022
Category grades
Schools grade is shown separately in the Schools card above.
Census & demographics
- Census place
- Goulding, FL
- County
- Escambia County · 301,722 people
- Metro
- Pensacola-Ferry Pass-Brent, FL
- Population (ZIP)
- 33,559
- Household income
- $71,411
- Rent vs Own
- Severe rent burden
- 948.0
Population outlook (Escambia County) Hauer SSP2
- Today (2025)
- 334,637 people
- By 2030
- 345,779 · +3.3%
- By 2040
- 364,828 · +9.0%
- By 2050
- 378,514 · +13.1%
- By 2075
- 403,220 · +20.5%
- By 2100
- 386,125 · +15.4%
Race, ethnicity, and origin ACS 2023
- Neighborhood character
- Predominantly White (68%)
- Race & ethnicity
- White 68% Black 20% Two or more races 6% Hispanic / Latino 5% Asian 2%
- Common ancestry
- Lithuanian 3% Italian 2% Romanian 2%
- Foreign-born
- 5% · Canada, China
- Languages at home
- 93% English-only · Spanish 3% Arabic 1% Tagalog/Filipino 1%
Political lean MEDSL · Escambia
- 2024 margin
- R (+19.5) · D 39.7% · R 59.2% · Other 1.1%
- 2008→2024 swing
- -0.2pp no change · 2008: -19.3pp · 2024: -19.5pp
- All cycles
- 2024: R+19.5 2020: R+15.1 2016: R+20.6 2012: R+20.6 2008: R+19.3
Not yet ingested
- Civics
- —
Market trends
- HPI YoY
- ▼ -300.02%
- Current HPI
- 294.4873
- Rent YoY
- ▲ 3.39%
- Metro
- Pensacola-Ferry Pass-Brent, FL
- State GDP YoY
- ▲ 3.28%
- F500 in state
- 36
Industry mix (Fortune 500 HQ in FL)
| Industry | F500 HQs | Revenue |
|---|---|---|
| Industrial Technology | 2 | $29B |
|
||
| Insurance | 2 | $17B |
|
||
| Retail | 1 | $60B |
|
||
| Technology Distribution | 1 | $58B |
|
||
| Homebuilding | 1 | $35B |
|
||
| Technology Manufacturing | 1 | $35B |
|
||
Price history
1 event — show timeline
- 2026-05-27 Listed $76,000 FSBO.com
Property tax history
+6.2%/yrLatest (2025): $1,509 · +13.6% YoY. Source: county tax records.
Cash-flow waterfall
monthlySold comps — $/sqft
last 12 mo · ≤1 miLoading sold comps…