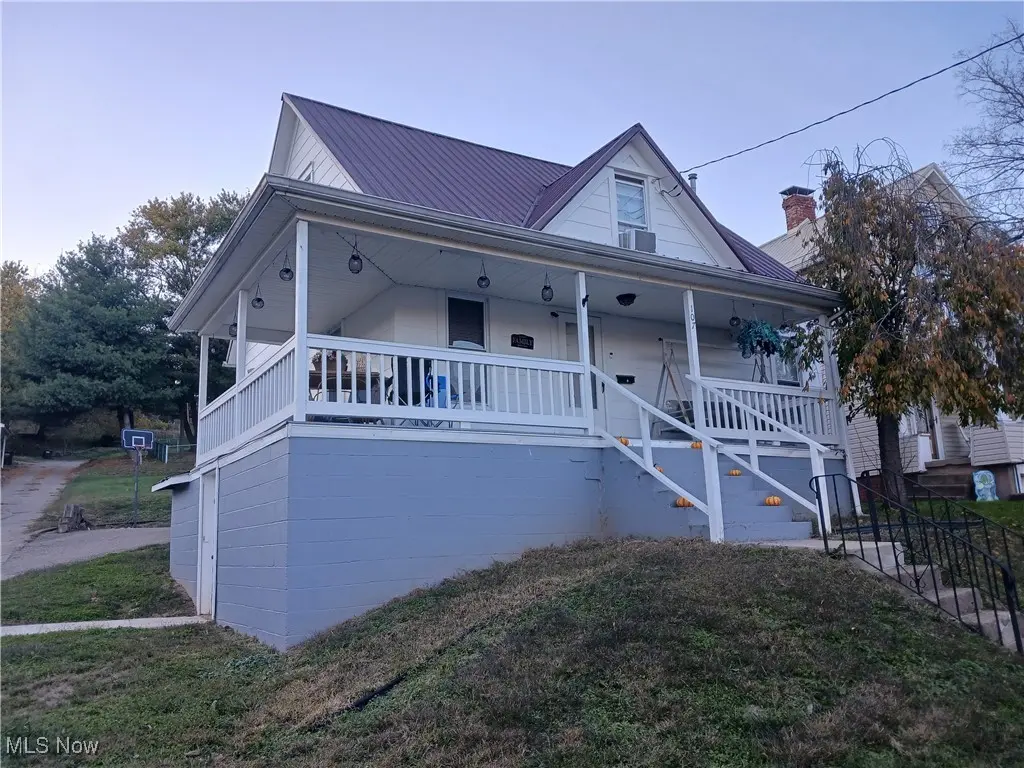
107 Vine St · Marietta, OH
Flood risk 4/10 · Minor
- FEMA flood zone
- X (unshaded)
- Chance of flooding over 30 yrs
- 0.22%
- Est. flood insurance / yr
- $473 – $860
Fire risk 2/10 · Minimal
- Est. fire insurance / yr
- $713 – $1,323
Heat risk 4/10 · Minor
- Hot days now (above 101°F)
- 7 days/yr
- Hot days in 30 yrs
- 18 days/yr
Wind risk 2/10 · Minimal
- Chance of severe wind over 30 yrs
- 1.0%
Air-quality risk 2/10 · Minimal
- Unhealthy air days now
- 1 days/yr
- Unhealthy air days in 30 yrs
- 2 days/yr
Risk factors via First Street. Map © Google.
Why this score? — see what drove the B grade
The composite is a weighted blend of 9 inputs, each scored 0–100. Each bar is that input's sub-score; the figure is the points it added to the 100-point composite (weight × sub-score).
- Cash flow +27.6/30.0
- ARV discount +15.0/15.0
- DSCR +9.7/10.0
- 1% rule +6.9/10.0
- Livability +4.0/5.0
- Schools +3.5/10.0
- Rent growth +2.5/5.0
- Condition / age +2.5/5.0
- Appreciation +0.0/10.0
$115,000
🖨 Deal sheet 📄 Offer letter ✓ Due diligence
Listing remarks MLS
Welcome to this adorable two-bedroom 1 bath home nestled in the heart of Marietta! Character and warmth, this cozy property is ideal for first time home buyers, downsizers, or investors looking for a turnkey rental. Two bedrooms upstairs and one room on the main floor that can be used as a third. Located just minutes from shops dining. Whether you're looking for an affordable place to call your own or a low maintenance investment property this Marietta gem is ready for you.
Key facts
- 8,398 sq ft lot
- Parking
- Built 1920
Neighborhood map
What this means for you Summary
Snapshot
- This is a 2-bed/1.0-bath single-family listed at $115k.
Deal economics
- At list price, monthly cash flow is $344 ($4k/yr) — positive.
- The deal already cash-flows at list — no discount required.
- Meets the 1% rule at list price ($1k rent vs $115k).
- Recommended offer: $101k (12.0% below list) — sets the bar for market timing.
- Cap rate 9.9% vs local median 6.3% in Marietta — top-decile yield for the area; either an underpriced asset or a hidden risk that comps aren't pricing in. Stress-test before assuming the spread holds.
Location & tenants
- Location reads 80/100 on livability (#127 in OH, #1,845 nationally) — a professional / high-income tenant draw. Strengths: cost of living A+, housing A+, health & safety A+; Watch: commute F, employment D-.
- Marietta City (town): math 35% / reading 49% proficiency, ranked #534 of 656 in OH (top 81%) — families likely to look elsewhere, expect single-tenant / working-renter base with shorter leases.
- Market conditions: 118 active listings in the ZIP; 3 comparable units currently listed for rent nearby; rentals lingering (median 44d on market — plan ~5-8 weeks vacancy on turnover, expect pricing pressure); 100% of comp listings sitting > 30 days — soft ceiling on asking rent; 3 units permitted in Washington County in 2024 (0 in 5+ unit buildings).
Forward outlook
- Local home prices are declining (-3.0%/yr); year-one equity from $795 of loan paydown is wiped out by about $3k of value loss. Plan a longer hold.
- Washington County population projected at -12% by 2050 — secular population decline; favor cash flow + early exit over multi-decade hold.
- At projected returns (-3.0% appreciation + 3.0% rent growth), your $32k cash investment doubles in ~9 years — after that, you're playing with house money.
Negotiation context
- It's been on market 198 days — a 12% lower offer ($101k) is reasonable based on typical stale-listing flexibility.
- 2 sale attempts since 21y ago; this cycle's ask has dropped $10k (8%) from the opening price — seller is motivated, your offer sets the floor, not the list.
- Current owner paid $25k; list at $115k implies a 360% gain — meaningful room to come down on a strong offer.
Risks & watch-outs
- Watch-outs: built in 1920 — expect roof / HVAC / electrical / plumbing capex.
Questions for the listing agent
- It's been on market 198 days. Have you received any prior offers? Is the seller open to a 12% concession, seller financing, or rate buy-down credit?
- Built in 1920 — when were the roof, HVAC, electrical panel, plumbing, and water heater last replaced?
- Why hasn't it sold? Are there any deal-killer items the seller is aware of (foundation, flood, title, zoning, code violations)?
- Is there a deadline driving the sale (1031 exchange, divorce, estate, relocation)? That informs how much negotiation room exists.
- Schools are B-rated — typically a magnet for longer-tenancy family renters. What's the average tenant stay here, and is there a school-zone premium baked into asking?
- What's the average days-on-market for RENTAL listings here right now (not sales)? A rising rental-DOM trend means longer vacancies and softer asking-rent achievability than the comps imply.
- What's the recent tenant-quality profile in this submarket — average credit score on applications, eviction rate, late-payment / NSF rate, and stable-employment percentage? A property-management company in the area should have these aggregated.
- How much new for-sale + rental construction is in the pipeline within 1–3 miles? Heavy new supply typically softens prices + rents 12–24 months out; constrained supply supports both.
Investment metrics
- 1% rule
- 1.19% ✓
- Cap rate
- 9.88%
- Cash-on-cash
- 12.82%
- DSCR
- 1.57
- GRM
- 7.0
CMA / ARV
- ARV (median comp)
- $144,731
- List price
- $115,000
- Delta
- -20.54%
- Verdict
- UNDERPRICED
- Comps
- 20 within 1.0 mi
Show comp detail 7 sales within ~0.75 mi
| Address | Dist | Beds/Ba | Sqft | Sold | Price | $/sf | Match |
|---|---|---|---|---|---|---|---|
| 109 E Spring St | 0.13mi | 3/1.0 (+1) | 1,052 (-4%) | 20mo | $169,000 | $161 | 65 |
| 207 Chestnut St | 0.25mi | 3/2.0 (+1) | 1,072 (-2%) | 18mo | $130,000 | $121 | 61 |
| 626 Phillips St | 0.31mi | 2/1.0 | 984 (-10%) | 21mo | $132,500 | $135 | 52 |
| 119 Grant St | 0.62mi | 2/2.0 | 1,184 (+8%) | 5mo | $167,000 | $141 | 50 |
| 106 Miller Ave | 0.70mi | 3/1.0 (+1) | 1,194 (+9%) | 4mo | $205,000 | $172 | 44 |
| 503 Aurora St | 0.43mi | 3/2.0 (+1) | 1,162 (+6%) | 22mo | $147,500 | $127 | 43 |
| 628 Phillips St | 0.32mi | 3/2.0 (+1) | 960 (-12%) | 21mo | $152,900 | $159 | 38 |
Match score weights: distance 35% · size 25% · config 20% · recency 20%. Top-matched comps best support the ARV.
Projected returns pro-forma
-3.0% appreciation · 3.0% rent growth · sell at horizon
- IRR
- 2.6%
- Equity multiple
- 1.10×
- Total profit
- $3,268
- Equity at exit
- $17,147
- IRR
- 12.2%
- Equity multiple
- 1.96×
- Total profit
- $31,017
- Equity at exit
- $9,943
Cash invested: $32,200 (down + closing). Projections, not guarantees.
Landlord ↔ Tenant lean methodology
- Overall (STATE)
- 73 Landlord-Friendly
- State Ohio
- 73 Landlord-Friendly · R+6
- County
- — inherits STATE
- City
- — inherits STATE
ZIP-level market 45750
- Home prices YoY
- -32.4%
- Active inventory
- 118
- Price-to-rent
- 7.0×
Monthly cashflow live
- Estimated rent
- $1,374 medium interval (Pro) →
- Mortgage (P&I)
- −$603
- Tax from tax record
- −$90 /mo · $1,084/yr
- Insurance
- −$48
- HOA
- −$0
- Vacancy / Maint / Mgmt
- −$289
- Net cashflow
- $344
Break-even live
UW: 25.0% down · 7.5% · 30yr · 1.5% tax · 5.0% vac · 8.0% maint · 8.0% mgmt
Financing live
Cash to close
- Down payment
- $28,750
- Closing costs
- $3,450
- Reserves months
- —
- Total cash needed
- —
Loan-product check · same deal, 3 products live
Conventional
25% down · 7.5% · 30yr
- Down + closing
- —
- Monthly P&I
- —
- Monthly cashflow
- —
- DSCR
- —
- Eligible?
- —
Personal DTI + credit; lowest rate.
DSCR
20% down · 8.5% · 30yr
- Down + closing
- —
- Monthly P&I
- —
- Monthly cashflow
- —
- DSCR
- —
- Eligible?
- —
No personal income docs; deal must DSCR.
Hard money
10% down · 12.0% · 12mo
- Down + closing
- —
- Monthly P&I
- —
- Monthly cashflow
- —
- DSCR
- —
- Eligible?
- —
Short-term bridge; refi at stabilization.
Rent comps 3 comps
| Address | Beds | Baths | Sqft | Rent | $/sqft | DOM | Units | Dist |
|---|---|---|---|---|---|---|---|---|
| 108 Putnam St Unit A Marietta, OH | 1.0 | 1.0 | 1100 | $1,499 | $1.36 | 44d | 1 | 1.13mi |
| 628 2nd St Unit Downstairs Marietta, OH | 1.0 | 1.0 | 1024 | $1,600 | $1.56 | 44d | 1 | 1.49mi |
| 801 Huggins Rd Williamstown, WV | 2.0 | 1.5 | 1160 | $1,000 | $0.86 | 44d | 1 | 1.49mi |
Listing history 9 events
-
2026-06-03days on market $115,000 Active 198 DOM
-
2026-06-02days on market $115,000 Active 197 DOM
-
2026-06-01days on market $115,000 Active 196 DOM
-
2026-05-31days on market $115,000 Active 195 DOM
-
2026-05-30days on market $115,000 Active 194 DOM
-
2026-03-26price $115,000 478-char remark
Show marketing remark (478 chars)
Welcome to this adorable two-bedroom 1 bath home nestled in the heart of Marietta! Character and warmth, this cozy property is ideal for first time home buyers, downsizers, or investors looking for a turnkey rental. Two bedrooms upstairs and one room on the main floor that can be used as a third. Located just minutes from shops dining. Whether you're looking for an affordable place to call your own or a low maintenance investment property this Marietta gem is ready for you.
-
2025-11-15$125,000 Active 478-char remark
Show marketing remark (478 chars)
Welcome to this adorable two-bedroom 1 bath home nestled in the heart of Marietta! Character and warmth, this cozy property is ideal for first time home buyers, downsizers, or investors looking for a turnkey rental. Two bedrooms upstairs and one room on the main floor that can be used as a third. Located just minutes from shops dining. Whether you're looking for an affordable place to call your own or a low maintenance investment property this Marietta gem is ready for you.
-
2006-01-23soldstatus $25,000 318-char remark
Show marketing remark (318 chars)
Could possibly use room downstairs for 3rd BR. Needs TLC but good location. Great fixer-upper. Newer windows and furnace. Back door unlocked. Electric is on. Elem: Phillips Elementary School Elem/Bus: N JrHigh/Bus: N High/Bus: Y Fire: CIT Police: CTY ; SQFT=Fin L1:744, Fin L2:351, Fin Above:1095, Fin Total:1095
-
2005-11-28$29,900 318-char remark
Show marketing remark (318 chars)
Could possibly use room downstairs for 3rd BR. Needs TLC but good location. Great fixer-upper. Newer windows and furnace. Back door unlocked. Electric is on. Elem: Phillips Elementary School Elem/Bus: N JrHigh/Bus: N High/Bus: Y Fire: CIT Police: CTY ; SQFT=Fin L1:744, Fin L2:351, Fin Above:1095, Fin Total:1095
ⓘ Source: listings_history table (triggers on properties + properties_extension) + one-shot
backfill from property_details.listing_events for pre-trigger history.
Tax reassessment forecast OH · Partial reset (capped growth)
- Current annual tax
- $1,084 · $90/mo
- Projected year-2 tax
- $1,439 · $120/mo
- Expected delta
- +$355/yr (+$30/mo · 32.8%)
ⓘ Screening estimate from a state-policy table — verify with the county assessor before closing.
Climate risk First Street
- Flood 4/10 Moderate FEMA zone X (unshaded) · 22% chance over 30 yrs
- Wildfire 2/10 Low
- Heat 4/10 Moderate 7 d/yr ≥101°F today · 18 d/yr by 30 yrs out
- Wind 2/10 Low 100% chance of damaging wind over 30 yrs
- Air quality 2/10 Low 1 unhealthy d/yr today · 2 by 30 yrs out
Nearby sold comps map
Loading sold comps map…
Walkable amenities ~0.75 mi
Loading nearby amenities…
Taxation est. · year 1
- Rental income
- $16,487
- − Mortgage interest
- −$6,442
- − Property taxes
- −$1,084
- − Insurance
- −$575
- − Repairs & maintenance
- −$1,319
- − Management
- −$1,319
- − Depreciation
- −$3,345
- Taxable income
- $2,403
- Est. tax owed @ 24.0%
- −$577
- After-tax cash flow
- $3,552/yr
For passive investors: Depreciation is non-cash, so a rental often shows a tax loss while cash-flowing — sheltering income. Rental losses are passive: they offset passive income freely, and up to $25,000/yr can offset ordinary (W-2) income if you actively participate and your MAGI is under $100k (phasing out to $0 by $150k); unused losses carry forward. On sale, claimed depreciation is recaptured at up to 25%, and gains may owe capital-gains tax (a 1031 exchange can defer both). Figures are a year-1 estimate at your 24.0% rate — not tax advice; consult a CPA.
Schools (NCES district)
- District
- Marietta City
- NCES district ID
- 3910019
- Math proficiency
- 35% ▼ -20.00%
- Reading proficiency
- 49% ▼ -12.00%
- Median HH income
- $39,366
- Composite
- 35.08/100
- National rank
- #5025
- State rank
- #534 of 656 in OH
Livability — Marietta
- Score
- 80/100
- State rank
- #127
- US rank
- #1845
Category grades
Schools grade is shown separately in the Schools card above.
Census & demographics
- Census place
- Marietta, OH
- County
- Washington County · 26,420 people
- City population
- 26,420
- Metro
- Marietta, OH
- Population (ZIP)
- 26,420
- Household income
- $60,229
- Rent vs Own
- Severe rent burden
- 727.0
Population outlook (Washington County) Hauer SSP2
- Today (2025)
- 59,640 people
- By 2030
- 58,315 · -2.2%
- By 2040
- 55,186 · -7.5%
- By 2050
- 52,246 · -12.4%
- By 2075
- 45,893 · -23.0%
- By 2100
- 38,128 · -36.1%
Race, ethnicity, and origin ACS 2023
- Neighborhood character
- Predominantly White (94%)
- Race & ethnicity
- White 94% Two or more races 2% Asian 1% Black 1% Hispanic / Latino 1%
- Common ancestry
- Italian 2% Slovak 2% Romanian 2%
- Foreign-born
- 2% · Canada
- Languages at home
- 97% English-only · Tagalog/Filipino 1% Other Indo-European 1%
Political lean MEDSL · Washington
- 2024 margin
- Solid R (+43.8) · D 27.7% · R 71.5%
- 2008→2024 swing
- +40.2pp toward D · 2008: -83.9pp · 2024: -43.8pp
- All cycles
- 2024: R+43.8 2020: R+40.8 2016: R+41.6 2012: R+19.4 2008: R+83.9
Not yet ingested
- Civics
- —
Market trends
- HPI YoY
- ▼ -95.06%
- Current HPI
- 198.6235
- Rent YoY
- —
- Metro
- Marietta, OH
- State GDP YoY
- ▲ 1.98%
- F500 in state
- 48
Industry mix (Fortune 500 HQ in OH)
| Industry | F500 HQs | Revenue |
|---|---|---|
| Insurance | 3 | $145B |
|
||
| Industrial Machinery | 3 | $49B |
|
||
| Financial Services | 3 | $24B |
|
||
| Consumer Goods | 2 | $93B |
|
||
| Aerospace / Defense | 2 | $47B |
|
||
| Utilities | 2 | $33B |
|
||
Price history
+284.6% since first listed4 events — show timeline
- 2026-03-26 Price Changed $115,000 MLSNOW
- 2025-11-15 Listed $125,000 MLSNOW
- 2006-01-23 Sold (MLS) $25,000 MLSNOW
- 2005-11-28 Listed $29,900 MLSNOW
Property tax history
+6.6%/yrLatest (2025): $1,084 · +27.9% YoY. Source: county tax records.
Cash-flow waterfall
monthlySold comps — $/sqft
last 12 mo · ≤1 miLoading sold comps…