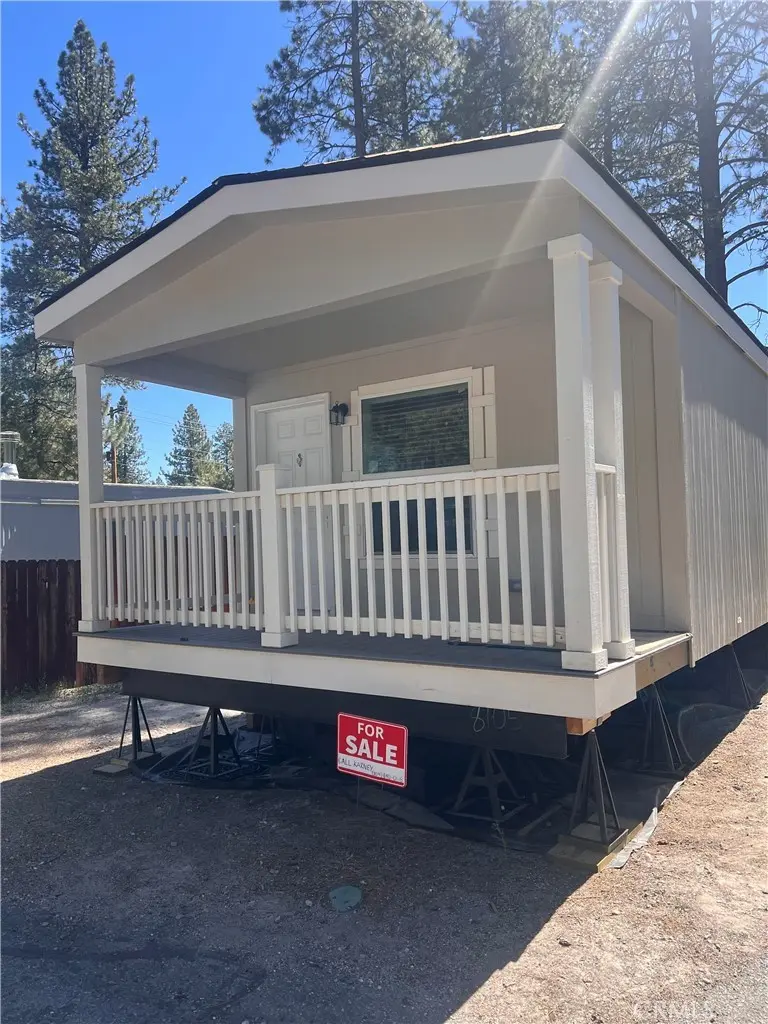
475 Thrush Dr #17 · Big Bear Lake, CA
Flood risk 5/10 · Moderate
- FEMA flood zone
- X (unshaded)
- Chance of flooding over 30 yrs
- 0.27%
- Est. flood insurance / yr
- $507 – $1,088
Fire risk 7/10 · Major
- Est. fire insurance / yr
- $659 – $1,223
Heat risk 2/10 · Minimal
- Hot days now (above 83°F)
- 10 days/yr
- Hot days in 30 yrs
- 27 days/yr
Wind risk 1/10 · Minimal
- Chance of severe wind over 30 yrs
- —
Air-quality risk 10/10 · Severe
- Unhealthy air days now
- 33 days/yr
- Unhealthy air days in 30 yrs
- 39 days/yr
Risk factors via First Street. Map © Google.
Why this score? — see what drove the C+ grade
The composite is a weighted blend of 9 inputs, each scored 0–100. Each bar is that input's sub-score; the figure is the points it added to the 100-point composite (weight × sub-score).
- Cash flow +30.0/30.0
- 1% rule +10.0/10.0
- DSCR +10.0/10.0
- ARV discount +3.3/15.0
- Livability +3.2/5.0
- Schools +2.9/10.0
- Condition / age +2.2/5.0
- Rent growth +1.6/5.0
- Appreciation +0.0/10.0
$99,000
🖨 Deal sheet 📄 Offer letter ✓ Due diligence
Listing remarks
This 2-bedroom, 1-bath home offers approximately 888 sq ft of bright, single-level living with a front living room layout. The all-new kitchen features stainless steel appliances throughout — self-cleaning gas range, dishwasher, built-in microwave, and a 22 cu. ft. side-by-side refrigerator with ice and water — paired with white glaze cabinetry and a garbage disposal. Built for mountain living with energy-efficient 2x6 exterior walls, R-19 insulation, and a Wildland-Urban Interface (WUI) fire-resistant package including tempered glass and fire-rated venting. A porch deck adds outdoor space to take in the clean mountain air and surrounding pines. Located in Trails End, a 55+ age-
Key facts
- R-19 insulation
- Porch deck
- All-new kitchen
Tags
Property features AI
Finance
- Other: Pets allowed with size limit; dogs and cats OK
- Financial info: Land lease of $875 per month (park)
- HOA & community: Located in a senior community; Trails End Mobile Home Park; Community features: biking, hiking, fishing, mountainous setting, street lighting, sidewalks
Exterior
- Parking: Carport (1 space); Has parking
- Security: Fire sprinklers
- Utilities: Standard electric service; Natural gas connected; Public/district water; Sewer connected (public sewer); Electricity connected
- Home design: Manufactured home (mobile home remains); Single-story; Turnkey condition; Entry at ground level with steps; Mobile home approx. 14' x 62'
- Construction: Permanent foundation on concrete slab; Year built source: Builder
- Exterior features: Front porch; Porch at front of home; Wood fencing; Lot is level/flat; Across the road from a lake/ocean (view); Private paved road frontage
Interior
- Kitchen: Energy Star appliances; Gas range; Self-cleaning oven; Range/stove hood; Microwave; Refrigerator; Dishwasher; Water heater unit; Laminate countertops
- Bedrooms: Primary bedroom; All bedrooms on the main floor; Main floor bedroom
- Flooring: Vinyl
- Bathrooms: One full bathroom with bathtub and shower-in-tub; Exhaust fan(s)
- Heating & cooling: Natural gas heating; Energy Star heating
- Interior features: Open floor plan; Recessed lighting; Laminate counters; Energy Star doors; Fire sprinklers
- Laundry & utility: Washer hookup; Gas and electric dryer hookups
Neighborhood map
What this means for you Summary
Snapshot
- This is a 2-bed/1.0-bath manufactured listed at $99k. Condition is rated fair.
Deal economics
- At list price, monthly cash flow is $764 ($9k/yr) — positive.
- The deal already cash-flows at list — no discount required.
- Meets the 1% rule at list price ($2k rent vs $99k).
- Cap rate 15.6% vs local median 2.4% in Big Bear Lake — top-decile yield for the area; either an underpriced asset or a hidden risk that comps aren't pricing in. Stress-test before assuming the spread holds.
Location & tenants
- Location reads 64/100 on livability (#420 in CA) — a middle-class / working-renter tenant base. Strengths: commute A+; Watch: crime C-, housing C-, health & safety D+.
- Bear Valley Unified (town): math 26% / reading 43% proficiency, ranked #289 of 517 in CA (top 56%) — families likely to look elsewhere, expect single-tenant / working-renter base with shorter leases.
- Market conditions: Rents falling (-3.5%/yr); 528 active listings in the ZIP; 7 comparable units currently listed for rent nearby; rentals at typical pace (median 19d on market — plan ~3-4 weeks tenant-placement turnaround); solid renter incomes; 5,458 units permitted in San Bernardino County in 2024 (1,500 in 5+ unit buildings).
Forward outlook
- Local home prices are declining (-3.0%/yr); year-one equity from $684 of loan paydown is wiped out by about $3k of value loss. Plan a longer hold.
- San Bernardino County population projected at +15% by 2050 — modest demand growth; plan on rents tracking national, not racing it.
- At projected returns (-3.0% appreciation + 0.0% rent growth), your $28k cash investment doubles in ~4 years — after that, you're playing with house money.
Negotiation context
- Only 9 days on market — expect competitive offers; lowballing is unlikely to land.
Risks & watch-outs
- Climate carrying-cost: moderate flood risk; major wildfire risk — expect insurance premiums to compound above CPI over the hold.
Questions for the listing agent
- Have any recent inspections been done? Can we get a copy of the seller's disclosures and any deferred-maintenance estimates?
- Is there a deadline driving the sale (1031 exchange, divorce, estate, relocation)? That informs how much negotiation room exists.
- Schools are D-rated, which usually means shorter tenancies and higher turnover. Who's the typical renter profile here, and what's been the actual vacancy rate?
- What's the average days-on-market for RENTAL listings here right now (not sales)? A rising rental-DOM trend means longer vacancies and softer asking-rent achievability than the comps imply.
- What's the recent tenant-quality profile in this submarket — average credit score on applications, eviction rate, late-payment / NSF rate, and stable-employment percentage? A property-management company in the area should have these aggregated.
- How much new for-sale + rental construction is in the pipeline within 1–3 miles? Heavy new supply typically softens prices + rents 12–24 months out; constrained supply supports both.
Investment metrics
- 1% rule
- 1.85% ✓
- Cap rate
- 15.56%
- Cash-on-cash
- 33.09%
- DSCR
- 2.47
- GRM
- 4.5
CMA / ARV
- ARV (on-the-fly)
- $90,576
- Comps found
- 2
Show comp detail 2 sales within ~0.75 mi
| Address | Dist | Beds/Ba | Sqft | Sold | Price | $/sf | Match |
|---|---|---|---|---|---|---|---|
| 475 Thrush Dr #31 | 0.52mi | 2/1.0 | 848 (-4%) | 15mo | $22,000 | $26 | 56 |
| 475 Thrush Dr #20 | 0.51mi | 2/2.0 | 860 (-3%) | 22mo | $88,000 | $102 | 49 |
Match score weights: distance 35% · size 25% · config 20% · recency 20%. Top-matched comps best support the ARV.
Projected returns pro-forma
-3.0% appreciation · 0.0% rent growth · sell at horizon
- IRR
- 24.8%
- Equity multiple
- 1.98×
- Total profit
- $27,301
- Equity at exit
- $14,761
- IRR
- 30.7%
- Equity multiple
- 3.37×
- Total profit
- $65,812
- Equity at exit
- $8,560
Cash invested: $27,720 (down + closing). Projections, not guarantees.
Landlord ↔ Tenant lean methodology
- Overall (STATE)
- 18 Strongly Tenant-Friendly
- State California
- 18 Strongly Tenant-Friendly · D+13
- County
- — inherits STATE
- City
- — inherits STATE
ZIP-level market 92315
- Rents YoY
- -3.5%
- Active inventory
- 528
- Price-to-rent
- 4.5×
Monthly cashflow live
- Estimated rent
- $1,834 high interval (Pro) →
- Mortgage (P&I)
- −$519
- Tax est. 1.5%
- −$124 /mo · $1,485/yr
- Insurance
- −$41
- HOA
- −$0
- Vacancy / Maint / Mgmt
- −$385
- Net cashflow
- $764
Break-even live
UW: 25.0% down · 7.5% · 30yr · 1.5% tax · 5.0% vac · 8.0% maint · 8.0% mgmt
Financing live
Cash to close
- Down payment
- $24,750
- Closing costs
- $2,970
- Reserves months
- —
- Total cash needed
- —
Loan-product check · same deal, 3 products live
Conventional
25% down · 7.5% · 30yr
- Down + closing
- —
- Monthly P&I
- —
- Monthly cashflow
- —
- DSCR
- —
- Eligible?
- —
Personal DTI + credit; lowest rate.
DSCR
20% down · 8.5% · 30yr
- Down + closing
- —
- Monthly P&I
- —
- Monthly cashflow
- —
- DSCR
- —
- Eligible?
- —
No personal income docs; deal must DSCR.
Hard money
10% down · 12.0% · 12mo
- Down + closing
- —
- Monthly P&I
- —
- Monthly cashflow
- —
- DSCR
- —
- Eligible?
- —
Short-term bridge; refi at stabilization.
Rent comps 7 comps
| Address | Beds | Baths | Sqft | Rent | $/sqft | DOM | Units | Dist |
|---|---|---|---|---|---|---|---|---|
| 41935 Switzerland Dr #58 Big Bear Lake, CA | 2.0 | 3.0 | 1053 | $1,750 | $1.66 | 24d | 1 | 0.40mi |
| 365 Jeffries Rd Unit C Big Bear Lake, CA | 1.0 | 1.5 | 780 | $1,675 | $2.15 | 44d | 1 | 0.79mi |
| 784 Berkley Ln Unit 4 Big Bear Lake, CA | 2.0 | 1.0 | 600 | $1,350 | $2.25 | 18d | 1 | 0.80mi |
| 933 Cameron Dr Big Bear Lake, CA | 2.0 | 1.0 | 850 | $2,500 | $2.94 | 3d | 1 | 1.16mi |
| 42651 Falcon Ave Big Bear Lake, CA | 2.0 | 1.0 | 667 | $1,750 | $2.62 | 5d | 1 | 1.23mi |
| 42814 Willow Ave Big Bear Lake, CA | 2.0 | 2.0 | 798 | $1,995 | $2.50 | 17d | 1 | 1.43mi |
| 40504 Big Bear Blvd Big Bear Lake, CA | 1.0 | 1.0 | 700 | $1,600 | $2.29 | 44d | 1 | 1.48mi |
Listing history 8 events
-
2026-06-18days on market $99,000 Active 9 DOM
-
2026-06-17days on market $99,000 Active 8 DOM
-
2026-06-16days on market $99,000 Active 7 DOM
-
2026-06-15days on market $99,000 Active 6 DOM
-
2026-06-13days on market $99,000 Active 4 DOM
-
2026-06-13days on market $99,000 Active 3 DOM
-
2026-06-10remarks 687-char remark
-
2026-06-10$99,000 Active 1 DOM
ⓘ Source: listings_history table (triggers on properties + properties_extension) + one-shot
backfill from property_details.listing_events for pre-trigger history.
Climate risk First Street
- Flood 5/10 Major FEMA zone X (unshaded) · 27% chance over 30 yrs
- Wildfire 7/10 Severe
- Heat 2/10 Low 10 d/yr ≥83°F today · 27 d/yr by 30 yrs out
- Wind 1/10 Low
- Air quality 10/10 Extreme 33 unhealthy d/yr today · 39 by 30 yrs out
Nearby sold comps map
Loading sold comps map…
Walkable amenities ~0.75 mi
Loading nearby amenities…
Taxation est. · year 1
- Rental income
- $22,005
- − Mortgage interest
- −$5,546
- − Property taxes
- −$1,485
- − Insurance
- −$495
- − Repairs & maintenance
- −$1,760
- − Management
- −$1,760
- − Depreciation
- −$2,880
- Taxable income
- $8,078
- Est. tax owed @ 24.0%
- −$1,939
- After-tax cash flow
- $7,235/yr
For passive investors: Depreciation is non-cash, so a rental often shows a tax loss while cash-flowing — sheltering income. Rental losses are passive: they offset passive income freely, and up to $25,000/yr can offset ordinary (W-2) income if you actively participate and your MAGI is under $100k (phasing out to $0 by $150k); unused losses carry forward. On sale, claimed depreciation is recaptured at up to 25%, and gains may owe capital-gains tax (a 1031 exchange can defer both). Figures are a year-1 estimate at your 24.0% rate — not tax advice; consult a CPA.
Condition & rehab AI · 2 photos
This manufactured home requires significant repairs and maintenance, including major work on the exterior siding, roof, and flooring, as well as painting and touch-up. Addressing these issues will significantly increase its resale and rental value.
Repairs flagged
- Major exterior siding — Significant damage and wear visible.
- Major roof — Significant wear and potential leaks.
- Major flooring — Worn and possibly damaged, requiring replacement.
- Major interior walls/paint — Needs touch-up or repainting for a fresh look.
Value-add opportunities
- Both painting and touch-up — Fresh paint and touch-up will improve the home's appearance and curb appeal.
- Both roof repair — A repaired roof will prevent water damage and improve the home's value.
- Both flooring replacement — New flooring will enhance the home's aesthetic and functionality.
- Both exterior siding repair — Repairing the siding will improve the home's appearance and increase its value.
- Both general maintenance — Addressing all maintenance items will ensure the home is move-in ready and in good condition.
Renovation cost estimate screening
| Repair item | Severity | Est. cost |
|---|---|---|
| exterior siding · Significant damage and wear visible. | Major | $15,000–50,000 |
| roof · Significant wear and potential leaks. | Major | $15,000–50,000 |
| flooring · Worn and possibly damaged, requiring replacement. | Major | $15,000–50,000 |
| interior walls/paint · Needs touch-up or repainting for a fresh look. | Major | $15,000–50,000 |
| Total estimated repair cost · 4 items | $60,000–200,000 |
Value-add ROI direction
- Both painting and touch-up — Fresh paint and touch-up will improve the home's appearance and curb appeal. ↑
- Both roof repair — A repaired roof will prevent water damage and improve the home's value. ↑
- Both flooring replacement — New flooring will enhance the home's aesthetic and functionality. ↑
- Both exterior siding repair — Repairing the siding will improve the home's appearance and increase its value. ↑
- Both general maintenance — Addressing all maintenance items will ensure the home is move-in ready and in good condition. ↑
ⓘ Cost ranges are severity-bucket heuristics (US national rule-of-thumb). Get contractor quotes + a written scope before underwriting a rehab budget.
Schools (NCES district)
- District
- Bear Valley Unified
- NCES district ID
- 0604230
- Math proficiency
- 26% ▼ -4.00%
- Reading proficiency
- 43% ▼ -4.00%
- Median HH income
- $42,222
- Composite
- 29.12/100
- National rank
- #6588
- State rank
- #289 of 517 in CA
Livability — Big Bear Lake
- Score
- 64/100
- State rank
- #420
- US rank
- #14284
Category grades
Schools grade is shown separately in the Schools card above.
Census & demographics
- Census place
- Big Bear Lake, CA
- County
- San Bernardino County · 2,030,291 people
- City population
- 5,215
- Metro
- Riverside-San Bernardino-Ontario, CA
- Population (ZIP)
- 5,215
- Household income
- $77,436
- Rent vs Own
- Severe rent burden
- 209.0
Population outlook (San Bernardino County) Hauer SSP2
- Today (2025)
- 2,300,329 people
- By 2030
- 2,378,907 · +3.4%
- By 2040
- 2,523,137 · +9.7%
- By 2050
- 2,642,388 · +14.9%
- By 2075
- 2,880,769 · +25.2%
- By 2100
- 2,909,436 · +26.5%
Race, ethnicity, and origin ACS 2023
- Neighborhood character
- Predominantly White (69%)
- Race & ethnicity
- White 69% Hispanic / Latino 24% Two or more races 18% Asian 2%
- Hispanic origin (detail)
- Mexican 21% Salvadoran 1%
- Common ancestry
- Slovak 4% Italian 4% Portuguese 3%
- Foreign-born
- 13% · Canada, China, South Korea
- Languages at home
- 83% English-only · Spanish 10% Other Indo-European 1% Russian/Polish/Slavic 1%
Political lean MEDSL · San Bernardino
- 2024 margin
- Toss-up / Even · D 47.5% · R 49.7% · Other 2.8%
- 2008→2024 swing
- -8.5pp toward R · 2008: 6.3pp · 2024: -2.1pp
- All cycles
- 2024: R+2.1 2020: D+10.7 2016: D+9.8 2012: D+5.4 2008: D+6.3
Not yet ingested
- Civics
- —
Market trends
- HPI YoY
- ▼ -242.29%
- Current HPI
- 310.1013
- Rent YoY
- ▼ -3.48%
- Metro
- Riverside-San Bernardino-Ontario, CA
- State GDP YoY
- ▲ 3.21%
- F500 in state
- 116
Industry mix (Fortune 500 HQ in CA)
| Industry | F500 HQs | Revenue |
|---|---|---|
| Technology | 27 | $1,492B |
|
||
| Financial Services | 3 | $174B |
|
||
| Retail | 3 | $44B |
|
||
| Insurance | 3 | $26B |
|
||
| Media / Entertainment | 2 | $115B |
|
||
| Pharmaceuticals / Biotech | 2 | $62B |
|
||
Price history
1 event — show timeline
- 2026-06-09 Listed $99,000 CRMLS
Cash-flow waterfall
monthlySold comps — $/sqft
last 12 mo · ≤1 miLoading sold comps…