1321 Lily Dr · Richburg, SC
Flood risk 1/10 · Minimal
- FEMA flood zone
- X (unshaded)
- Chance of flooding over 30 yrs
- 0.0%
- Est. flood insurance / yr
- $507 – $1,088
Fire risk 3/10 · Minor
- Est. fire insurance / yr
- $783 – $1,453
Heat risk 6/10 · Moderate
- Hot days now (above 105°F)
- 7 days/yr
- Hot days in 30 yrs
- 16 days/yr
Wind risk 6/10 · Moderate
- Chance of severe wind over 30 yrs
- 27.0%
Air-quality risk 3/10 · Minor
- Unhealthy air days now
- 2 days/yr
- Unhealthy air days in 30 yrs
- 2 days/yr
Risk factors via First Street. Map © Google.
Why this score? — see what drove the C grade
The composite is a weighted blend of 9 inputs, each scored 0–100. Each bar is that input's sub-score; the figure is the points it added to the 100-point composite (weight × sub-score).
- Cash flow +17.3/30.0
- ARV discount +8.8/15.0
- Appreciation +6.5/10.0
- DSCR +5.4/10.0
- 1% rule +5.1/10.0
- Condition / age +4.8/5.0
- Livability +3.2/5.0
- Rent growth +2.5/5.0
- Schools +2.3/10.0
$279,000
🖨 Deal sheet (PDF) 📄 Offer letter ✓ Due diligence
Listing remarks
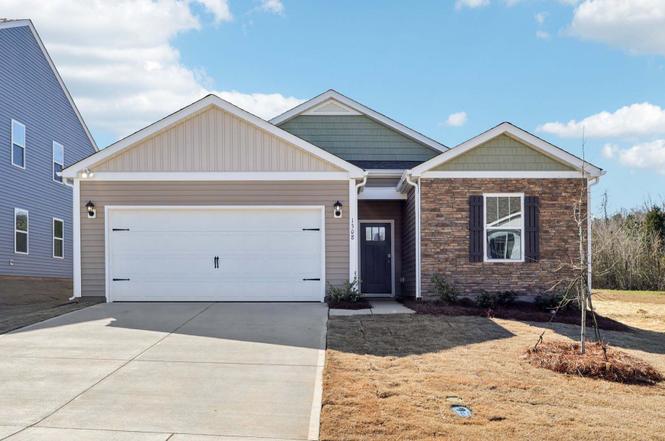
Stanton is an exciting NEW community in Richburg, SC offering a blend of county living and urban convenience. With Luxury amenities, residents can enjoy a high standard of living while having a variety of floor plans to choose from, including single story options. Stanton’s proximity to 1-77 makes commuting to Rock Hill and Charlotte a breeze, allowing for easy access to city excitement while still enjoying the tranquility of suburban lifestyle. Come see 1308 Lily Drive in Richburg, South Carolina. The Macon is one of our ranch plans featured at Stanton in Richburg, SC. This ranch home offers three bedrooms, two bathrooms, and a two-car garage with 1,343 square feet. The moment you st
Key facts
- Luxury amenities
- Open concept
- Chef’s kitchen
Tags
Property features AI
Finance
- Other: Architectural review restrictions
- HOA & community: Mandatory HOA with quarterly fee of $300 (estimated $1,200 annually); Community amenities: outdoor pool, cabana, playground, sidewalks, street lights, pond; Pets allowed
Exterior
- Parking: Attached garage with garage door opener (garage faces front); 2-car garage
- Security: Smoke detector(s); Carbon monoxide detector(s)
- Utilities: City water; Public sewer; Cable available; Underground power and utilities; Wired internet available
- Home design: Single family residence; One level; Site built; Under construction (proposed completion May 11, 2026); New construction; Brick partial and fiber cement exterior; Fiberglass roof; Slab foundation; Builder: D.R. Horton (Model: Macon K)
- Construction: Site built construction; Brick partial and fiber cement materials; Fiberglass roof; Slab foundation; Built by D.R. Horton
- Exterior features: Concrete and paved roads; Private maintained road; Community pond
Interior
- Kitchen: Dishwasher; Disposal; Electric oven; Microwave; Plumbed for ice maker; Kitchen island
- Bedrooms: 3 bedrooms (all on the main level)
- Flooring: Carpet; Vinyl
- Bathrooms: 2 full bathrooms (main level)
- Heating & cooling: Electric heating; Zoned heating; Central air conditioning; Dual and zoned cooling
- Interior features: Open floorplan; Kitchen island; Pantry; Walk-in closet(s); 7 rooms total; Electric fireplace in family room; Smoke and carbon monoxide detectors
- Laundry & utility: Laundry room on upper level; Electric dryer hookup; Electric water heater
Neighborhood map
What this means for you Summary
Snapshot
- This is a 3-bed/2.0-bath single-family listed at $279k. Condition is rated excellent.
Deal economics
- At list price, monthly cash flow is $203 ($2k/yr) — positive.
- The deal already cash-flows at list — no discount required.
- Meets the 1% rule at list price ($3k rent vs $279k).
- Recommended offer: $254k (9.0% below list) — sets the bar for market timing.
- Cap rate 7.2% vs local median 5.3% in Richburg — top-decile yield for the area; either an underpriced asset or a hidden risk that comps aren't pricing in. Stress-test before assuming the spread holds.
Location & tenants
- Location reads 63/100 on livability (#182 in SC) — a middle-class / working-renter tenant base. Strengths: cost of living A+, housing A+; Watch: crime D+, health & safety D+, amenities F.
- Chester 01 (rural): math 23% / reading 34% proficiency, ranked #59 of 80 in SC (top 74%) — low school quality limits family demand, transient renter base, plan for 1-2y turnover; 64% free/reduced lunch — lower-income household profile, screen leases tightly.
- Zoned schools: Lewisville Elementary (math 47% / reading 42%, grade F, #226 of 597 statewide, top 40%, 510 students, 100% FRL); Lewisville Middle (math 25% / reading 37%, grade F, #128 of 229 statewide, top 58%, 416 students, 100% FRL); Lewisville High (math 44% / reading 87%, grade B, #83 of 196 statewide, top 43%, 416 students, 100% FRL) — zoned schools average 100% FRL vs 64% district-wide (36 pts higher); higher-poverty schools than district average — tighter screening recommended.
- Zoned-school proficiency averages 47% at this address vs 28% district-wide (+19 pts) — the actual schools serving this property are materially stronger than the Chester 01 average implies; a family-tenant draw the district grade alone would hide.
- Market conditions: 83 active listings in the ZIP; 269 units permitted in Chester County in 2024 (0 in 5+ unit buildings).
Forward outlook
- In year one you build about $10k of equity ($2k loan paydown + $8k appreciation (3.0% local appreciation)).
- Chester County population projected at -24% by 2050 — secular population decline; favor cash flow + early exit over multi-decade hold.
- At projected returns (3.0% appreciation + 3.0% rent growth), your $78k cash investment doubles in ~6 years — after that, you're playing with house money.
- By year 4, paydown + projected appreciation supports a ~$35k cash-out refi (75% LTV) — recoverable capital for the next deal without selling this one.
Negotiation context
- It's been on market 93 days — a 9% lower offer ($254k) is reasonable based on typical stale-listing flexibility.
Risks & watch-outs
- Climate carrying-cost: major wind risk, 27% chance of damaging wind over 30y; extreme-heat days projected 7→16/yr by 2055 (HVAC capex compounding) — expect insurance premiums to compound above CPI over the hold.
Questions for the listing agent
- It's been on market 93 days. Have you received any prior offers? Is the seller open to a 9% concession, seller financing, or rate buy-down credit?
- What does the HOA fee cover, when was the last increase, and are there any pending special assessments or reserve-fund shortfalls?
- Why hasn't it sold? Are there any deal-killer items the seller is aware of (foundation, flood, title, zoning, code violations)?
- Is there a deadline driving the sale (1031 exchange, divorce, estate, relocation)? That informs how much negotiation room exists.
- Schools are D-rated, which usually means shorter tenancies and higher turnover. Who's the typical renter profile here, and what's been the actual vacancy rate?
- Crime grade is D in this area — have there been break-ins, vandalism, or insurance claims at this property in the last 3 years? What carrier currently insures it and at what premium?
- What's the average days-on-market for RENTAL listings here right now (not sales)? A rising rental-DOM trend means longer vacancies and softer asking-rent achievability than the comps imply.
- What's the recent tenant-quality profile in this submarket — average credit score on applications, eviction rate, late-payment / NSF rate, and stable-employment percentage? A property-management company in the area should have these aggregated.
- How much new for-sale + rental construction is in the pipeline within 1–3 miles? Heavy new supply typically softens prices + rents 12–24 months out; constrained supply supports both.
Investment metrics
- 1% rule
- 1.01% ✓
- Cap rate
- 7.16%
- Cash-on-cash
- 3.11%
- DSCR
- 1.14
- GRM
- 8.2
CMA / ARV
- ARV (on-the-fly)
- $287,402
- Comps found
- 12
Show comp detail 12 sales within ~0.75 mi
| Address | Dist | Beds/Ba | Sqft | Sold | Price | $/sf | Match |
|---|---|---|---|---|---|---|---|
| 1231 Lavender Dr | 0.06mi | 3/2.0 | 1,343 (0%) | 3mo | $288,000 | $214 | 95 |
| 1236 Lavender Dr | 0.02mi | 3/2.0 | 1,497 (+12%) | 1mo | $295,000 | $197 | 79 |
| 620 Lamorak Pl | 0.59mi | 3/2.0 | 1,335 (-1%) | 4mo | $270,000 | $202 | 68 |
| 599 Lamorak Pl | 0.63mi | 3/2.0 | 1,341 (-0%) | 5mo | $265,000 | $198 | 66 |
| 703 Lamorak Pl | 0.65mi | 3/2.0 | 1,316 (-2%) | 2mo | $292,900 | $223 | 65 |
| 1111 Elyan St | 0.70mi | 3/2.0 | 1,316 (-2%) | 2mo | $294,900 | $224 | 62 |
| 1116 Elyan St | 0.67mi | 3/2.0 | 1,316 (-2%) | 4mo | $292,900 | $223 | 62 |
| 670 Lamorak Pl | 0.63mi | 3/2.0 | 1,316 (-2%) | 6mo | $262,500 | $199 | 62 |
| 1112 Elyan St | 0.67mi | 3/2.0 | 1,316 (-2%) | 5mo | $289,900 | $220 | 61 |
| 1522 Doran Ter | 0.70mi | 3/2.0 | 1,316 (-2%) | 6mo | $272,900 | $207 | 58 |
| 656 Lancelot Dr | 0.65mi | 3/2.0 | 1,197 (-11%) | 2mo | $265,000 | $221 | 50 |
| 907 Morien St | 0.70mi | 3/2.0 | 1,177 (-12%) | 4mo | $245,000 | $208 | 44 |
Match score weights: distance 35% · size 25% · config 20% · recency 20%. Top-matched comps best support the ARV.
Projected returns pro-forma
2.99% appreciation · 3.0% rent growth · sell at horizon
- IRR
- 10.4%
- Equity multiple
- 1.60×
- Total profit
- $46,526
- Equity at exit
- $125,347
- IRR
- 12.7%
- Equity multiple
- 2.89×
- Total profit
- $147,842
- Equity at exit
- $193,094
Cash invested: $78,120 (down + closing). Projections, not guarantees.
Landlord ↔ Tenant lean methodology
- Overall (STATE)
- 90 Strongly Landlord-Friendly
- State South Carolina
- 90 Strongly Landlord-Friendly · R+6
- County
- — inherits STATE
- City
- — inherits STATE
ZIP-level market 29729
- Home prices YoY
- 1.4%
- Active inventory
- 83
- Price-to-rent
- 8.2×
Monthly cashflow live
- Estimated rent
- $2,824 medium interval (Pro) →
- Mortgage (P&I)
- −$1,463
- Tax est. 1.5%
- −$349 /mo · $4,185/yr
- Insurance
- −$116
- HOA
- −$100
- Vacancy / Maint / Mgmt
- −$593
- Net cashflow
- $203
Break-even live
Sensitivity live
| Price | -10% $395 | -5% $299 | +0% $203 | +5% $106 | +10% $10 |
|---|---|---|---|---|---|
| Rent | -10% $-20 | -5% $91 | +0% $203 | +5% $314 | +10% $426 |
| Rate | -1.0pp $343 | -0.5pp $274 | base $203 | +0.5pp $130 | +1.0pp $57 |
UW: 25.0% down · 7.5% · 30yr · 1.5% tax · 5.0% vac · 8.0% maint · 8.0% mgmt
Financing live
Cash to close
- Down payment
- $69,750
- Closing costs
- $8,370
- Reserves months
- —
- Total cash needed
- —
Loan-product check · same deal, 3 products live
Conventional
25% down · 7.5% · 30yr
- Down + closing
- —
- Monthly P&I
- —
- Monthly cashflow
- —
- DSCR
- —
- Eligible?
- —
Personal DTI + credit; lowest rate.
DSCR
20% down · 8.5% · 30yr
- Down + closing
- —
- Monthly P&I
- —
- Monthly cashflow
- —
- DSCR
- —
- Eligible?
- —
No personal income docs; deal must DSCR.
Hard money
10% down · 12.0% · 12mo
- Down + closing
- —
- Monthly P&I
- —
- Monthly cashflow
- —
- DSCR
- —
- Eligible?
- —
Short-term bridge; refi at stabilization.
HOA detail
- Monthly dues
- $100 · $1,200/yr
Listing history 21 events
-
2026-06-21days on market $279,000 Active 93 DOM
-
2026-06-18days on market $279,000 Active 90 DOM
-
2026-06-17days on market $279,000 Active 89 DOM
-
2026-06-16days on market $279,000 Active 88 DOM
-
2026-06-15days on market $279,000 Active 87 DOM
-
2026-06-13days on market $279,000 Active 85 DOM
-
2026-06-10price $279,000 Active 81 DOM
-
2026-06-09days on market $279,999 Active 81 DOM
-
2026-06-08days on market $279,999 Active 80 DOM
-
2026-06-07days on market $279,999 Active 79 DOM
-
2026-06-04days on market $279,999 Active 76 DOM
-
2026-06-03days on market $279,999 Active 75 DOM
-
2026-06-02days on market $279,999 Active 74 DOM
-
2026-06-01days on market $279,999 Active 73 DOM
-
2026-05-31days on market $279,999 Active 72 DOM
-
2026-05-19status Pending
-
2026-05-12price $279,999
-
2026-04-21price $287,625
-
2026-04-14price $291,625
-
2026-03-24price $295,000
-
2026-03-10$301,990 Active
ⓘ Source: listings_history table (triggers on properties + properties_extension) + one-shot
backfill from property_details.listing_events for pre-trigger history.
Climate risk First Street
- Flood 1/10 Low FEMA zone X (unshaded) · 0% chance over 30 yrs
- Wildfire 3/10 Moderate
- Heat 6/10 Major 7 d/yr ≥105°F today · 16 d/yr by 30 yrs out
- Wind 6/10 Major 27% chance of damaging wind over 30 yrs
- Air quality 3/10 Moderate 2 unhealthy d/yr today · 2 by 30 yrs out
Nearby sold comps map
Loading sold comps map…
Walkable amenities ~0.75 mi
Loading nearby amenities…
Taxation est. · year 1
- Rental income
- $33,885
- − Mortgage interest
- −$15,628
- − Property taxes
- −$4,185
- − Insurance
- −$1,395
- − Repairs & maintenance
- −$2,711
- − Management
- −$2,711
- − HOA
- −$1,200
- − Depreciation
- −$8,116
- Taxable loss
- −$2,061
- Est. tax savings @ 24.0%
- +$495
- After-tax cash flow
- $2,927/yr
For passive investors: Depreciation is non-cash, so a rental often shows a tax loss while cash-flowing — sheltering income. Rental losses are passive: they offset passive income freely, and up to $25,000/yr can offset ordinary (W-2) income if you actively participate and your MAGI is under $100k (phasing out to $0 by $150k); unused losses carry forward. On sale, claimed depreciation is recaptured at up to 25%, and gains may owe capital-gains tax (a 1031 exchange can defer both). Figures are a year-1 estimate at your 24.0% rate — not tax advice; consult a CPA.
Condition & rehab AI · 13 photos
This new construction home in Stanton, Richburg, SC is move-in ready with excellent condition and modern finishes. It offers a great value for both buyers and renters with potential for further upgrades to enhance its appeal.
Value-add opportunities
- Both Painting exterior and interior walls — Fresh paint enhances curb appeal and interior aesthetics.
- Both Landscaping and adding outdoor furniture — Enhances curb appeal and provides a welcoming outdoor space.
- Resale Upgrading kitchen appliances — Modern appliances improve the home's appeal to potential buyers.
- Both Adding smart home features — Enhances convenience and adds value to the home for both buyers and renters.
- Both Upgrading lighting fixtures — Modern lighting fixtures improve the home's ambiance and add value for both buyers and renters.
Renovation cost estimate screening
Value-add ROI direction
- Both Painting exterior and interior walls — Fresh paint enhances curb appeal and interior aesthetics. ↑
- Both Landscaping and adding outdoor furniture — Enhances curb appeal and provides a welcoming outdoor space. ↑
- Resale Upgrading kitchen appliances — Modern appliances improve the home's appeal to potential buyers. ↑
- Both Adding smart home features — Enhances convenience and adds value to the home for both buyers and renters. ↑
- Both Upgrading lighting fixtures — Modern lighting fixtures improve the home's ambiance and add value for both buyers and renters. ↑
ⓘ Cost ranges are severity-bucket heuristics (US national rule-of-thumb). Get contractor quotes + a written scope before underwriting a rehab budget.
Schools (NCES district)
- District
- Chester 01
- NCES district ID
- 4501530
- Math proficiency
- 23% ▼ -6.00%
- Reading proficiency
- 34% ▬ 0.00%
- Median HH income
- $34,041
- Composite
- 23.39/100
- National rank
- #7902
- State rank
- #59 of 80 in SC
Livability — Richburg
- Score
- 63/100
- State rank
- #182
- US rank
- #15927
Category grades
Schools grade is shown separately in the Schools card above.
Census & demographics
- Population (ZIP)
- 2,313
Population outlook (Chester County) Hauer SSP2
- Today (2025)
- 30,121 people
- By 2030
- 28,700 · -4.7%
- By 2040
- 25,784 · -14.4%
- By 2050
- 23,001 · -23.6%
- By 2075
- 17,770 · -41.0%
- By 2100
- 13,584 · -54.9%
Race, ethnicity, and origin ACS 2023
- Neighborhood character
- Diverse neighborhood (Simpson 0.57)
- Race & ethnicity
- White 60% Black 26% Two or more races 12% Hispanic / Latino 7%
- Hispanic origin (detail)
- Mexican 2% Puerto Rican 5%
- Common ancestry
- Danish 2% Serbian 2% Lithuanian 2%
- Foreign-born
- 2% · Canada, Guatemala
- Languages at home
- 99% English-only · Spanish 1%
Political lean MEDSL · Chester
- 2024 margin
- R (+17.2) · D 40.8% · R 58.0% · Other 1.1%
- 2008→2024 swing
- -25.5pp toward R · 2008: 8.3pp · 2024: -17.2pp
- All cycles
- 2024: R+17.2 2020: R+10.9 2016: R+4.8 2012: D+10.5 2008: D+8.3
Not yet ingested
- Civics
- —
Market trends
- HPI YoY
- ▲ 2.99%
- Current HPI
- 210.6518
- Rent YoY
- —
- Metro
- —
- State GDP YoY
- ▲ 4.51%
- F500 in state
- 2
Industry mix (Fortune 500 HQ in SC)
| Industry | F500 HQs | Revenue |
|---|---|---|
| Packaging | 1 | $7B |
|
||
Price history
-7.3% since first listed6 events — show timeline
- 2026-05-19 Pending — CANOPYMLS as Distributed by MLS Grid
- 2026-05-12 Price Changed $279,999 CANOPYMLS as Distributed by MLS Grid
- 2026-04-21 Price Changed $287,625 CANOPYMLS as Distributed by MLS Grid
- 2026-04-14 Price Changed $291,625 CANOPYMLS as Distributed by MLS Grid
- 2026-03-24 Price Changed $295,000 CANOPYMLS as Distributed by MLS Grid
- 2026-03-10 Listed $301,990 CANOPYMLS as Distributed by MLS Grid
Cash-flow waterfall
monthlySold comps — $/sqft
last 12 mo · ≤1 miLoading sold comps…