3054 La Quinta Dr · Missouri City, TX
Flood risk 1/10 · Minimal
- FEMA flood zone
- X (unshaded)
- Chance of flooding over 30 yrs
- 0.0%
- Est. flood insurance / yr
- $507 – $1,088
Fire risk 1/10 · Minimal
- Est. fire insurance / yr
- $1,222 – $2,270
Heat risk 9/10 · Severe
- Hot days now (above 110°F)
- 7 days/yr
- Hot days in 30 yrs
- 23 days/yr
Wind risk 9/10 · Severe
- Chance of severe wind over 30 yrs
- 99.0%
Air-quality risk 3/10 · Minor
- Unhealthy air days now
- 2 days/yr
- Unhealthy air days in 30 yrs
- 3 days/yr
Risk factors via First Street. Map © Google.
Why this score? — see what drove the D grade
The composite is a weighted blend of 9 inputs, each scored 0–100. Each bar is that input's sub-score; the figure is the points it added to the 100-point composite (weight × sub-score).
- ARV discount +14.3/15.0
- Cash flow +6.8/30.0
- Schools +4.5/10.0
- Appreciation +4.2/10.0
- Livability +3.4/5.0
- 1% rule +2.8/10.0
- Rent growth +2.5/5.0
- Condition / age +2.5/5.0
- DSCR +1.0/10.0
$350,000
🖨 Deal sheet 📄 Offer letter ✓ Due diligence
Listing remarks MLS
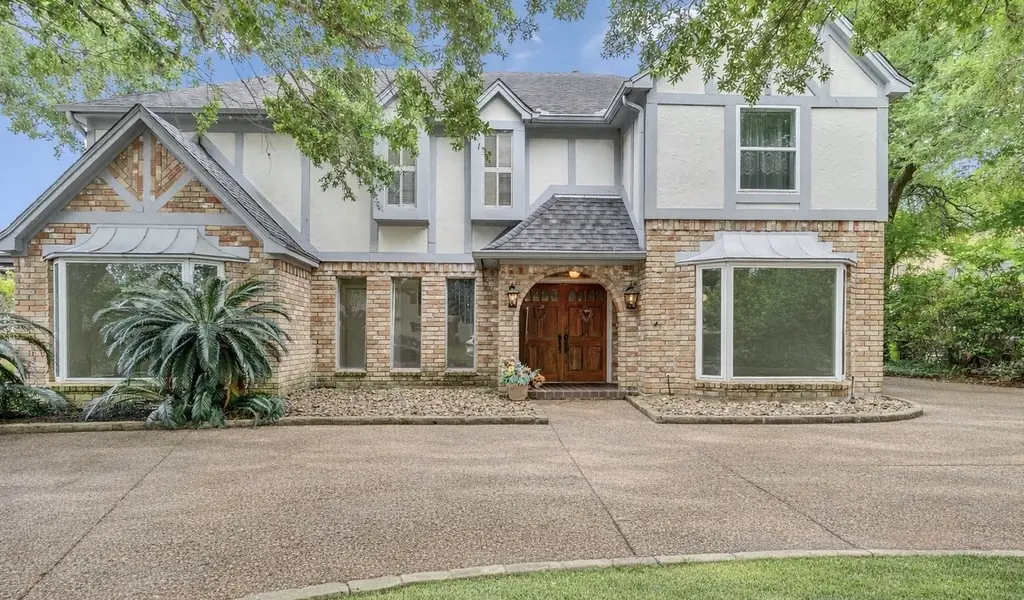
Welcome to this beautiful golf course home in the desirable Quail Valley community, perfectly set on a large lot with scenic views. Featuring 4 bedrooms and 3 full baths, this layout is ideal for everyday living and entertaining. Enjoy a formal dining and living room, plus a large family room with a gas log fireplace, built-ins, and two wet bars. The island kitchen offers double ovens, cooktop, and dishwasher for functionality and convenience. Upstairs, find a game room with balcony access, additional bedrooms, and a primary suite with its own balcony, perfect for taking in golf course views. The spacious backyard offers ample green space, ideal for entertaining or adding a future pool. A two-car garage and dedicated golf cart garage enhance the golf course lifestyle. Homes like this are rare schedule your private showing today!
Key facts
- Large family room
- Formal dining room
- Island kitchen
Tags
Neighborhood map
What this means for you Summary
Snapshot
- This is a 4-bed/4.0-bath single-family listed at $350k.
Deal economics
- At list price, monthly cash flow is $-549 ($-7k/yr) — negative.
- To cash-flow at today's rent, offer at most $253k (27.7% below list).
- To meet the 1% rule (rent ≥ 1% of price), the offer needs to be $273k (22.0% below list).
- Recommended offer: $253k (27.7% below list) — sets the bar for cash-flow.
- Cap rate 4.4% vs local median 3.5% in Missouri City — meaningfully above typical; check what's discounted (condition, days-on-market, listing class) to confirm the premium yield is real.
Location & tenants
- Location reads 67/100 on livability (#526 in TX) — a middle-class / working-renter tenant base. Strengths: housing A+, crime A, employment A; Watch: amenities F, commute F, health & safety F.
- Fort Bend ISD (suburban): math 44% / reading 53% proficiency, ranked #140 of 826 in TX (top 17%) — families likely to look elsewhere, expect single-tenant / working-renter base with shorter leases.
- Market conditions: Rents soft (-0.1%/yr); 1215 active listings in the ZIP; 6 comparable units currently listed for rent nearby; rentals at typical pace (median 22d on market — plan ~3-4 weeks tenant-placement turnaround); high-income renter base; 12,093 units permitted in Fort Bend County in 2024 (815 in 5+ unit buildings).
Forward outlook
- Local home prices are declining (-1.7%/yr); year-one equity from $2k of loan paydown is wiped out by about $6k of value loss. Plan a longer hold.
- Fort Bend County population projected at +75% by 2050 — long-run rental-demand tailwind backs the buy-and-hold thesis.
Negotiation context
- It's been on market 30 days — a 2% lower offer ($345k) is reasonable based on typical stale-listing flexibility.
- 2 sale attempts since 24y ago with the ask held roughly flat each time — persistent listings suggest the price (not the market) is what's stuck; bring a comps-based counter.
Risks & watch-outs
- Climate carrying-cost: severe wind risk, 99% chance of damaging wind over 30y; extreme-heat days projected 7→23/yr by 2055 (HVAC capex compounding) — expect insurance premiums to compound above CPI over the hold.
Questions for the listing agent
- What do current leases actually rent for vs. the listed asking? Can we see a recent rent roll and the last 12 months of T-12 income?
- Built in 1973 — when were the roof, HVAC, electrical panel, plumbing, and water heater last replaced?
- What does the HOA fee cover, when was the last increase, and are there any pending special assessments or reserve-fund shortfalls?
- Is there a deadline driving the sale (1031 exchange, divorce, estate, relocation)? That informs how much negotiation room exists.
- Schools are B-rated — typically a magnet for longer-tenancy family renters. What's the average tenant stay here, and is there a school-zone premium baked into asking?
- The area grade is low — what's the realistic commute time and amenity access for the typical tenant pool here? Any planned neighborhood developments (good or bad) we should know about?
- What's the average days-on-market for RENTAL listings here right now (not sales)? A rising rental-DOM trend means longer vacancies and softer asking-rent achievability than the comps imply.
- What's the recent tenant-quality profile in this submarket — average credit score on applications, eviction rate, late-payment / NSF rate, and stable-employment percentage? A property-management company in the area should have these aggregated.
- How much new for-sale + rental construction is in the pipeline within 1–3 miles? Heavy new supply typically softens prices + rents 12–24 months out; constrained supply supports both.
Investment metrics
- 1% rule
- 0.78% ✗
- Cap rate
- 4.41%
- Cash-on-cash
- -6.72%
- DSCR
- 0.70
- GRM
- 10.7
CMA / ARV
- ARV (median comp)
- $412,584
- List price
- $350,000
- Delta
- -15.17%
- Verdict
- UNDERPRICED
- Comps
- 20 within 1.0 mi
Show comp detail 12 sales within ~0.75 mi
| Address | Dist | Beds/Ba | Sqft | Sold | Price | $/sf | Match |
|---|---|---|---|---|---|---|---|
| 3159 Bonney Briar Dr | 0.18mi | 4/3.5 | 3,583 (+4%) | 5mo | $425,000 | $119 | 79 |
| 3227 Robinson Rd | 0.22mi | 4/3.5 | 3,582 (+4%) | 9mo | $415,000 | $116 | 73 |
| 3147 Robinson Rd | 0.11mi | 4/3.0 | 3,824 (+11%) | 3mo | $695,000 | $182 | 70 |
| 2902 Blue Lakes Ln | 0.48mi | 4/3.5 | 3,313 (-4%) | 5mo | $420,000 | $127 | 66 |
| 3322 Robinson Road Rd | 0.28mi | 4/3.0 | 3,029 (-12%) | 2mo | $549,900 | $182 | 61 |
| 3075 Tam Oshanter Ln | 0.10mi | 5/3.5 (+1) | 3,810 (+11%) | 12mo | $524,989 | $138 | 60 |
| 3106 El Dorado Blvd | 0.44mi | 5/3.5 (+1) | 3,720 (+8%) | 4mo | $440,000 | $118 | 55 |
| 3514 E Creek Club Dr | 0.54mi | 4/3.0 | 3,323 (-3%) | 13mo | $439,000 | $132 | 54 |
| 3827 Kiamesha Dr | 0.73mi | 4/3.5 | 3,219 (-6%) | 12mo | $349,900 | $109 | 44 |
| 3823 Kiamesha Dr | 0.71mi | 4/2.5 | 3,179 (-8%) | 12mo | $254,900 | $80 | 38 |
| 3826 Pecan Valley Dr | 0.74mi | 4/2.5 | 3,100 (-10%) | 13mo | $384,990 | $124 | 32 |
| 3226 El Dorado Blvd S | 0.56mi | 3/2.5 (-1) | 2,992 (-13%) | 13mo | $396,000 | $132 | 31 |
Match score weights: distance 35% · size 25% · config 20% · recency 20%. Top-matched comps best support the ARV.
Projected returns pro-forma
-1.67% appreciation · 0.0% rent growth · sell at horizon
- IRR
- -21.0%
- Equity multiple
- 0.19×
- Total profit
- $-79,489
- Equity at exit
- $73,405
- IRR
- -19.0%
- Equity multiple
- -0.29×
- Total profit
- $-126,135
- Equity at exit
- $67,991
Cash invested: $98,000 (down + closing). Projections, not guarantees.
Landlord ↔ Tenant lean methodology
- Overall (STATE)
- 87 Strongly Landlord-Friendly
- State Texas
- 87 Strongly Landlord-Friendly · R+5
- County
- — inherits STATE
- City
- — inherits STATE
ZIP-level market 77459
- Home prices YoY
- -0.8%
- Rents YoY
- -0.1%
- Active inventory
- 1215
- Price-to-rent
- 10.7×
Monthly cashflow live
- Estimated rent
- $2,729 high interval (Pro) →
- Mortgage (P&I)
- −$1,835
- Tax from tax record
- −$685 /mo · $8,219/yr
- Insurance
- −$146
- HOA
- −$38
- Vacancy / Maint / Mgmt
- −$573
- Net cashflow
- $-549
Break-even live
UW: 25.0% down · 7.5% · 30yr · 1.5% tax · 5.0% vac · 8.0% maint · 8.0% mgmt
Financing live
Cash to close
- Down payment
- $87,500
- Closing costs
- $10,500
- Reserves months
- —
- Total cash needed
- —
Loan-product check · same deal, 3 products live
Conventional
25% down · 7.5% · 30yr
- Down + closing
- —
- Monthly P&I
- —
- Monthly cashflow
- —
- DSCR
- —
- Eligible?
- —
Personal DTI + credit; lowest rate.
DSCR
20% down · 8.5% · 30yr
- Down + closing
- —
- Monthly P&I
- —
- Monthly cashflow
- —
- DSCR
- —
- Eligible?
- —
No personal income docs; deal must DSCR.
Hard money
10% down · 12.0% · 12mo
- Down + closing
- —
- Monthly P&I
- —
- Monthly cashflow
- —
- DSCR
- —
- Eligible?
- —
Short-term bridge; refi at stabilization.
Rent comps 6 comps
| Address | Beds | Baths | Sqft | Rent | $/sqft | DOM | Units | Dist |
|---|---|---|---|---|---|---|---|---|
| 2307 Hilton Head Dr Missouri City, TX | 4.0 | 2.0 | 2606 | $2,239 | $0.86 | 17d | 1 | 0.54mi |
| 3907 Kiamesha Dr Missouri City, TX | 4.0 | 2.5 | 2896 | $2,750 | $0.95 | 17d | 1 | 0.74mi |
| 2010 Quail Valley East Dr Missouri City, TX | 5.0 | 3.0 | 2651 | $2,695 | $1.02 | 43d | 1 | 0.84mi |
| 3512 Talia Wood Ct Missouri City, TX | 4.0 | 3.5 | 2950 | $2,900 | $0.98 | 10d | 1 | 0.90mi |
| 4039 Mission Valley Dr Missouri City, TX | 4.0 | 2.5 | 2364 | $2,495 | $1.06 | 22d | 1 | 1.22mi |
| 2910 Fawn Ct Missouri City, TX | 4.0 | 2.5 | 2330 | $2,220 | $0.95 | 43d | 1 | 1.46mi |
HOA detail
- Monthly dues
- $38 · $456/yr
- Likely covers
- gaspool
Listing history 7 events
-
2026-05-08status Pending 849-char remark
Show marketing remark (849 chars)
Welcome to this beautiful golf course home in the desirable Quail Valley community, perfectly set on a large lot with scenic views. Featuring 4 bedrooms and 3 full baths, this layout is ideal for everyday living and entertaining. Enjoy a formal dining and living room, plus a large family room with a gas log fireplace, built-ins, and two wet bars. The island kitchen offers double ovens, cooktop, and dishwasher for functionality and convenience. Upstairs, find a game room with balcony access, additional bedrooms, and a primary suite with its own balcony, perfect for taking in golf course views. The spacious backyard offers ample green space, ideal for entertaining or adding a future pool. A two-car garage and dedicated golf cart garage enhance the golf course lifestyle. Homes like this are rare schedule your private showing today!
-
2026-04-07$350,000 Active 849-char remark
Show marketing remark (849 chars)
Welcome to this beautiful golf course home in the desirable Quail Valley community, perfectly set on a large lot with scenic views. Featuring 4 bedrooms and 3 full baths, this layout is ideal for everyday living and entertaining. Enjoy a formal dining and living room, plus a large family room with a gas log fireplace, built-ins, and two wet bars. The island kitchen offers double ovens, cooktop, and dishwasher for functionality and convenience. Upstairs, find a game room with balcony access, additional bedrooms, and a primary suite with its own balcony, perfect for taking in golf course views. The spacious backyard offers ample green space, ideal for entertaining or adding a future pool. A two-car garage and dedicated golf cart garage enhance the golf course lifestyle. Homes like this are rare schedule your private showing today!
-
2003-08-06soldstatus
-
2003-08-06soldstatus
-
2003-06-15historical
-
2002-11-12$180,000
-
1997-10-27soldstatus
ⓘ Source: listings_history table (triggers on properties + properties_extension) + one-shot
backfill from property_details.listing_events for pre-trigger history.
Tax reassessment forecast TX · Resets to sale price
- Current annual tax
- $8,219 · $685/mo
- Projected year-2 tax
- $8,219 · $685/mo
- Expected delta
- $0/yr ($0/mo · 0.0%)
ⓘ Screening estimate from a state-policy table — verify with the county assessor before closing.
Climate risk First Street
- Flood 1/10 Low FEMA zone X (unshaded) · 0% chance over 30 yrs
- Wildfire 1/10 Low
- Heat 9/10 Extreme 7 d/yr ≥110°F today · 23 d/yr by 30 yrs out
- Wind 9/10 Extreme 99% chance of damaging wind over 30 yrs
- Air quality 3/10 Moderate 2 unhealthy d/yr today · 3 by 30 yrs out
Nearby sold comps map
Loading sold comps map…
Walkable amenities ~0.75 mi
Loading nearby amenities…
Taxation est. · year 1
- Rental income
- $32,744
- − Mortgage interest
- −$19,605
- − Property taxes
- −$8,219
- − Insurance
- −$1,750
- − Repairs & maintenance
- −$2,619
- − Management
- −$2,619
- − HOA
- −$456
- − Depreciation
- −$10,182
- Taxable loss
- −$12,708
- Est. tax savings @ 24.0%
- +$3,050
- After-tax cash flow
- $-3,533/yr
For passive investors: Depreciation is non-cash, so a rental often shows a tax loss while cash-flowing — sheltering income. Rental losses are passive: they offset passive income freely, and up to $25,000/yr can offset ordinary (W-2) income if you actively participate and your MAGI is under $100k (phasing out to $0 by $150k); unused losses carry forward. On sale, claimed depreciation is recaptured at up to 25%, and gains may owe capital-gains tax (a 1031 exchange can defer both). Figures are a year-1 estimate at your 24.0% rate — not tax advice; consult a CPA.
Schools (NCES district)
- District
- Fort Bend ISD
- NCES district ID
- 4819650
- Math proficiency
- 44% ▼ -15.00%
- Reading proficiency
- 53% ▼ -4.00%
- Median HH income
- $82,360
- Composite
- 44.61/100
- National rank
- #2779
- State rank
- #140 of 826 in TX
Livability — Missouri City
- Score
- 67/100
- State rank
- #526
- US rank
- #10308
Category grades
Schools grade is shown separately in the Schools card above.
Census & demographics
- Census place
- Missouri City, TX
- County
- Fort Bend County · 836,777 people
- City population
- 123,513
- Metro
- Houston-The Woodlands-Sugar Land, TX
- Population (ZIP)
- 84,221
- Household income
- $129,151
- Rent vs Own
- Severe rent burden
- 1004.0
Population outlook (Fort Bend County) Hauer SSP2
- Today (2025)
- 1,004,526 people
- By 2030
- 1,153,104 · +14.8%
- By 2040
- 1,453,718 · +44.7%
- By 2050
- 1,753,781 · +74.6%
- By 2075
- 2,455,772 · +144.5%
- By 2100
- 2,930,528 · +191.7%
Race, ethnicity, and origin ACS 2023
- Neighborhood character
- Highly diverse neighborhood (Simpson 0.75)
- Race & ethnicity
- White 34% Black 26% Asian 22% Hispanic / Latino 13% Two or more races 10%
- Hispanic origin (detail)
- Mexican 7%
- Common ancestry
- Lithuanian 2% Slovak 1% Italian 1%
- Foreign-born
- 21% · Canada, China, Vietnam
- Languages at home
- 73% English-only · Other Asian/Pacific 8% Spanish 7% Other Indo-European 5%
Political lean MEDSL · Fort Bend
- 2024 margin
- Toss-up / Even · D 49.5% · R 47.9% · Other 2.6%
- 2008→2024 swing
- +4.0pp toward D · 2008: -2.4pp · 2024: 1.6pp
- All cycles
- 2024: D+1.6 2020: D+10.6 2016: D+6.6 2012: R+6.8 2008: R+2.4
Not yet ingested
- Civics
- —
Market trends
- HPI YoY
- ▼ -1.67%
- Current HPI
- 212.3573
- Rent YoY
- ▼ -0.15%
- Metro
- Houston-The Woodlands-Sugar Land, TX
- State GDP YoY
- ▲ 3.95%
- F500 in state
- 110
Industry mix (Fortune 500 HQ in TX)
| Industry | F500 HQs | Revenue |
|---|---|---|
| Energy | 16 | $1,198B |
|
||
| Technology | 5 | $198B |
|
||
| Engineering / Construction | 4 | $72B |
|
||
| Energy Services | 3 | $60B |
|
||
| Utilities | 3 | $41B |
|
||
| Healthcare | 2 | $330B |
|
||
Price history
+94.4% since first listed7 events — show timeline
- 2026-05-08 Pending — HARMLS
- 2026-04-07 Listed $350,000 HARMLS
- 2003-08-06 Sold (Public Records) — Public Records
- 2003-08-06 Sold (Public Records) — Public Records
- 2003-06-15 Listing Removed — HARMLS
- 2002-11-12 Listed $180,000 HARMLS
- 1997-10-27 Sold (Public Records) — Public Records
Property tax history
+3.0%/yrLatest (2025): $8,219 · -10.9% YoY. Source: county tax records.
Cash-flow waterfall
monthlySold comps — $/sqft
last 12 mo · ≤1 miLoading sold comps…