1021 Molly Barr Dr #98 Rd · Oxford, MS
Flood risk No data
- FEMA flood zone
- —
- Chance of flooding over 30 yrs
- —
- Est. flood insurance / yr
- —
Fire risk No data
- Est. fire insurance / yr
- —
Heat risk No data
- Hot days now (above threshold)
- —
- Hot days in 30 yrs
- —
Wind risk No data
- Chance of severe wind over 30 yrs
- —
Air-quality risk No data
- Unhealthy air days now
- —
- Unhealthy air days in 30 yrs
- —
Risk factors via First Street. Map © Google.
Why this score? — see what drove the D- grade
The composite is a weighted blend of 9 inputs, each scored 0–100. Each bar is that input's sub-score; the figure is the points it added to the 100-point composite (weight × sub-score).
- Cash flow +10.5/30.0
- ARV discount +7.5/15.0
- Livability +4.4/5.0
- Schools +4.3/10.0
- Rent growth +3.7/5.0
- 1% rule +3.1/10.0
- DSCR +3.0/10.0
- Condition / age +2.5/5.0
- Appreciation +0.0/10.0
$322,000
🖨 Deal sheet 📄 Offer letter ✓ Due diligence
Listing remarks MLS
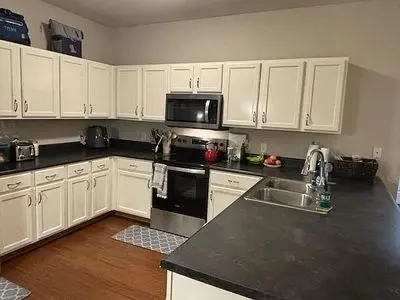
Whether you're looking for a game-day getaway, a weekend retreat, or an investment property in one of Oxford's most popular condo developments, The Bluffs West checks all the boxes. Featuring a functional floor plan with two spacious bedrooms and two full baths, this condo offers comfortable living with access to outstanding community amenities. Enjoy easy access to Ole Miss, the Oxford Square, and the walking trail right outside your door. Amenities include a swimming pool, fitness center, and direct access to Oxford's walking and biking trail system. Less than a mile from Ole Miss! Call your agent to see today.
Key facts
- Fitness center
- Community amenities
- Pool
Tags
Property features AI
Finance
- Other: Located in The Bluffs West subdivision
Exterior
- Utilities: Public water; Public sewer
- Home design: Residential townhouse; Townhouse/Condo
- Construction: Brick construction; Slab foundation
- Exterior features: Porch; In-ground pool; Subdivision covenant zoning
Interior
- Kitchen: Microwave; Dishwasher; Garbage disposal; Electric range; Refrigerator
- Flooring: Ceramic tile
- Bathrooms: 2 full bathrooms
- Heating & cooling: Central air conditioning; Ceiling fan(s)
- Interior features: Microwave; Dishwasher; Garbage disposal; Electric range; Refrigerator; Electric water heater; Ceramic tile flooring; Ceiling fan(s)
- Laundry & utility: Washer; Dryer
Neighborhood map
What this means for you Summary
Snapshot
- This is a 2-bed/2.0-bath townhouse listed at $322k.
Deal economics
- At list price, monthly cash flow is $-166 ($-2k/yr) — negative.
- To cash-flow at today's rent, offer at most $298k (7.5% below list).
- To meet the 1% rule (rent ≥ 1% of price), the offer needs to be $261k (19.1% below list).
- Recommended offer: $261k (19.1% below list) — sets the bar for 1% rule.
- Cap rate 5.7% vs local median 2.8% in Oxford — top-decile yield for the area; either an underpriced asset or a hidden risk that comps aren't pricing in. Stress-test before assuming the spread holds.
Location & tenants
- Location reads 87/100 on livability (#1 in MS, #285 nationally) — a professional / high-income tenant draw. Strengths: amenities A+, commute A+, health & safety A+; Watch: employment C-.
- Oxford School District (town): math 53% / reading 49% proficiency, ranked #12 of 130 in MS (top 9%) — acceptable for families but not a draw, mixed tenant base, ~2y average lease.
- Market conditions: Rents rising fast (+4.8%/yr); 855 active listings in the ZIP; 4 comparable units currently listed for rent nearby; rentals at typical pace (median 24d on market — plan ~3-4 weeks tenant-placement turnaround); 503 units permitted in Lafayette County in 2024 (0 in 5+ unit buildings).
- At $2,606/mo this rent would consume 46% of the median local household income ($68k/yr) (locally 1892% of renters already pay >50% of income on rent) — very limited rent-growth headroom before tenants either downsize or default.
Forward outlook
- Local home prices are declining (-3.0%/yr); year-one equity from $2k of loan paydown is wiped out by about $10k of value loss. Plan a longer hold.
- Lafayette County population projected at +61% by 2050 — long-run rental-demand tailwind backs the buy-and-hold thesis.
Negotiation context
- Only 13 days on market — expect competitive offers; lowballing is unlikely to land.
- 6 sale attempts with the ask held roughly flat each time — persistent listings suggest the price (not the market) is what's stuck; bring a comps-based counter.
Questions for the listing agent
- What do current leases actually rent for vs. the listed asking? Can we see a recent rent roll and the last 12 months of T-12 income?
- Is there a deadline driving the sale (1031 exchange, divorce, estate, relocation)? That informs how much negotiation room exists.
- Schools are B-rated — typically a magnet for longer-tenancy family renters. What's the average tenant stay here, and is there a school-zone premium baked into asking?
- The area grade is low — what's the realistic commute time and amenity access for the typical tenant pool here? Any planned neighborhood developments (good or bad) we should know about?
- What's the average days-on-market for RENTAL listings here right now (not sales)? A rising rental-DOM trend means longer vacancies and softer asking-rent achievability than the comps imply.
- What's the recent tenant-quality profile in this submarket — average credit score on applications, eviction rate, late-payment / NSF rate, and stable-employment percentage? A property-management company in the area should have these aggregated.
- How much new for-sale + rental construction is in the pipeline within 1–3 miles? Heavy new supply typically softens prices + rents 12–24 months out; constrained supply supports both.
Investment metrics
- 1% rule
- 0.81% ✗
- Cap rate
- 5.67%
- Cash-on-cash
- -2.21%
- DSCR
- 0.90
- GRM
- 10.3
CMA / ARV
No comps found within radius.
Projected returns pro-forma
-3.0% appreciation · 4.85% rent growth · sell at horizon
- IRR
- -17.9%
- Equity multiple
- 0.36×
- Total profit
- $-57,781
- Equity at exit
- $48,011
- IRR
- -6.9%
- Equity multiple
- 0.53×
- Total profit
- $-42,726
- Equity at exit
- $27,841
Cash invested: $90,160 (down + closing). Projections, not guarantees.
Landlord ↔ Tenant lean methodology
- Overall (STATE)
- 90 Strongly Landlord-Friendly
- State Mississippi
- 90 Strongly Landlord-Friendly · R+11
- County
- — inherits STATE
- City
- — inherits STATE
ZIP-level market 38655
- Rents YoY
- 4.8%
- Active inventory
- 855
- Price-to-rent
- 10.3×
Monthly cashflow live
- Estimated rent
- $2,606 medium interval (Pro) →
- Mortgage (P&I)
- −$1,689
- Tax est. 1.5%
- −$402 /mo · $4,830/yr
- Insurance
- −$134
- HOA
- −$0
- Vacancy / Maint / Mgmt
- −$547
- Net cashflow
- $-166
Break-even live
UW: 25.0% down · 7.5% · 30yr · 1.5% tax · 5.0% vac · 8.0% maint · 8.0% mgmt
Financing live
Cash to close
- Down payment
- $80,500
- Closing costs
- $9,660
- Reserves months
- —
- Total cash needed
- —
Loan-product check · same deal, 3 products live
Conventional
25% down · 7.5% · 30yr
- Down + closing
- —
- Monthly P&I
- —
- Monthly cashflow
- —
- DSCR
- —
- Eligible?
- —
Personal DTI + credit; lowest rate.
DSCR
20% down · 8.5% · 30yr
- Down + closing
- —
- Monthly P&I
- —
- Monthly cashflow
- —
- DSCR
- —
- Eligible?
- —
No personal income docs; deal must DSCR.
Hard money
10% down · 12.0% · 12mo
- Down + closing
- —
- Monthly P&I
- —
- Monthly cashflow
- —
- DSCR
- —
- Eligible?
- —
Short-term bridge; refi at stabilization.
Rent comps 4 comps
| Address | Beds | Baths | Sqft | Rent | $/sqft | DOM | Units | Dist |
|---|---|---|---|---|---|---|---|---|
| 301 Baldwin Dr Oxford, MS | 1.0–3.0 | 1.0–3.0 | 935 | $2,635 | $2.82 | 23d | 6 | 0.82mi |
| 1201 Ivy Rd Oxford, MS | 3.0 | 3.0 | 1500 | $2,700 | $1.80 | 23d | 1 | 0.85mi |
| 1200 Jefferson Ave #303 Oxford, MS | 2.0 | 2.0 | 1100 | $3,450 | $3.14 | 44d | 1 | 1.02mi |
| 814 Claremont Ave Oxford, MS | 1.0–3.0 | 1.0–2.0 | 1108 | $2,178 | $1.96 | 1d | 97 | 1.36mi |
Listing history 50 events
-
2026-06-19days on market $322,000 Active 13 DOM
-
2026-06-18days on market $322,000 Active 12 DOM
-
2026-06-17days on market $322,000 Active 11 DOM
-
2026-06-16days on market $322,000 Active 10 DOM
-
2026-06-15days on market $322,000 Active 9 DOM
-
2026-06-14days on market $322,000 Active 7 DOM
-
2026-06-12days on market $322,000 Active 6 DOM
-
2026-06-09days on market $322,000 Active 3 DOM
-
2026-06-08days on market $322,000 Active 2 DOM
-
2026-06-07remarks 699-char remark
-
2026-06-07price $322,000 Active 1 DOM
-
2026-06-03remarks 620-char remark
-
2026-06-03pricestatusdays on market $309,000 Active 1 DOM
-
2026-05-15soldstatus Closed 469-char remark
-
2026-04-01status Pending 469-char remark
-
2026-03-11price $369,000 469-char remark
-
2026-02-27price $379,000 469-char remark
-
2026-01-15soldstatus
-
2025-12-08$399,000 Active 469-char remark
-
2025-10-02soldstatus
-
2025-09-30soldstatus Closed 300-char remark
-
2025-09-30soldstatus
-
2025-09-12soldstatus
-
2025-08-28status Pending 300-char remark
-
2025-08-14soldstatus
-
2025-08-11soldstatus
-
2025-05-27$319,000 Active 300-char remark
-
2025-05-16soldstatus Closed
-
2025-02-21status Pending
-
2025-02-18$370,000 Active
-
2024-11-04soldstatus
-
2024-10-18soldstatus
-
2024-10-07soldstatus
-
2024-09-20soldstatus
-
2024-09-16soldstatus
-
2024-09-09soldstatus
-
2024-08-27soldstatus
-
2024-08-20soldstatus
-
2024-08-09soldstatus
-
2024-08-07soldstatus
-
2024-08-06soldstatus
-
2024-08-06soldstatus
-
2024-08-02soldstatus
-
2024-08-02soldstatus
-
2024-07-22soldstatus
-
2024-07-12soldstatus
-
2024-07-02soldstatus
-
2024-07-01soldstatus
-
2024-06-13soldstatus
-
2024-06-07soldstatus
ⓘ Source: listings_history table (triggers on properties + properties_extension) + one-shot
backfill from property_details.listing_events for pre-trigger history.
Nearby sold comps map
Loading sold comps map…
Walkable amenities ~0.75 mi
Loading nearby amenities…
Taxation est. · year 1
- Rental income
- $31,278
- − Mortgage interest
- −$18,037
- − Property taxes
- −$4,830
- − Insurance
- −$1,610
- − Repairs & maintenance
- −$2,502
- − Management
- −$2,502
- − Depreciation
- −$9,367
- Taxable loss
- −$7,571
- Est. tax savings @ 24.0%
- +$1,817
- After-tax cash flow
- $-177/yr
For passive investors: Depreciation is non-cash, so a rental often shows a tax loss while cash-flowing — sheltering income. Rental losses are passive: they offset passive income freely, and up to $25,000/yr can offset ordinary (W-2) income if you actively participate and your MAGI is under $100k (phasing out to $0 by $150k); unused losses carry forward. On sale, claimed depreciation is recaptured at up to 25%, and gains may owe capital-gains tax (a 1031 exchange can defer both). Figures are a year-1 estimate at your 24.0% rate — not tax advice; consult a CPA.
Schools (NCES district)
- District
- Oxford School District
- NCES district ID
- 2803450
- Math proficiency
- 53% ▼ -17.00%
- Reading proficiency
- 49% ▼ -8.00%
- Median HH income
- $40,878
- Composite
- 42.77/100
- National rank
- #3152
- State rank
- #12 of 130 in MS
Livability — Oxford
- Score
- 87/100
- State rank
- #1
- US rank
- #285
Category grades
Schools grade is shown separately in the Schools card above.
Census & demographics
- Census place
- Oxford, MS
- County
- Lafayette County · 46,156 people
- City population
- 46,156
- Metro
- Oxford, MS
- Population (ZIP)
- 46,156
- Household income
- $68,235
- Rent vs Own
- Severe rent burden
- 1892.0
Population outlook (Lafayette County) Hauer SSP2
- Today (2025)
- 66,984 people
- By 2030
- 74,726 · +11.6%
- By 2040
- 90,806 · +35.6%
- By 2050
- 108,114 · +61.4%
- By 2075
- 151,215 · +125.7%
- By 2100
- 187,997 · +180.7%
Race, ethnicity, and origin ACS 2023
- Neighborhood character
- Predominantly White (68%)
- Race & ethnicity
- White 68% Black 24% Hispanic / Latino 4% Asian 2% Two or more races 2%
- Common ancestry
- Slovak 3% Serbian 2% Lithuanian 1%
- Foreign-born
- 4% · Canada, China, Vietnam
- Languages at home
- 95% English-only · Spanish 2% Other Indo-European 1% Vietnamese 1%
Political lean MEDSL · Lafayette
- 2024 margin
- Strong R (+21.8) · D 38.3% · R 60.0% · Other 1.7%
- 2008→2024 swing
- -9.4pp toward R · 2008: -12.4pp · 2024: -21.8pp
- All cycles
- 2024: R+21.8 2020: R+12.3 2016: R+14.8 2012: R+15.6 2008: R+12.4
Not yet ingested
- Civics
- —
Market trends
- HPI YoY
- ▼ -204.86%
- Current HPI
- 211.5486
- Rent YoY
- ▲ 4.85%
- Metro
- Oxford, MS
- State GDP YoY
- —
- F500 in state
- 0
Price history
-13.0% since first listed42 events — show timeline
- 2026-06-06 Listed $322,000 NCMBR
- 2026-06-02 Listed $309,000 NCMBR
- 2026-05-27 Pending — NCMBR
- 2026-05-15 Sold (MLS) — NCMBR
- 2026-04-28 Listed $318,900 NCMBR
- 2026-04-01 Pending — NCMBR
- 2026-03-11 Price Changed $369,000 NCMBR
- 2026-02-27 Price Changed $379,000 NCMBR
- 2026-01-15 Sold (Public Records) — Public Records
- 2025-12-08 Listed $399,000 NCMBR
- 2025-10-02 Sold (Public Records) — Public Records
- 2025-09-30 Sold (Public Records) — Public Records
- 2025-09-30 Sold (MLS) — NCMBR
- 2025-09-12 Sold (Public Records) — Public Records
- 2025-08-28 Pending — NCMBR
- 2025-08-14 Sold (Public Records) — Public Records
- 2025-08-11 Sold (Public Records) — Public Records
- 2025-05-27 Listed $319,000 NCMBR
- 2025-05-16 Sold (MLS) — NCMBR
- 2025-02-21 Pending — NCMBR
- 2025-02-18 Listed $370,000 NCMBR
- 2024-11-04 Sold (Public Records) — Public Records
- 2024-10-18 Sold (Public Records) — Public Records
- 2024-10-07 Sold (Public Records) — Public Records
- 2024-09-20 Sold (Public Records) — Public Records
- 2024-09-16 Sold (Public Records) — Public Records
- 2024-09-09 Sold (Public Records) — Public Records
- 2024-08-27 Sold (Public Records) — Public Records
- 2024-08-20 Sold (Public Records) — Public Records
- 2024-08-09 Sold (Public Records) — Public Records
- 2024-08-07 Sold (Public Records) — Public Records
- 2024-08-06 Sold (Public Records) — Public Records
- 2024-08-06 Sold (Public Records) — Public Records
- 2024-08-02 Sold (Public Records) — Public Records
- 2024-08-02 Sold (Public Records) — Public Records
- 2024-07-22 Sold (Public Records) — Public Records
- 2024-07-12 Sold (Public Records) — Public Records
- 2024-07-02 Sold (Public Records) — Public Records
- 2024-07-01 Sold (Public Records) — Public Records
- 2024-06-13 Sold (Public Records) — Public Records
- 2024-06-07 Sold (Public Records) — Public Records
- 2024-06-07 Sold (Public Records) — Public Records
Property tax history
+3.8%/yrLatest (2024): $29,051 · +5.6% YoY. Source: county tax records.
Cash-flow waterfall
monthlySold comps — $/sqft
last 12 mo · ≤1 miLoading sold comps…