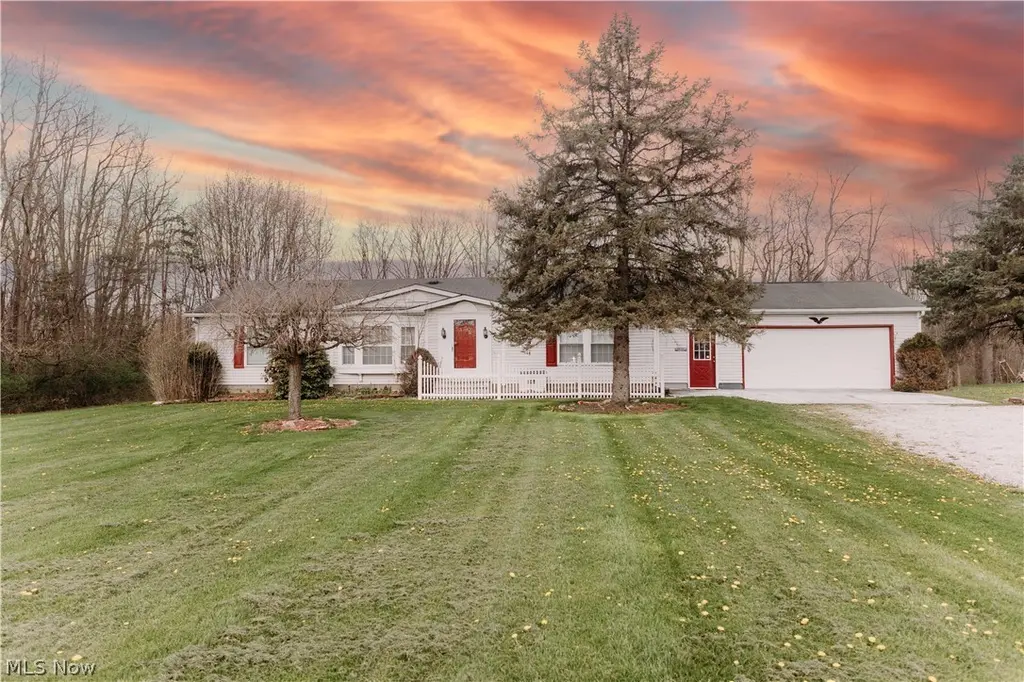
3995 Victory Ave · Canton, OH
Flood risk 1/10 · Minimal
- FEMA flood zone
- X (unshaded)
- Chance of flooding over 30 yrs
- 0.0%
- Est. flood insurance / yr
- $473 – $860
Fire risk 1/10 · Minimal
- Est. fire insurance / yr
- $713 – $1,323
Heat risk 3/10 · Minor
- Hot days now (above 96°F)
- 7 days/yr
- Hot days in 30 yrs
- 16 days/yr
Wind risk 1/10 · Minimal
- Chance of severe wind over 30 yrs
- —
Air-quality risk 2/10 · Minimal
- Unhealthy air days now
- 1 days/yr
- Unhealthy air days in 30 yrs
- 2 days/yr
Risk factors via First Street. Map © Google.
Why this score? — see what drove the C grade
The composite is a weighted blend of 9 inputs, each scored 0–100. Each bar is that input's sub-score; the figure is the points it added to the 100-point composite (weight × sub-score).
- Cash flow +17.4/30.0
- ARV discount +15.0/15.0
- Schools +5.9/10.0
- DSCR +5.4/10.0
- Rent growth +3.9/5.0
- 1% rule +3.8/10.0
- Livability +3.6/5.0
- Condition / age +2.5/5.0
- Appreciation +0.0/10.0
$169,900
🖨 Deal sheet 📄 Offer letter ✓ Due diligence
Listing remarks
Charming and well-maintained 3-bedroom, 2-bath ranch offering 1,456 sq ft of comfortable, single-level living in desirable Louisville! Situated on a spacious lot of over 1 acre, this home features an open-concept layout perfect for everyday living and entertaining. The inviting living area flows seamlessly into the kitchen and dining space, creating a bright and airy feel throughout. The private owner’s suite includes its own full bath, while two additional bedrooms provide flexibility for family, guests, or a home office. A 2-car garage offers ample storage and convenience. Enjoy peaceful surroundings with room to roam, all while being just minutes from shopping, dining, and major ro
Key facts
- Private owners suite
- Spacious lot
- Open-concept layout
Tags
Property features AI
Exterior
- Parking: 2-car garage with garage door opener; Drive-through access
- Utilities: Public sewer; Well water
- Home design: Single-story home; Block foundation
- Construction: Vinyl siding; Asphalt/fiberglass roof; Built per public records
- Exterior features: Lot of approximately 1.08 acres
Interior
- Kitchen: Range; Refrigerator; Dishwasher
- Bedrooms: 3 main-level bedrooms
- Bathrooms: 2 full bathrooms (both on the main level)
- Heating & cooling: Forced-air gas heating; Central air conditioning
- Interior features: Full basement with sump pump
- Laundry & utility: Washer and Dryer
Neighborhood map
What this means for you Summary
Snapshot
- This is a 3-bed/2.0-bath single-family listed at $170k.
Deal economics
- At list price, monthly cash flow is $128 ($2k/yr) — positive.
- The deal already cash-flows at list — no discount required.
- To meet the 1% rule (rent ≥ 1% of price), the offer needs to be $149k (12.2% below list).
- Recommended offer: $149k (12.2% below list) — sets the bar for 1% rule.
- Cap rate 7.2% vs local median 5.1% in Canton — top-decile yield for the area; either an underpriced asset or a hidden risk that comps aren't pricing in. Stress-test before assuming the spread holds.
Location & tenants
- Location reads 71/100 on livability (#441 in OH) — a middle-class / working-renter tenant base. Strengths: commute A+, cost of living A+, housing A; Watch: crime F, employment F.
- Louisville City (suburban): math 67% / reading 70% proficiency, ranked #162 of 656 in OH (top 25%) — acceptable for families but not a draw, mixed tenant base, ~2y average lease.
- Market conditions: Rents rising fast (+5.6%/yr); 88 active listings in the ZIP; 1 comparable units currently listed for rent nearby; solid renter incomes; 528 units permitted in Stark County in 2024 (84 in 5+ unit buildings).
Forward outlook
- Local home prices are declining (-3.0%/yr); year-one equity from $1k of loan paydown is wiped out by about $5k of value loss. Plan a longer hold.
- Stark County population projected to shrink 8% by 2050 — rents likely to lag national; underwrite the cash flow, not the appreciation.
Negotiation context
- Only 10 days on market — expect competitive offers; lowballing is unlikely to land.
- 2 sale attempts with the ask held roughly flat each time — persistent listings suggest the price (not the market) is what's stuck; bring a comps-based counter.
Questions for the listing agent
- Is there a deadline driving the sale (1031 exchange, divorce, estate, relocation)? That informs how much negotiation room exists.
- Crime grade is F in this area — have there been break-ins, vandalism, or insurance claims at this property in the last 3 years? What carrier currently insures it and at what premium?
- What's the average days-on-market for RENTAL listings here right now (not sales)? A rising rental-DOM trend means longer vacancies and softer asking-rent achievability than the comps imply.
- What's the recent tenant-quality profile in this submarket — average credit score on applications, eviction rate, late-payment / NSF rate, and stable-employment percentage? A property-management company in the area should have these aggregated.
- How much new for-sale + rental construction is in the pipeline within 1–3 miles? Heavy new supply typically softens prices + rents 12–24 months out; constrained supply supports both.
Investment metrics
- 1% rule
- 0.88% ✗
- Cap rate
- 7.20%
- Cash-on-cash
- 3.23%
- DSCR
- 1.14
- GRM
- 9.5
CMA / ARV
- ARV (on-the-fly)
- $219,856
- Comps found
- 12
Show comp detail 12 sales within ~0.75 mi
| Address | Dist | Beds/Ba | Sqft | Sold | Price | $/sf | Match |
|---|---|---|---|---|---|---|---|
| 3995 Victory Ave | 0.00mi | 3/2.0 | 1,456 (0%) | 1mo | $167,000 | $115 | 100 |
| 3843 Victory Ave | 0.16mi | 3/2.0 | 1,560 (+7%) | 11mo | $72,000 | $46 | 72 |
| 5149 Francesca St NE | 0.74mi | 3/2.0 | 1,452 (-0%) | 5mo | $279,900 | $193 | 60 |
| 4095 Homeland Ave NE | 0.15mi | 3/1.0 | 1,652 (+14%) | 12mo | $209,000 | $127 | 57 |
| 2831 Long Ave NE | 0.40mi | 3/1.0 | 1,526 (+5%) | 18mo | $170,000 | $111 | 54 |
| 4034 Broadway Ave NE | 0.49mi | 3/3.0 | 1,624 (+12%) | 3mo | $245,000 | $151 | 51 |
| 4661 Eastland Ave | 0.71mi | 2/1.5 (-1) | 1,501 (+3%) | 9mo | $267,900 | $178 | 47 |
| 5151 Peach St | 0.62mi | 3/1.0 | 1,440 (-1%) | 22mo | $221,651 | $154 | 47 |
| 5783 Louisville St NE | 0.73mi | 3/2.0 | 1,248 (-14%) | 4mo | $227,500 | $182 | 38 |
| 4241 Addison Ave | 0.75mi | 3/1.5 | 1,288 (-12%) | 9mo | $230,000 | $179 | 36 |
| 4128 27th Ter NE | 0.65mi | 3/2.0 | 1,296 (-11%) | 20mo | $32,000 | $25 | 35 |
| 5425 Lesh St | 0.53mi | 4/1.0 (+1) | 1,290 (-11%) | 19mo | $195,000 | $151 | 32 |
Match score weights: distance 35% · size 25% · config 20% · recency 20%. Top-matched comps best support the ARV.
Projected returns pro-forma
-3.0% appreciation · 5.57% rent growth · sell at horizon
- IRR
- -8.7%
- Equity multiple
- 0.67×
- Total profit
- $-15,466
- Equity at exit
- $25,333
- IRR
- 3.7%
- Equity multiple
- 1.29×
- Total profit
- $13,934
- Equity at exit
- $14,690
Cash invested: $47,572 (down + closing). Projections, not guarantees.
Landlord ↔ Tenant lean methodology
- Overall (STATE)
- 73 Landlord-Friendly
- State Ohio
- 73 Landlord-Friendly · R+6
- County
- — inherits STATE
- City
- — inherits STATE
ZIP-level market 44641
- Rents YoY
- 5.6%
- Active inventory
- 88
- Price-to-rent
- 9.5×
Monthly cashflow live
- Estimated rent
- $1,491 medium interval (Pro) →
- Mortgage (P&I)
- −$891
- Tax from tax record
- −$88 /mo · $1,057/yr
- Insurance
- −$71
- HOA
- −$0
- Vacancy / Maint / Mgmt
- −$313
- Net cashflow
- $128
Break-even live
UW: 25.0% down · 7.5% · 30yr · 1.5% tax · 5.0% vac · 8.0% maint · 8.0% mgmt
Financing live
Cash to close
- Down payment
- $42,475
- Closing costs
- $5,097
- Reserves months
- —
- Total cash needed
- —
Loan-product check · same deal, 3 products live
Conventional
25% down · 7.5% · 30yr
- Down + closing
- —
- Monthly P&I
- —
- Monthly cashflow
- —
- DSCR
- —
- Eligible?
- —
Personal DTI + credit; lowest rate.
DSCR
20% down · 8.5% · 30yr
- Down + closing
- —
- Monthly P&I
- —
- Monthly cashflow
- —
- DSCR
- —
- Eligible?
- —
No personal income docs; deal must DSCR.
Hard money
10% down · 12.0% · 12mo
- Down + closing
- —
- Monthly P&I
- —
- Monthly cashflow
- —
- DSCR
- —
- Eligible?
- —
Short-term bridge; refi at stabilization.
Rent comps 1 comps
| Address | Beds | Baths | Sqft | Rent | $/sqft | DOM | Units | Dist |
|---|---|---|---|---|---|---|---|---|
| 3045 Daleford Ave NE Canton, OH | 3.0 | 1.0 | 1300 | $1,059 | $0.81 | 21d | 1 | 0.86mi |
Listing history 4 events
-
2026-04-26status Pending
-
2026-04-21status Active
-
2026-04-15status Pending
-
2026-04-10$169,900 Active
ⓘ Source: listings_history table (triggers on properties + properties_extension) + one-shot
backfill from property_details.listing_events for pre-trigger history.
Tax reassessment forecast OH · Partial reset (capped growth)
- Current annual tax
- $1,057 · $88/mo
- Projected year-2 tax
- $1,854 · $154/mo
- Expected delta
- +$797/yr (+$66/mo · 75.4%)
ⓘ Screening estimate from a state-policy table — verify with the county assessor before closing.
Climate risk First Street
- Flood 1/10 Low FEMA zone X (unshaded) · 0% chance over 30 yrs
- Wildfire 1/10 Low
- Heat 3/10 Moderate 7 d/yr ≥96°F today · 16 d/yr by 30 yrs out
- Wind 1/10 Low
- Air quality 2/10 Low 1 unhealthy d/yr today · 2 by 30 yrs out
Nearby sold comps map
Loading sold comps map…
Walkable amenities ~0.75 mi
Loading nearby amenities…
Taxation est. · year 1
- Rental income
- $17,894
- − Mortgage interest
- −$9,517
- − Property taxes
- −$1,057
- − Insurance
- −$850
- − Repairs & maintenance
- −$1,432
- − Management
- −$1,432
- − Depreciation
- −$4,943
- Taxable loss
- −$1,335
- Est. tax savings @ 24.0%
- +$320
- After-tax cash flow
- $1,859/yr
For passive investors: Depreciation is non-cash, so a rental often shows a tax loss while cash-flowing — sheltering income. Rental losses are passive: they offset passive income freely, and up to $25,000/yr can offset ordinary (W-2) income if you actively participate and your MAGI is under $100k (phasing out to $0 by $150k); unused losses carry forward. On sale, claimed depreciation is recaptured at up to 25%, and gains may owe capital-gains tax (a 1031 exchange can defer both). Figures are a year-1 estimate at your 24.0% rate — not tax advice; consult a CPA.
Schools (NCES district)
- District
- Louisville City
- NCES district ID
- 3904987
- Math proficiency
- 67% ▼ -11.00%
- Reading proficiency
- 70% ▼ -4.00%
- Median HH income
- $54,455
- Composite
- 58.54/100
- National rank
- #992
- State rank
- #162 of 656 in OH
Livability — Canton
- Score
- 71/100
- State rank
- #441
- US rank
- #7259
Category grades
Schools grade is shown separately in the Schools card above.
Census & demographics
- County
- Stark County · 272,865 people
- City population
- 103,614
- Metro
- Canton-Massillon, OH
- Population (ZIP)
- 20,031
- Household income
- $80,303
- Rent vs Own
- Severe rent burden
- 344.0
Population outlook (Stark County) Hauer SSP2
- Today (2025)
- 373,708 people
- By 2030
- 371,245 · -0.7%
- By 2040
- 361,331 · -3.3%
- By 2050
- 345,290 · -7.6%
- By 2075
- 302,669 · -19.0%
- By 2100
- 238,870 · -36.1%
Race, ethnicity, and origin ACS 2023
- Neighborhood character
- Predominantly White (95%)
- Race & ethnicity
- White 95% Two or more races 2% Hispanic / Latino 1% Black 1%
- Common ancestry
- Italian 6% Lithuanian 5% Romanian 2%
- Foreign-born
- 1% · Canada
- Languages at home
- 98% English-only · German/W. Germanic 1%
Political lean MEDSL · Stark
- 2024 margin
- Strong R (+21.9) · D 38.6% · R 60.5%
- 2008→2024 swing
- -27.4pp toward R · 2008: 5.5pp · 2024: -21.9pp
- All cycles
- 2024: R+21.9 2020: R+18.5 2016: R+17.4 2012: R+0.4 2008: D+5.5
Not yet ingested
- Civics
- —
Market trends
- HPI YoY
- ▼ -203.38%
- Current HPI
- 214.6849
- Rent YoY
- ▲ 5.57%
- Metro
- Canton-Massillon, OH
- State GDP YoY
- ▲ 1.98%
- F500 in state
- 48
Industry mix (Fortune 500 HQ in OH)
| Industry | F500 HQs | Revenue |
|---|---|---|
| Insurance | 3 | $145B |
|
||
| Industrial Machinery | 3 | $49B |
|
||
| Financial Services | 3 | $24B |
|
||
| Consumer Goods | 2 | $93B |
|
||
| Aerospace / Defense | 2 | $47B |
|
||
| Utilities | 2 | $33B |
|
||
Price history
4 events — show timeline
- 2026-04-26 Pending — MLSNOW
- 2026-04-21 Relisted — MLSNOW
- 2026-04-15 Pending — MLSNOW
- 2026-04-10 Listed $169,900 MLSNOW
Property tax history
+1.6%/yrLatest (2024): $1,057 · +338.3% YoY. Source: county tax records.
Cash-flow waterfall
monthlySold comps — $/sqft
last 12 mo · ≤1 miLoading sold comps…