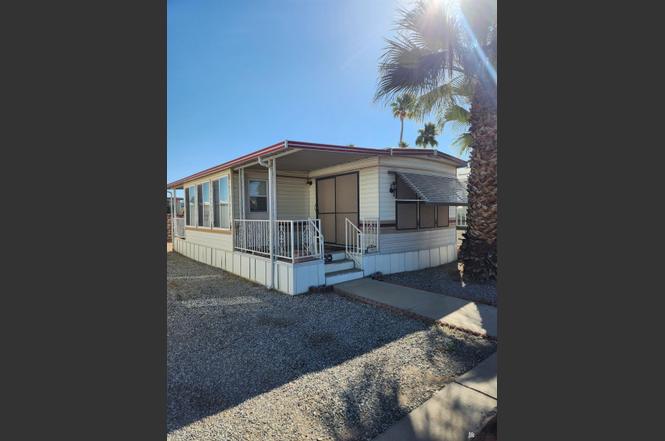
11481 S Clara Anita Dr · Fortuna Foothills, AZ
Flood risk 1/10 · Minimal
- FEMA flood zone
- X (shaded)
- Chance of flooding over 30 yrs
- 0.0%
- Est. flood insurance / yr
- $507 – $1,088
Fire risk 4/10 · Minor
- Est. fire insurance / yr
- $610 – $1,132
Heat risk 9/10 · Severe
- Hot days now (above 113°F)
- 5 days/yr
- Hot days in 30 yrs
- 13 days/yr
Wind risk 1/10 · Minimal
- Chance of severe wind over 30 yrs
- —
Air-quality risk 1/10 · Minimal
- Unhealthy air days now
- 0 days/yr
- Unhealthy air days in 30 yrs
- 0 days/yr
Risk factors via First Street. Map © Google.
Why this score? — see what drove the B grade
The composite is a weighted blend of 9 inputs, each scored 0–100. Each bar is that input's sub-score; the figure is the points it added to the 100-point composite (weight × sub-score).
- Cash flow +30.0/30.0
- ARV discount +12.2/15.0
- 1% rule +10.0/10.0
- DSCR +10.0/10.0
- Rent growth +3.6/5.0
- Livability +3.0/5.0
- Condition / age +2.5/5.0
- Schools +1.3/10.0
- Appreciation +0.0/10.0
$69,500
🖨 Deal sheet 📄 Offer letter ✓ Due diligence
Listing remarks
Enjoy this well kept home with extra space in the glassed-in Arizona Room! The friendly community atmosphere invites you to join in to regular festivities at the clubhouse, including music, dancing and potlucks to name a few. Stroll around the neighborhood to get your daily exercise as you get to know your fellow neighbors. It's all part of the experience at Yuma, plus it's move-in ready!
Key facts
- Clubhouse
- Arizona room
- 1,760 sq ft lot
Tags
Property features AI
Finance
- HOA & community: Homeowners association with monthly fee; Association fee: $190; Subdivision: Yuma Venture
Exterior
- Security: Smoke detectors; Carbon monoxide detectors; Gated community
- Utilities: Public water; Private sewer
- Home design: Manufactured home; Residential property
- Exterior features: Deck; Sliding doors; Shed(s); Paved road access
Interior
- Kitchen: Disposal; Refrigerator; Gas range
- Bathrooms: 1 full bathroom
- Heating & cooling: Has heating; Has cooling
- Interior features: Blinds; Disposal; Refrigerator; Gas range; Fireplace: None; Washer and Dryer included
- Laundry & utility: Washer; Dryer
Neighborhood map
What this means for you Summary
Snapshot
- This is a 1-bed/1.0-bath manufactured listed at $70k.
Deal economics
- At list price, monthly cash flow is $264 ($3k/yr) — positive.
- The deal already cash-flows at list — no discount required.
- Meets the 1% rule at list price ($1k rent vs $70k).
- Recommended offer: $61k (12.0% below list) — sets the bar for market timing.
- Cap rate 10.9% vs local median 4.2% in Fortuna Foothills — top-decile yield for the area; either an underpriced asset or a hidden risk that comps aren't pricing in. Stress-test before assuming the spread holds.
Location & tenants
- Location reads 60/100 on livability (#174 in AZ) — a middle-class / working-renter tenant base. Strengths: cost of living A+, housing A+; Watch: employment C-, schools F, crime F.
- Yuma Union High School District (4507) (urban): math 14% / reading 16% proficiency, ranked #212 of 249 in AZ (top 85%) — low school quality limits family demand, transient renter base, plan for 1-2y turnover.
- Market conditions: Rents rising fast (+4.5%/yr); 413 active listings in the ZIP; 1,399 units permitted in Yuma County in 2024 (180 in 5+ unit buildings).
Forward outlook
- Local home prices are declining (-3.0%/yr); year-one equity from $481 of loan paydown is wiped out by about $2k of value loss. Plan a longer hold.
- Yuma County population projected at +4% by 2050 — modest demand growth; plan on rents tracking national, not racing it.
- At projected returns (-3.0% appreciation + 4.5% rent growth), your $19k cash investment doubles in ~7 years — after that, you're playing with house money.
Negotiation context
- It's been on market 137 days — a 12% lower offer ($61k) is reasonable based on typical stale-listing flexibility.
- Current owner paid $50k; 40% above their basis — modest negotiation headroom, anchor on the comps not their cost.
Risks & watch-outs
- Climate carrying-cost: extreme-heat days projected 5→13/yr by 2055 (HVAC capex compounding) — expect insurance premiums to compound above CPI over the hold.
Questions for the listing agent
- It's been on market 137 days. Have you received any prior offers? Is the seller open to a 12% concession, seller financing, or rate buy-down credit?
- What does the HOA fee cover, when was the last increase, and are there any pending special assessments or reserve-fund shortfalls?
- Why hasn't it sold? Are there any deal-killer items the seller is aware of (foundation, flood, title, zoning, code violations)?
- Is there a deadline driving the sale (1031 exchange, divorce, estate, relocation)? That informs how much negotiation room exists.
- Schools are F-rated, which usually means shorter tenancies and higher turnover. Who's the typical renter profile here, and what's been the actual vacancy rate?
- Crime grade is F in this area — have there been break-ins, vandalism, or insurance claims at this property in the last 3 years? What carrier currently insures it and at what premium?
- What's the average days-on-market for RENTAL listings here right now (not sales)? A rising rental-DOM trend means longer vacancies and softer asking-rent achievability than the comps imply.
- What's the recent tenant-quality profile in this submarket — average credit score on applications, eviction rate, late-payment / NSF rate, and stable-employment percentage? A property-management company in the area should have these aggregated.
- How much new for-sale + rental construction is in the pipeline within 1–3 miles? Heavy new supply typically softens prices + rents 12–24 months out; constrained supply supports both.
Investment metrics
- 1% rule
- 1.60% ✓
- Cap rate
- 10.86%
- Cash-on-cash
- 16.30%
- DSCR
- 1.73
- GRM
- 5.2
CMA / ARV
- ARV (on-the-fly)
- $77,586
- Comps found
- 12
Show comp detail 12 sales within ~0.75 mi
| Address | Dist | Beds/Ba | Sqft | Sold | Price | $/sf | Match |
|---|---|---|---|---|---|---|---|
| 11463 S Maria Rosa Dr | 0.03mi | 1/1.0 | 409 (+2%) | 2mo | $85,000 | $208 | 94 |
| 11423 S Maria Rosa Dr | 0.07mi | 1/1.0 | 398 (-1%) | 4mo | $60,000 | $151 | 91 |
| 11393 S Maria Rosa Dr | 0.11mi | 1/1.0 | 396 (-2%) | 2mo | $51,250 | $129 | 91 |
| 11370 S Clara Anita Dr | 0.14mi | 1/1.0 | 402 (0%) | 7mo | $99,500 | $248 | 87 |
| 11409 S Clara Anita Dr | 0.09mi | 1/1.0 | 385 (-4%) | 3mo | $76,000 | $197 | 87 |
| 11281 S Clara Anita Dr #22 | 0.24mi | 1/1.0 | 395 (-2%) | 4mo | $70,000 | $177 | 83 |
| 11360 S Maria Rosa Dr | 0.15mi | 1/1.0 | 420 (+4%) | 4mo | $67,300 | $160 | 82 |
| 11341 S Maria Rosa Dr | 0.17mi | 1/1.0 | 386 (-4%) | 6mo | $68,900 | $178 | 80 |
| 11275 S Clara Anita Dr #21 | 0.25mi | 1/1.0 | 391 (-3%) | 5mo | $73,000 | $187 | 80 |
| 12156 E 39 St | 0.41mi | 1/1.0 | 396 (-2%) | 3mo | $120,000 | $303 | 76 |
| 11529 S Sandra Ave | 0.46mi | 1/1.0 | 400 (-0%) | 5mo | $113,500 | $284 | 74 |
| 12276 S Maria Rosa Pl | 0.39mi | 2/1.0 (+1) | 405 (+1%) | 3mo | $78,000 | $193 | 73 |
Match score weights: distance 35% · size 25% · config 20% · recency 20%. Top-matched comps best support the ARV.
Projected returns pro-forma
-3.0% appreciation · 4.46% rent growth · sell at horizon
- IRR
- 9.4%
- Equity multiple
- 1.38×
- Total profit
- $7,330
- Equity at exit
- $10,363
- IRR
- 20.0%
- Equity multiple
- 2.82×
- Total profit
- $35,455
- Equity at exit
- $6,009
Cash invested: $19,460 (down + closing). Projections, not guarantees.
Landlord ↔ Tenant lean methodology
- Overall (STATE)
- 87 Strongly Landlord-Friendly
- State Arizona
- 87 Strongly Landlord-Friendly · R+3
- County
- — inherits STATE
- City
- — inherits STATE
ZIP-level market 85367
- Home prices YoY
- -26.2%
- Rents YoY
- 4.5%
- Active inventory
- 413
- Price-to-rent
- 5.2×
Monthly cashflow live
- Estimated rent
- $1,110 medium interval (Pro) →
- Mortgage (P&I)
- −$364
- Tax from tax record
- −$29 /mo · $344/yr
- Insurance
- −$29
- HOA
- −$190
- Vacancy / Maint / Mgmt
- −$233
- Net cashflow
- $264
Break-even live
UW: 25.0% down · 7.5% · 30yr · 1.5% tax · 5.0% vac · 8.0% maint · 8.0% mgmt
Financing live
Cash to close
- Down payment
- $17,375
- Closing costs
- $2,085
- Reserves months
- —
- Total cash needed
- —
Loan-product check · same deal, 3 products live
Conventional
25% down · 7.5% · 30yr
- Down + closing
- —
- Monthly P&I
- —
- Monthly cashflow
- —
- DSCR
- —
- Eligible?
- —
Personal DTI + credit; lowest rate.
DSCR
20% down · 8.5% · 30yr
- Down + closing
- —
- Monthly P&I
- —
- Monthly cashflow
- —
- DSCR
- —
- Eligible?
- —
No personal income docs; deal must DSCR.
Hard money
10% down · 12.0% · 12mo
- Down + closing
- —
- Monthly P&I
- —
- Monthly cashflow
- —
- DSCR
- —
- Eligible?
- —
Short-term bridge; refi at stabilization.
HOA detail
- Monthly dues
- $190 · $2,280/yr
Listing history 22 events
-
2026-06-19days on market $69,500 Active 137 DOM
-
2026-06-18days on market $69,500 Active 136 DOM
-
2026-06-17days on market $69,500 Active 135 DOM
-
2026-06-16days on market $69,500 Active 134 DOM
-
2026-06-15days on market $69,500 Active 133 DOM
-
2026-06-14days on market $69,500 Active 131 DOM
-
2026-06-13days on market $69,500 Active 130 DOM
-
2026-06-10days on market $69,500 Active 128 DOM
-
2026-06-09days on market $69,500 Active 127 DOM
-
2026-06-08days on market $69,500 Active 126 DOM
-
2026-06-07days on market $69,500 Active 125 DOM
-
2026-06-05days on market $69,500 Active 122 DOM
-
2026-06-02days on market $69,500 Active 120 DOM
-
2026-06-01days on market $69,500 Active 119 DOM
-
2026-05-31days on market $69,500 Active 118 DOM
-
2026-05-30days on market $69,500 Active 117 DOM
-
2026-03-23price $69,500
-
2026-02-02$75,000 Active
-
2009-03-20soldstatus $49,500
-
2009-03-20soldstatus $49,500
-
1993-04-28soldstatus $34,000
-
1993-03-01soldstatus $34,000
ⓘ Source: listings_history table (triggers on properties + properties_extension) + one-shot
backfill from property_details.listing_events for pre-trigger history.
Tax reassessment forecast AZ · Resets to sale price
- Current annual tax
- $344 · $29/mo
- Projected year-2 tax
- $459 · $38/mo
- Expected delta
- +$115/yr (+$10/mo · 33.3%)
ⓘ Screening estimate from a state-policy table — verify with the county assessor before closing.
Climate risk First Street
- Flood 1/10 Low FEMA zone X (shaded) · 0% chance over 30 yrs
- Wildfire 4/10 Moderate
- Heat 9/10 Extreme 5 d/yr ≥113°F today · 13 d/yr by 30 yrs out
- Wind 1/10 Low
- Air quality 1/10 Low 0 unhealthy d/yr today · 0 by 30 yrs out
Nearby sold comps map
Loading sold comps map…
Walkable amenities ~0.75 mi
Loading nearby amenities…
Taxation est. · year 1
- Rental income
- $13,314
- − Mortgage interest
- −$3,893
- − Property taxes
- −$344
- − Insurance
- −$348
- − Repairs & maintenance
- −$1,065
- − Management
- −$1,065
- − HOA
- −$2,280
- − Depreciation
- −$2,022
- Taxable income
- $2,297
- Est. tax owed @ 24.0%
- −$551
- After-tax cash flow
- $2,622/yr
For passive investors: Depreciation is non-cash, so a rental often shows a tax loss while cash-flowing — sheltering income. Rental losses are passive: they offset passive income freely, and up to $25,000/yr can offset ordinary (W-2) income if you actively participate and your MAGI is under $100k (phasing out to $0 by $150k); unused losses carry forward. On sale, claimed depreciation is recaptured at up to 25%, and gains may owe capital-gains tax (a 1031 exchange can defer both). Figures are a year-1 estimate at your 24.0% rate — not tax advice; consult a CPA.
Schools (NCES district)
- District
- Yuma Union High School District (4507)
- NCES district ID
- 0409630
- Math proficiency
- 14% ▼ -12.00%
- Reading proficiency
- 16% ▼ -10.00%
- Median HH income
- $40,512
- Composite
- 12.86/100
- National rank
- #9592
- State rank
- #212 of 249 in AZ
Livability — Fortuna Foothills
- Score
- 60/100
- State rank
- #174
- US rank
- #18663
Category grades
Schools grade is shown separately in the Schools card above.
Census & demographics
- Census place
- Fortuna Foothills, AZ
- County
- Yuma County · 149,809 people
- City population
- 21,356
- Metro
- Yuma, AZ
- Population (ZIP)
- 22,074
- Household income
- $58,469
- Rent vs Own
- Severe rent burden
- 408.0
Population outlook (Yuma County) Hauer SSP2
- Today (2025)
- 211,633 people
- By 2030
- 214,114 · +1.2%
- By 2040
- 217,856 · +2.9%
- By 2050
- 220,276 · +4.1%
- By 2075
- 222,359 · +5.1%
- By 2100
- 198,880 · -6.0%
Race, ethnicity, and origin ACS 2023
- Neighborhood character
- Predominantly White (71%)
- Race & ethnicity
- White 71% Hispanic / Latino 22% Two or more races 11% Black 3%
- Hispanic origin (detail)
- Mexican 20%
- Common ancestry
- Portuguese 4% Lithuanian 2% Italian 2%
- Foreign-born
- 10% · Canada
- Languages at home
- 81% English-only · Spanish 16% French/Haitian/Cajun 1% German/W. Germanic 1%
Political lean MEDSL · Yuma
- 2024 margin
- Strong R (+20.4) · D 39.3% · R 59.8%
- 2008→2024 swing
- -6.6pp toward R · 2008: -13.8pp · 2024: -20.4pp
- All cycles
- 2024: R+20.4 2020: R+6.2 2016: R+5.5 2012: R+16.1 2008: R+13.8
Not yet ingested
- Civics
- —
Market trends
- HPI YoY
- ▼ -80.81%
- Current HPI
- 227.2692
- Rent YoY
- ▲ 4.46%
- Metro
- Yuma, AZ
- State GDP YoY
- ▲ 4.54%
- F500 in state
- 20
Industry mix (Fortune 500 HQ in AZ)
| Industry | F500 HQs | Revenue |
|---|---|---|
| Technology | 2 | $13B |
|
||
| Mining / Metals | 1 | $23B |
|
||
| Environmental Services | 1 | $16B |
|
||
| Metals / Steel | 1 | $14B |
|
||
| Technology Distribution | 1 | $9B |
|
||
| Homebuilding | 1 | $8B |
|
||
Price history
+104.4% since first listed6 events — show timeline
- 2026-03-23 Price Changed $69,500 YAR
- 2026-02-02 Listed $75,000 YAR
- 2009-03-20 Sold (Public Records) $49,500 Public Records
- 2009-03-20 Sold (Public Records) $49,500 Public Records
- 1993-04-28 Sold (Public Records) $34,000 Public Records
- 1993-03-01 Sold (Public Records) $34,000 Public Records
Property tax history
-3.1%/yrLatest (2025): $344 · +3.1% YoY. Source: county tax records.
Cash-flow waterfall
monthlySold comps — $/sqft
last 12 mo · ≤1 miLoading sold comps…