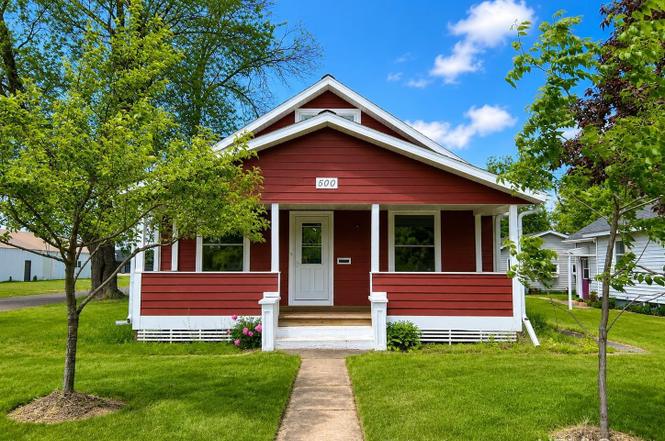
500 E Sagola Ave · Breitung, MI
Flood risk No data
- FEMA flood zone
- —
- Chance of flooding over 30 yrs
- —
- Est. flood insurance / yr
- —
Fire risk No data
- Est. fire insurance / yr
- —
Heat risk No data
- Hot days now (above threshold)
- —
- Hot days in 30 yrs
- —
Wind risk No data
- Chance of severe wind over 30 yrs
- —
Air-quality risk No data
- Unhealthy air days now
- —
- Unhealthy air days in 30 yrs
- —
Risk factors via First Street. Map © Google.
Why this score? — see what drove the D- grade
The composite is a weighted blend of 9 inputs, each scored 0–100. Each bar is that input's sub-score; the figure is the points it added to the 100-point composite (weight × sub-score).
- ARV discount +10.1/15.0
- Cash flow +9.7/30.0
- Schools +4.0/10.0
- DSCR +2.8/10.0
- Rent growth +2.5/5.0
- Livability +2.5/5.0
- Condition / age +2.5/5.0
- 1% rule +1.7/10.0
- Appreciation +0.0/10.0
$149,900
🖨 Deal sheet 📄 Offer letter ✓ Due diligence
Listing remarks MLS
Charming and move-in ready, this well-maintained home is located in a comfortable neighborhood and offers a perfect blend of character and comfort. Inside, you'll find bright, inviting living spaces, updated finishes, and a functional layout that feels like home the moment you walk in. Whether you're looking for your first home or an investment opportunity, this property is ready for its next owner!
Key facts
- 5,662 sq ft lot
- 2 garage spots
- Built 1925
Property features AI
Exterior
- Parking: Detached 2-car garage
- Utilities: Electricity connected; Natural gas connected; Public water; Public sanitary sewer
- Home design: Residential property; 1 1/2-story structure; Built in 1925; Road frontage
- Construction: Cement siding exterior; Stone foundation; Built in 1925
- Exterior features: Cement siding; Front porch; Outbuilding: detached garage
Interior
- Kitchen: Kitchen roughly 12 x 13
- Bedrooms: First-floor bedrooms (three on the first level); One bedroom on the second level; Bedroom sizes include approximately 10 x 5, 10 x 7, 10 (width), and 15 x 6
- Flooring: Hardwood floors
- Bathrooms: One full bathroom (located on the first floor)
- Heating & cooling: Forced-air heating; Ceiling fans for cooling; Gas water heater
- Interior features: Hardwood floors; Basement (stone)
- Laundry & utility: Washer and dryer included; Refrigerator included
Neighborhood map
What this means for you Summary
Snapshot
- This is a 3-bed/1.0-bath single-family listed at $150k.
Deal economics
- At list price, monthly cash flow is $-98 ($-1k/yr) — negative.
- To cash-flow at today's rent, offer at most $133k (11.6% below list).
- To meet the 1% rule (rent ≥ 1% of price), the offer needs to be $100k (33.1% below list).
- Recommended offer: $100k (33.1% below list) — sets the bar for 1% rule.
Location & tenants
- Location reads: area grade D — affects rentability + tenant quality, not the cash-flow math above.
- Breitung Township School District (town): math 39% / reading 55% proficiency, ranked #130 of 540 in MI (top 24%) — families likely to look elsewhere, expect single-tenant / working-renter base with shorter leases.
- Market conditions: 72 active listings in the ZIP; 42 units permitted in Dickinson County in 2024 (0 in 5+ unit buildings).
Forward outlook
- Local home prices are declining (-3.0%/yr); year-one equity from $1k of loan paydown is wiped out by about $4k of value loss. Plan a longer hold.
- Dickinson County population projected at -14% by 2050 — secular population decline; favor cash flow + early exit over multi-decade hold.
Negotiation context
- Only 4 days on market — expect competitive offers; lowballing is unlikely to land.
- 4 sale attempts with the ask held roughly flat each time — persistent listings suggest the price (not the market) is what's stuck; bring a comps-based counter.
- Current owner paid $115k; 30% above their basis — modest negotiation headroom, anchor on the comps not their cost.
Risks & watch-outs
- Watch-outs: built in 1925 — expect roof / HVAC / electrical / plumbing capex.
Questions for the listing agent
- What do current leases actually rent for vs. the listed asking? Can we see a recent rent roll and the last 12 months of T-12 income?
- Built in 1925 — when were the roof, HVAC, electrical panel, plumbing, and water heater last replaced?
- Is there a deadline driving the sale (1031 exchange, divorce, estate, relocation)? That informs how much negotiation room exists.
- The area grade is low — what's the realistic commute time and amenity access for the typical tenant pool here? Any planned neighborhood developments (good or bad) we should know about?
- What's the average days-on-market for RENTAL listings here right now (not sales)? A rising rental-DOM trend means longer vacancies and softer asking-rent achievability than the comps imply.
- What's the recent tenant-quality profile in this submarket — average credit score on applications, eviction rate, late-payment / NSF rate, and stable-employment percentage? A property-management company in the area should have these aggregated.
- How much new for-sale + rental construction is in the pipeline within 1–3 miles? Heavy new supply typically softens prices + rents 12–24 months out; constrained supply supports both.
Investment metrics
- 1% rule
- 0.67% ✗
- Cap rate
- 5.51%
- Cash-on-cash
- -2.81%
- DSCR
- 0.88
- GRM
- 12.5
CMA / ARV
- ARV (on-the-fly)
- $158,976
- Comps found
- 12
Show comp detail 12 sales within ~0.75 mi
| Address | Dist | Beds/Ba | Sqft | Sold | Price | $/sf | Match |
|---|---|---|---|---|---|---|---|
| 424 Withworth Ave | 0.09mi | 2/1.0 (-1) | 1,101 (-4%) | 11mo | $118,400 | $108 | 74 |
| 609 Eskil Ave | 0.23mi | 3/1.5 | 1,300 (+13%) | 1mo | $146,000 | $112 | 65 |
| 2216 S Carpenter Ave | 0.50mi | 3/1.0 | 1,232 (+7%) | 1mo | $176,000 | $143 | 64 |
| 624 E Breitung Ave | 0.17mi | 2/1.0 (-1) | 1,056 (-8%) | 11mo | $65,000 | $62 | 64 |
| 421 E Sagola Ave | 0.08mi | 3/1.0 | 988 (-14%) | 14mo | $98,500 | $100 | 61 |
| 840 Superior Ave | 0.64mi | 4/1.5 (+1) | 1,166 (+1%) | 7mo | $45,000 | $39 | 55 |
| 928 Ford St | 0.51mi | 3/1.0 | 1,025 (-11%) | 8mo | $146,500 | $143 | 51 |
| 601 W Breen Ave | 0.56mi | 2/2.0 (-1) | 1,056 (-8%) | 9mo | $229,000 | $217 | 43 |
| 224 Hooper St | 0.66mi | 4/2.0 (+1) | 1,091 (-5%) | 11mo | $193,500 | $177 | 42 |
| 141 Pinehurst St | 0.57mi | 3/1.0 | 980 (-15%) | 9mo | $135,000 | $138 | 41 |
| 232 E Hoadley Ave | 0.49mi | 2/2.0 (-1) | 1,316 (+14%) | 10mo | $191,900 | $146 | 36 |
| 324 Doraland St | 0.74mi | 3/2.0 | 1,014 (-12%) | 11mo | $135,000 | $133 | 33 |
Match score weights: distance 35% · size 25% · config 20% · recency 20%. Top-matched comps best support the ARV.
Projected returns pro-forma
-3.0% appreciation · 3.0% rent growth · sell at horizon
- IRR
- -21.0%
- Equity multiple
- 0.27×
- Total profit
- $-30,615
- Equity at exit
- $22,351
- IRR
- -14.6%
- Equity multiple
- 0.17×
- Total profit
- $-35,010
- Equity at exit
- $12,961
Cash invested: $41,972 (down + closing). Projections, not guarantees.
Landlord ↔ Tenant lean methodology
- Overall (STATE)
- 62 Landlord-Friendly
- State Michigan
- 62 Landlord-Friendly · EVEN
- County
- — inherits STATE
- City
- — inherits STATE
ZIP-level market 49801
- Home prices YoY
- -27.8%
- Active inventory
- 72
- Price-to-rent
- 12.5×
Monthly cashflow live
- Estimated rent
- $1,003 medium interval (Pro) →
- Mortgage (P&I)
- −$786
- Tax from tax record
- −$42 /mo · $501/yr
- Insurance
- −$62
- HOA
- −$0
- Vacancy / Maint / Mgmt
- −$211
- Net cashflow
- $-98
Break-even live
UW: 25.0% down · 7.5% · 30yr · 1.5% tax · 5.0% vac · 8.0% maint · 8.0% mgmt
Financing live
Cash to close
- Down payment
- $37,475
- Closing costs
- $4,497
- Reserves months
- —
- Total cash needed
- —
Loan-product check · same deal, 3 products live
Conventional
25% down · 7.5% · 30yr
- Down + closing
- —
- Monthly P&I
- —
- Monthly cashflow
- —
- DSCR
- —
- Eligible?
- —
Personal DTI + credit; lowest rate.
DSCR
20% down · 8.5% · 30yr
- Down + closing
- —
- Monthly P&I
- —
- Monthly cashflow
- —
- DSCR
- —
- Eligible?
- —
No personal income docs; deal must DSCR.
Hard money
10% down · 12.0% · 12mo
- Down + closing
- —
- Monthly P&I
- —
- Monthly cashflow
- —
- DSCR
- —
- Eligible?
- —
Short-term bridge; refi at stabilization.
Listing history 5 events
-
2026-06-18days on market $149,900 Active 4 DOM
-
2026-06-17days on market $149,900 Active 3 DOM
-
2026-06-16days on market $149,900 Active 2 DOM
-
2026-06-15remarks 402-char remark
-
2026-06-15$149,900 Active 1 DOM
ⓘ Source: listings_history table (triggers on properties + properties_extension) + one-shot
backfill from property_details.listing_events for pre-trigger history.
Tax reassessment forecast MI · Partial reset (capped growth)
- Current annual tax
- $501 · $42/mo
- Projected year-2 tax
- $1,405 · $117/mo
- Expected delta
- +$904/yr (+$75/mo · 180.5%)
ⓘ Screening estimate from a state-policy table — verify with the county assessor before closing.
Nearby sold comps map
Loading sold comps map…
Walkable amenities ~0.75 mi
Loading nearby amenities…
Taxation est. · year 1
- Rental income
- $12,032
- − Mortgage interest
- −$8,397
- − Property taxes
- −$501
- − Insurance
- −$750
- − Repairs & maintenance
- −$963
- − Management
- −$963
- − Depreciation
- −$4,361
- Taxable loss
- −$3,900
- Est. tax savings @ 24.0%
- +$936
- After-tax cash flow
- $-242/yr
For passive investors: Depreciation is non-cash, so a rental often shows a tax loss while cash-flowing — sheltering income. Rental losses are passive: they offset passive income freely, and up to $25,000/yr can offset ordinary (W-2) income if you actively participate and your MAGI is under $100k (phasing out to $0 by $150k); unused losses carry forward. On sale, claimed depreciation is recaptured at up to 25%, and gains may owe capital-gains tax (a 1031 exchange can defer both). Figures are a year-1 estimate at your 24.0% rate — not tax advice; consult a CPA.
Schools (NCES district)
- District
- Breitung Township School District
- NCES district ID
- 2606720
- Math proficiency
- 39% ▼ -3.00%
- Reading proficiency
- 55% ▲ 1.00%
- Median HH income
- $45,413
- Composite
- 39.8/100
- National rank
- #3878
- State rank
- #130 of 540 in MI
Livability — Breitung
No livability data for this city. (Only ~50 U.S. cities are tracked.)
Census & demographics
- Population (ZIP)
- 11,606
Population outlook (Dickinson County) Hauer SSP2
- Today (2025)
- 25,175 people
- By 2030
- 24,647 · -2.1%
- By 2040
- 23,176 · -7.9%
- By 2050
- 21,605 · -14.2%
- By 2075
- 18,429 · -26.8%
- By 2100
- 14,394 · -42.8%
Race, ethnicity, and origin ACS 2023
- Neighborhood character
- Predominantly White (93%)
- Race & ethnicity
- White 93% Two or more races 3% Hispanic / Latino 2% Black 1% Native American 1%
- Common ancestry
- Lithuanian 8% Romanian 7% Portuguese 3%
- Foreign-born
- 2% · Canada
- Languages at home
- 98% English-only · Other Indo-European 1%
Political lean MEDSL · Dickinson
- 2024 margin
- Solid R (+36.3) · D 31.1% · R 67.4% · Other 1.5%
- 2008→2024 swing
- -28.4pp toward R · 2008: -7.9pp · 2024: -36.3pp
- All cycles
- 2024: R+36.3 2020: R+33.4 2016: R+35.4 2012: R+21.4 2008: R+7.9
Not yet ingested
- Civics
- —
Market trends
- HPI YoY
- ▼ -73.55%
- Current HPI
- 191.087
- Rent YoY
- —
- Metro
- —
- State GDP YoY
- ▲ 1.37%
- F500 in state
- 28
Industry mix (Fortune 500 HQ in MI)
| Industry | F500 HQs | Revenue |
|---|---|---|
| Automotive Parts | 3 | $48B |
|
||
| Automotive | 2 | $372B |
|
||
| Chemicals | 1 | $45B |
|
||
| Automotive Retail | 1 | $29B |
|
||
| Healthcare / Medical Devices | 1 | $23B |
|
||
| Automotive Technology | 1 | $20B |
|
||
Price history
+30.3% since first listed8 events — show timeline
- 2026-06-14 Listed $149,900 MiRealSource-MiMLS
- 2026-06-14 Listed $149,900 UPAR
- 2026-03-18 Listing Removed — MiRealSource-MiMLS
- 2025-12-12 Price Changed $150,000 MiRealSource-MiMLS
- 2025-12-11 Price Changed $150,000 UPAR
- 2025-09-17 Listed $159,900 MiRealSource-MiMLS
- 2025-09-17 Listed $159,900 UPAR
- 2022-09-16 Sold (Public Records) $115,000 Public Records
Property tax history
+0.7%/yrLatest (2025): $501 · -31.1% YoY. Source: county tax records.
Cash-flow waterfall
monthlySold comps — $/sqft
last 12 mo · ≤1 miLoading sold comps…