 Multi-family
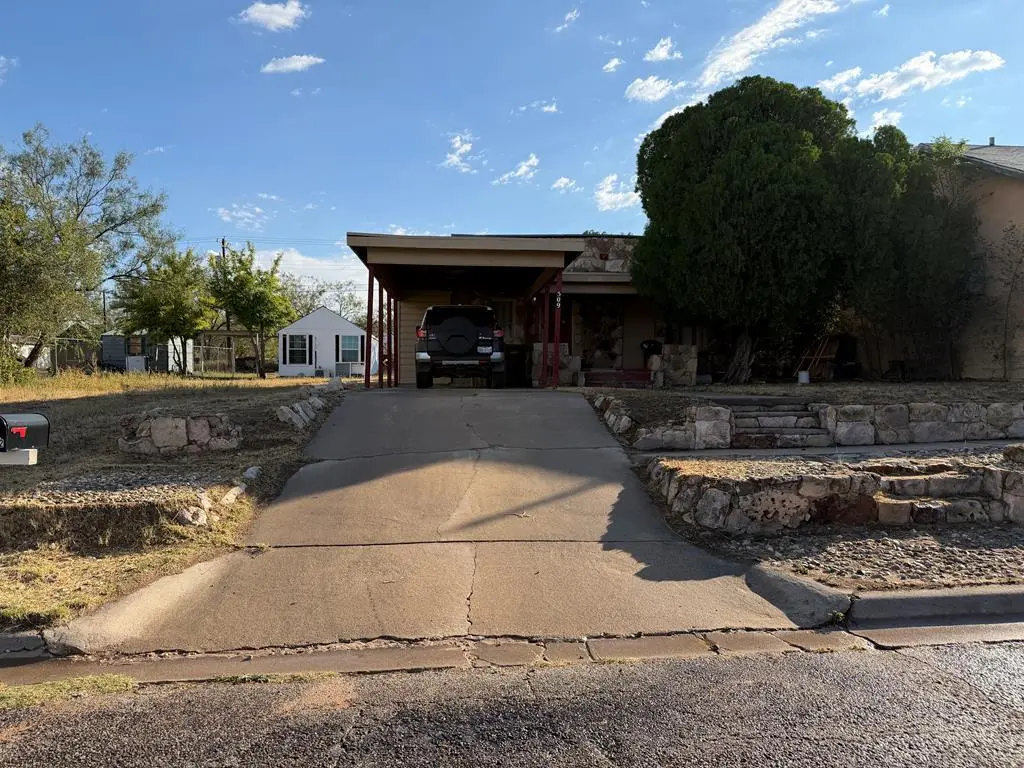
509 S Bell St · Big Spring, TX
Flood risk 1/10 · Minimal
- FEMA flood zone
- X (unshaded)
- Chance of flooding over 30 yrs
- 0.0%
- Est. flood insurance / yr
- $507 – $1,088
Fire risk 9/10 · Severe
- Est. fire insurance / yr
- $1,222 – $2,270
Heat risk 6/10 · Moderate
- Hot days now (above 102°F)
- 7 days/yr
- Hot days in 30 yrs
- 22 days/yr
Wind risk 2/10 · Minimal
- Chance of severe wind over 30 yrs
- 3.0%
Air-quality risk 1/10 · Minimal
- Unhealthy air days now
- 0 days/yr
- Unhealthy air days in 30 yrs
- 0 days/yr
Risk factors via First Street. Map © Google.
Why this score? — see what drove the B- grade
The composite is a weighted blend of 9 inputs, each scored 0–100. Each bar is that input's sub-score; the figure is the points it added to the 100-point composite (weight × sub-score).
- Cash flow +30.0/30.0
- 1% rule +10.0/10.0
- DSCR +10.0/10.0
- ARV discount +7.5/15.0
- Livability +3.1/5.0
- Rent growth +2.5/5.0
- Schools +2.5/10.0
- Condition / age +2.2/5.0
- Appreciation +0.0/10.0
$139,900
🖨 Deal sheet 📄 Offer letter ✓ Due diligence
Multi-family units
County records classify this as Multi-Family (2-4 Unit). Listing-text estimate: 1 unit. estimate disagrees with records
Listing remarks MLS
Great rock homes with built-in income generating ALREADY! The front house has been nicely updated and is absolutely charming — featuring 2 bedrooms, 1 bath, and a convenient washer/dryer hookup right in the kitchen closet. Behind it sits a 1-bedroom efficiency apartment, already rented and generating income! That's two homes on one lot, both rented at market price, making this a fantastic opportunity for investors or anyone looking to hop into the landlord role. Don't miss out on this turnkey rental income property! Cash or straight conventional buyers only.
Key facts
- Efficiency apartment
- Updated
- Washer dryer hookup
Tags
Neighborhood map
What this means for you Summary
Snapshot
- This is a 2-bed/2.0-bath multifamily listed at $140k. Condition is rated fair.
Deal economics
- At list price, monthly cash flow is $1k ($12k/yr) — positive.
- The deal already cash-flows at list — no discount required.
- Meets the 1% rule at list price ($3k rent vs $140k).
- Recommended offer: $123k (12.0% below list) — sets the bar for market timing.
Location & tenants
- Location reads 62/100 on livability (#948 in TX) — a middle-class / working-renter tenant base. Strengths: cost of living A+, housing A+, health & safety A+; Watch: employment C-, schools F, crime F.
- Big Spring ISD (town): math 29% / reading 30% proficiency, ranked #641 of 826 in TX (top 78%) — low school quality limits family demand, transient renter base, plan for 1-2y turnover; 63% free/reduced lunch — lower-income household profile, screen leases tightly.
- Market conditions: 266 active listings in the ZIP; 11 comparable units currently listed for rent nearby; rentals at typical pace (median 24d on market — plan ~3-4 weeks tenant-placement turnaround); 69 units permitted in Howard County in 2024 (5 in 5+ unit buildings).
- This rent runs 44% of the median local income ($69k/yr) — at the standard rent-burdened threshold; future hikes will face affordability resistance.
Forward outlook
- Local home prices are declining (-3.0%/yr); year-one equity from $967 of loan paydown is wiped out by about $4k of value loss. Plan a longer hold.
- Howard County population projected at +42% by 2050 — long-run rental-demand tailwind backs the buy-and-hold thesis.
- At projected returns (-3.0% appreciation + 3.0% rent growth), your $39k cash investment doubles in ~4 years — after that, you're playing with house money.
Negotiation context
- It's been on market 298 days — a 12% lower offer ($123k) is reasonable based on typical stale-listing flexibility.
Risks & watch-outs
- Watch-outs: built in 1940 — expect roof / HVAC / electrical / plumbing capex.
- Climate carrying-cost: severe wildfire risk; extreme-heat days projected 7→22/yr by 2055 (HVAC capex compounding) — expect insurance premiums to compound above CPI over the hold.
Questions for the listing agent
- It's been on market 298 days. Have you received any prior offers? Is the seller open to a 12% concession, seller financing, or rate buy-down credit?
- Have any recent inspections been done? Can we get a copy of the seller's disclosures and any deferred-maintenance estimates?
- Built in 1940 — when were the roof, HVAC, electrical panel, plumbing, and water heater last replaced?
- Why hasn't it sold? Are there any deal-killer items the seller is aware of (foundation, flood, title, zoning, code violations)?
- Is there a deadline driving the sale (1031 exchange, divorce, estate, relocation)? That informs how much negotiation room exists.
- Schools are F-rated, which usually means shorter tenancies and higher turnover. Who's the typical renter profile here, and what's been the actual vacancy rate?
- Crime grade is F in this area — have there been break-ins, vandalism, or insurance claims at this property in the last 3 years? What carrier currently insures it and at what premium?
- What's the average days-on-market for RENTAL listings here right now (not sales)? A rising rental-DOM trend means longer vacancies and softer asking-rent achievability than the comps imply.
- What's the recent tenant-quality profile in this submarket — average credit score on applications, eviction rate, late-payment / NSF rate, and stable-employment percentage? A property-management company in the area should have these aggregated.
- How much new apartment / multifamily construction is in the pipeline within 1–3 miles? Heavy new supply (>2% of stock underway) typically softens rents 12–24 months out; light construction supports rent growth.
Investment metrics
- 1% rule
- 1.80% ✓
- Cap rate
- 15.06%
- Cash-on-cash
- 31.32%
- DSCR
- 2.39
- GRM
- 4.6
CMA / ARV
No comps found within radius.
Projected returns pro-forma
-3.0% appreciation · 3.0% rent growth · sell at horizon
- IRR
- 26.2%
- Equity multiple
- 2.08×
- Total profit
- $42,486
- Equity at exit
- $20,860
- IRR
- 33.8%
- Equity multiple
- 4.09×
- Total profit
- $120,999
- Equity at exit
- $12,096
Cash invested: $39,172 (down + closing). Projections, not guarantees.
Landlord ↔ Tenant lean methodology
- Overall (STATE)
- 87 Strongly Landlord-Friendly
- State Texas
- 87 Strongly Landlord-Friendly · R+5
- County
- — inherits STATE
- City
- — inherits STATE
ZIP-level market 79720
- Active inventory
- 266
- Price-to-rent
- 9.0×
Monthly cashflow live
- Estimated rent
- $2,518 medium interval (Pro) →
- Mortgage (P&I)
- −$734
- Tax est. 1.5%
- −$175 /mo · $2,098/yr
- Insurance
- −$58
- HOA
- −$0
- Vacancy / Maint / Mgmt
- −$529
- Net cashflow
- $1,022
Break-even live
2-unit breakdown (identical units grouped — click to expand)
| Units | Beds | Baths | Est. rent |
|---|---|---|---|
| 1× unit | 2 | 1 | $1,294 |
| 1× unit | 1 | 1 | $1,224 |
| Total (2 units) | $2,518 | ||
UW: 25.0% down · 7.5% · 30yr · 1.5% tax · 5.0% vac · 8.0% maint · 8.0% mgmt
Financing live
Cash to close
- Down payment
- $34,975
- Closing costs
- $4,197
- Reserves months
- —
- Total cash needed
- —
Loan-product check · same deal, 3 products live
Conventional
25% down · 7.5% · 30yr
- Down + closing
- —
- Monthly P&I
- —
- Monthly cashflow
- —
- DSCR
- —
- Eligible?
- —
Personal DTI + credit; lowest rate.
DSCR
20% down · 8.5% · 30yr
- Down + closing
- —
- Monthly P&I
- —
- Monthly cashflow
- —
- DSCR
- —
- Eligible?
- —
No personal income docs; deal must DSCR.
Hard money
10% down · 12.0% · 12mo
- Down + closing
- —
- Monthly P&I
- —
- Monthly cashflow
- —
- DSCR
- —
- Eligible?
- —
Short-term bridge; refi at stabilization.
Rent comps 11 comps
| Address | Beds | Baths | Sqft | Rent | $/sqft | DOM | Units | Dist |
|---|---|---|---|---|---|---|---|---|
| 711 Abrams St Big Spring, TX | 1.0 | 1.5 | 1096 | $1,300 | $1.19 | 24d | 1 | 0.23mi |
| 816 W 7th St Big Spring, TX | 2.0 | 1.0 | 891 | $1,300 | $1.46 | 43d | 1 | 0.29mi |
| 902 Scurry St Unit F Big Spring, TX | 3.0 | 1.0 | 975 | $1,000 | $1.03 | 20d | 1 | 0.34mi |
| 406 Goliad St Big Spring, TX | 3.0 | 1.0 | 1092 | $2,500 | $2.29 | 24d | 1 | 0.57mi |
| 614 Ridgelea Dr Big Spring, TX | 3.0 | 1.0 | 1100 | $1,280 | $1.16 | 4d | 1 | 0.95mi |
| 2111 Runnels St Unit 1 Big Spring, TX | 3.0 | 1.0 | 1216 | $1,300 | $1.07 | 12d | 1 | 1.19mi |
| 2111 Runnels St Unit 1 Big Spring, TX | 3.0 | 1.0 | 1216 | $1,400 | $1.15 | 43d | 1 | 1.19mi |
| 1009 E 15th St Big Spring, TX | 2.0 | 2.0 | 1486 | $1,350 | $0.91 | 24d | 1 | 1.22mi |
| 1206 E 11th Pl Big Spring, TX | 3.0 | 2.0 | 1674 | $1,700 | $1.02 | 24d | 1 | 1.27mi |
| 1404 Wood St Big Spring, TX | 3.0 | 1.0 | 964 | $2,500 | $2.59 | 24d | 1 | 1.38mi |
| 801 W Marcy Dr Big Spring, TX | 2.0 | 2.0 | 1276 | $1,166 | $0.91 | 12d | 1 | 1.41mi |
Listing history 17 events
-
2026-06-19days on market $139,900 Active 298 DOM
-
2026-06-18days on market $139,900 Active 297 DOM
-
2026-06-17days on market $139,900 Active 296 DOM
-
2026-06-16days on market $139,900 Active 295 DOM
-
2026-06-15days on market $139,900 Active 294 DOM
-
2026-06-14days on market $139,900 Active 292 DOM
-
2026-06-12days on market $139,900 Active 291 DOM
-
2026-06-09days on market $139,900 Active 288 DOM
-
2026-06-08days on market $139,900 Active 287 DOM
-
2026-06-07days on market $139,900 Active 286 DOM
-
2026-06-05days on market $139,900 Active 283 DOM
-
2026-06-02days on market $139,900 Active 281 DOM
-
2026-06-01days on market $139,900 Active 280 DOM
-
2026-05-31days on market $139,900 Active 279 DOM
-
2026-05-30days on market $139,900 Active 278 DOM
-
2026-03-16price $139,900 570-char remark
Show marketing remark (570 chars)
Great rock homes with built-in income generating ALREADY! The front house has been nicely updated and is absolutely charming — featuring 2 bedrooms, 1 bath, and a convenient washer/dryer hookup right in the kitchen closet. Behind it sits a 1-bedroom efficiency apartment, already rented and generating income! That's two homes on one lot, both rented at market price, making this a fantastic opportunity for investors or anyone looking to hop into the landlord role. Don't miss out on this turnkey rental income property! Cash or straight conventional buyers only.
-
2025-08-25$150,000 Active 570-char remark
Show marketing remark (570 chars)
Great rock homes with built-in income generating ALREADY! The front house has been nicely updated and is absolutely charming — featuring 2 bedrooms, 1 bath, and a convenient washer/dryer hookup right in the kitchen closet. Behind it sits a 1-bedroom efficiency apartment, already rented and generating income! That's two homes on one lot, both rented at market price, making this a fantastic opportunity for investors or anyone looking to hop into the landlord role. Don't miss out on this turnkey rental income property! Cash or straight conventional buyers only.
ⓘ Source: listings_history table (triggers on properties + properties_extension) + one-shot
backfill from property_details.listing_events for pre-trigger history.
Climate risk First Street
- Flood 1/10 Low FEMA zone X (unshaded) · 0% chance over 30 yrs
- Wildfire 9/10 Extreme
- Heat 6/10 Major 7 d/yr ≥102°F today · 22 d/yr by 30 yrs out
- Wind 2/10 Low 3% chance of damaging wind over 30 yrs
- Air quality 1/10 Low 0 unhealthy d/yr today · 0 by 30 yrs out
Nearby sold comps map
Loading sold comps map…
Walkable amenities ~0.75 mi
Loading nearby amenities…
Taxation est. · year 1
- Rental income
- $30,216
- − Mortgage interest
- −$7,837
- − Property taxes
- −$2,098
- − Insurance
- −$700
- − Repairs & maintenance
- −$2,417
- − Management
- −$2,417
- − Depreciation
- −$4,070
- Taxable income
- $10,677
- Est. tax owed @ 24.0%
- −$2,562
- After-tax cash flow
- $9,706/yr
For passive investors: Depreciation is non-cash, so a rental often shows a tax loss while cash-flowing — sheltering income. Rental losses are passive: they offset passive income freely, and up to $25,000/yr can offset ordinary (W-2) income if you actively participate and your MAGI is under $100k (phasing out to $0 by $150k); unused losses carry forward. On sale, claimed depreciation is recaptured at up to 25%, and gains may owe capital-gains tax (a 1031 exchange can defer both). Figures are a year-1 estimate at your 24.0% rate — not tax advice; consult a CPA.
Condition & rehab AI · 9 photos
This property presents as a moderate rehab opportunity with average condition. It has two homes on one lot, generating rental income, but requires updates to kitchen, bathrooms, exterior, and landscaping to increase its value.
Repairs flagged
- Minor Kitchen countertops — Dirty and need cleaning.
- Minor Bathroom fixtures — Need cleaning and minor repairs.
- Moderate Exterior siding — Worn and could benefit from repainting or replacement.
- Moderate Foundation cracks — Visible cracks in foundation need inspection and repair if needed.
- Moderate HVAC system — Could be inspected for efficiency and potential repairs.
Value-add opportunities
- Both Paint exterior siding — Fresh paint can improve curb appeal and home value.
- Both Replace worn flooring — New flooring can improve both resale and rental value.
- Both Upgrade kitchen cabinets — Modern cabinets can significantly increase both resale and rental value.
- Both Replace bathroom fixtures — Upgraded fixtures can improve both resale and rental value.
- Both Landscaping and curb appeal — Improved landscaping can increase both resale and rental value.
Renovation cost estimate screening
| Repair item | Severity | Est. cost |
|---|---|---|
| Kitchen countertops · Dirty and need cleaning. | Minor | $500–3,000 |
| Bathroom fixtures · Need cleaning and minor repairs. | Minor | $500–3,000 |
| Exterior siding · Worn and could benefit from repainting or replacement. | Moderate | $3,000–15,000 |
| Foundation cracks · Visible cracks in foundation need inspection and repair if needed. | Moderate | $3,000–15,000 |
| HVAC system · Could be inspected for efficiency and potential repairs. | Moderate | $3,000–15,000 |
| Total estimated repair cost · 5 items | $10,000–51,000 |
Value-add ROI direction
- Both Paint exterior siding — Fresh paint can improve curb appeal and home value. ↑
- Both Replace worn flooring — New flooring can improve both resale and rental value. ↑
- Both Upgrade kitchen cabinets — Modern cabinets can significantly increase both resale and rental value. ↑
- Both Replace bathroom fixtures — Upgraded fixtures can improve both resale and rental value. ↑
- Both Landscaping and curb appeal — Improved landscaping can increase both resale and rental value. ↑
ⓘ Cost ranges are severity-bucket heuristics (US national rule-of-thumb). Get contractor quotes + a written scope before underwriting a rehab budget.
Schools (NCES district)
- District
- Big Spring ISD
- NCES district ID
- 4810200
- Math proficiency
- 29% ▼ -1.00%
- Reading proficiency
- 30% ▲ 4.00%
- Median HH income
- $42,916
- Composite
- 25.11/100
- National rank
- #7529
- State rank
- #641 of 826 in TX
Livability — Big Spring
- Score
- 62/100
- State rank
- #948
- US rank
- #16886
Category grades
Schools grade is shown separately in the Schools card above.
Census & demographics
- Census place
- Big Spring, TX
- County
- Howard County · 29,936 people
- City population
- 29,936
- Metro
- Big Spring, TX
- Population (ZIP)
- 29,936
- Household income
- $68,785
- Rent vs Own
- Severe rent burden
- 638.0
Population outlook (Howard County) Hauer SSP2
- Today (2025)
- 43,396 people
- By 2030
- 46,792 · +7.8%
- By 2040
- 54,096 · +24.7%
- By 2050
- 61,707 · +42.2%
- By 2075
- 79,809 · +83.9%
- By 2100
- 87,385 · +101.4%
Race, ethnicity, and origin ACS 2023
- Neighborhood character
- Diverse neighborhood (Simpson 0.59)
- Race & ethnicity
- Hispanic / Latino 45% White 45% Two or more races 17% Black 5% Asian 1%
- Hispanic origin (detail)
- Mexican 37%
- Common ancestry
- Slovak 1% Italian 1% Lithuanian 1%
- Foreign-born
- 10% · Canada
- Languages at home
- 71% English-only · Spanish 28%
Political lean MEDSL · Howard
- 2024 margin
- Solid R (+62.8) · D 18.2% · R 81.1%
- 2008→2024 swing
- -16.6pp toward R · 2008: -46.3pp · 2024: -62.8pp
- All cycles
- 2024: R+62.8 2020: R+58.4 2016: R+56.0 2012: R+58.2 2008: R+46.3
Not yet ingested
- Civics
- —
Market trends
- HPI YoY
- ▼ -207.13%
- Current HPI
- 140.8159
- Rent YoY
- —
- Metro
- Big Spring, TX
- State GDP YoY
- ▲ 3.95%
- F500 in state
- 110
Industry mix (Fortune 500 HQ in TX)
| Industry | F500 HQs | Revenue |
|---|---|---|
| Energy | 16 | $1,198B |
|
||
| Technology | 5 | $198B |
|
||
| Engineering / Construction | 4 | $72B |
|
||
| Energy Services | 3 | $60B |
|
||
| Utilities | 3 | $41B |
|
||
| Healthcare | 2 | $330B |
|
||
Price history
-6.7% since first listed2 events — show timeline
- 2026-03-16 Price Changed $139,900 PBBOR
- 2025-08-25 Listed $150,000 PBBOR
Cash-flow waterfall
monthlySold comps — $/sqft
last 12 mo · ≤1 miLoading sold comps…