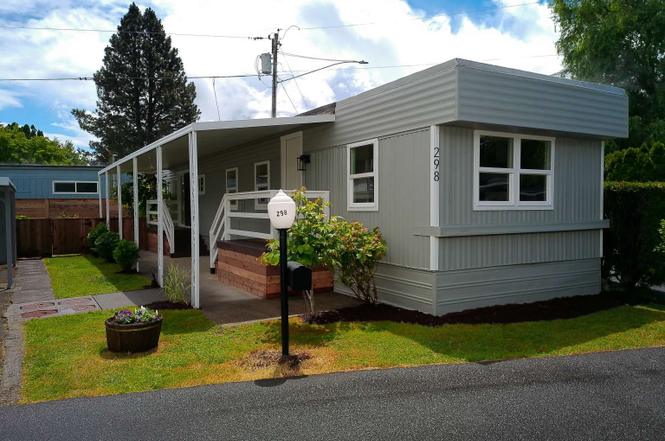
16745 SE Division St #298 · Portland, OR
Flood risk 1/10 · Minimal
- FEMA flood zone
- X (unshaded)
- Chance of flooding over 30 yrs
- 0.0%
- Est. flood insurance / yr
- $507 – $1,088
Fire risk 4/10 · Minor
- Est. fire insurance / yr
- $498 – $926
Heat risk 3/10 · Minor
- Hot days now (above 92°F)
- 7 days/yr
- Hot days in 30 yrs
- 15 days/yr
Wind risk 1/10 · Minimal
- Chance of severe wind over 30 yrs
- —
Air-quality risk 10/10 · Severe
- Unhealthy air days now
- 23 days/yr
- Unhealthy air days in 30 yrs
- 27 days/yr
Risk factors via First Street. Map © Google.
Why this score? — see what drove the C+ grade
The composite is a weighted blend of 9 inputs, each scored 0–100. Each bar is that input's sub-score; the figure is the points it added to the 100-point composite (weight × sub-score).
- Cash flow +30.0/30.0
- 1% rule +10.0/10.0
- DSCR +10.0/10.0
- Livability +3.9/5.0
- Schools +3.5/10.0
- Rent growth +2.9/5.0
- Condition / age +2.5/5.0
- ARV discount +0.0/15.0
- Appreciation +0.0/10.0
$55,000
🖨 Deal sheet 📄 Offer letter ✓ Due diligence
Listing remarks
Stunning two bedroom one bathroom 672 sq ft 55+ manufactured home that is move in ready and very affordable, with a lot rent of $995. Completely redone from inside and out offering you that peace of mind. On the outside you'll find newer windows, fresh paint, new fully enclosed fenced yard, tasteful mature landscaping and great for gardening. The deep driveway and two sheds provide great convenience. The interior showcases new flooring, trim, paint, and an updated kitchen with gorgeous tile backsplash, bar seating, stainless steel appliances, a pantry and tasteful finishes. The bathroom was also completely redone and comes with stackable washer and dryer for extra convenience. The home also
Key facts
- Fresh paint
- Newer windows
- Mature landscaping
Tags
Property features AI
Finance
- Other: Corner, level and secluded lot on paved/concrete roads
- Financial info: Land lease (lot rent $995 monthly); land lease ends July 31, 2026
- HOA & community: Community amenities include lap pool, laundry facilities, meeting room and party room; Not a senior-only community
Exterior
- Utilities: Public water; Public sewer; Electric service
- Home design: Manufactured home in a park; Updated/remodeled; Single-story entry (one-level living); No significant view
- Construction: Built in 1968; Public building area 672; Foundation and structural details not specified
- Exterior features: Aluminum siding; Lap siding; Metal siding; Wood siding
Interior
- Kitchen: Built-in oven; Built-in range; Cook island; Free-standing range; Built-in refrigerator; Microwave; Pantry; Double sinks; Eating area; Island; Stainless steel appliances
- Bedrooms: Primary bedroom (lower level); Second bedroom (main level)
- Bathrooms: One full bathroom (main level)
- Heating & cooling: Heat pump; Mini-split heating; Central air conditioning
- Interior features: Accessible, one-level living; Vinyl-framed windows
- Laundry & utility: Electric hot water
Neighborhood map
What this means for you Summary
Snapshot
- This is a 2-bed/1.0-bath manufactured listed at $55k.
Deal economics
- At list price, monthly cash flow is $649 ($8k/yr) — positive.
- The deal already cash-flows at list — no discount required.
- Meets the 1% rule at list price ($1k rent vs $55k).
- Cap rate 20.4% vs local median 2.2% in Portland — top-decile yield for the area; either an underpriced asset or a hidden risk that comps aren't pricing in. Stress-test before assuming the spread holds.
Location & tenants
- Location reads 77/100 on livability (#72 in OR, #3,256 nationally) — a middle-class / working-renter tenant base. Strengths: amenities A+, commute A+, health & safety A+; Watch: crime F, cost of living F.
- Centennial SD 28J (suburban): math 31% / reading 43% proficiency, ranked #125 of 183 in OR (top 68%) — families likely to look elsewhere, expect single-tenant / working-renter base with shorter leases.
- Zoned schools: Oliver Middle (457 students, 69% FRL); Centennial High School (1,756 students, 65% FRL).
- Market conditions: Rents rising (+1.6%/yr); 204 active listings in the ZIP; 40 comparable units currently listed for rent nearby; rentals at typical pace (median 24d on market — plan ~3-4 weeks tenant-placement turnaround); 42% of comp listings sitting > 30 days — soft ceiling on asking rent; solid renter incomes; 2,041 units permitted in Multnomah County in 2024 (905 in 5+ unit buildings).
Forward outlook
- Local home prices are declining (-3.0%/yr); year-one equity from $380 of loan paydown is wiped out by about $2k of value loss. Plan a longer hold.
- Multnomah County population projected at +33% by 2050 — long-run rental-demand tailwind backs the buy-and-hold thesis.
- At projected returns (-3.0% appreciation + 1.6% rent growth), your $15k cash investment doubles in ~3 years — after that, you're playing with house money.
Negotiation context
- Only 8 days on market — expect competitive offers; lowballing is unlikely to land.
Questions for the listing agent
- Built in 1968 — when were the roof, HVAC, electrical panel, plumbing, and water heater last replaced?
- Is there a deadline driving the sale (1031 exchange, divorce, estate, relocation)? That informs how much negotiation room exists.
- Crime grade is F in this area — have there been break-ins, vandalism, or insurance claims at this property in the last 3 years? What carrier currently insures it and at what premium?
- What's the average days-on-market for RENTAL listings here right now (not sales)? A rising rental-DOM trend means longer vacancies and softer asking-rent achievability than the comps imply.
- What's the recent tenant-quality profile in this submarket — average credit score on applications, eviction rate, late-payment / NSF rate, and stable-employment percentage? A property-management company in the area should have these aggregated.
- How much new for-sale + rental construction is in the pipeline within 1–3 miles? Heavy new supply typically softens prices + rents 12–24 months out; constrained supply supports both.
Investment metrics
- 1% rule
- 2.37% ✓
- Cap rate
- 20.44%
- Cash-on-cash
- 50.54%
- DSCR
- 3.25
- GRM
- 3.5
CMA / ARV
- ARV (on-the-fly)
- $47,040
- Comps found
- 8
Show comp detail 8 sales within ~0.75 mi
| Address | Dist | Beds/Ba | Sqft | Sold | Price | $/sf | Match |
|---|---|---|---|---|---|---|---|
| 16901 SE Division St #74 | 0.05mi | 1/1.0 (-1) | 688 (+2%) | 2mo | $29,500 | $43 | 87 |
| 16901 SE Division St #56 | 0.05mi | 1/1.0 (-1) | 640 (-5%) | 1mo | $45,000 | $70 | 84 |
| 16901 SE Division St | 0.06mi | 1/1.0 (-1) | 640 (-5%) | 1mo | $45,000 | $70 | 83 |
| 16745 SE Division St | 0.07mi | 2/1.0 | 672 (0%) | 22mo | $35,000 | $52 | 78 |
| 16901 SE Division St #43 | 0.05mi | 2/1.0 | 756 (+12%) | 5mo | $85,000 | $112 | 73 |
| 16901 SE Division St #50 | 0.05mi | 2/1.0 | 576 (-14%) | 5mo | $34,000 | $59 | 70 |
| 16901 SE Division St #60 | 0.05mi | 2/1.0 | 768 (+14%) | 8mo | $63,000 | $82 | 67 |
| 16901 SE Division St #34 | 0.06mi | 2/1.0 | 750 (+12%) | 19mo | $44,500 | $59 | 62 |
Match score weights: distance 35% · size 25% · config 20% · recency 20%. Top-matched comps best support the ARV.
Projected returns pro-forma
-3.0% appreciation · 1.64% rent growth · sell at horizon
- IRR
- 46.8%
- Equity multiple
- 2.99×
- Total profit
- $30,656
- Equity at exit
- $8,201
- IRR
- 51.9%
- Equity multiple
- 5.74×
- Total profit
- $72,944
- Equity at exit
- $4,755
Cash invested: $15,400 (down + closing). Projections, not guarantees.
Landlord ↔ Tenant lean methodology
- Overall (CITY)
- 0 Strongly Tenant-Friendly
- State Oregon
- 28 Tenant-Leaning · D+6
- County
- — inherits STATE
- City Portland
- 0 Strongly Tenant-Friendly · D+39
ZIP-level market 97236
- Rents YoY
- 1.6%
- Active inventory
- 204
- Price-to-rent
- 3.5×
Monthly cashflow live
- Estimated rent
- $1,302 high interval (Pro) →
- Mortgage (P&I)
- −$288
- Tax est. 1.5%
- −$69 /mo · $825/yr
- Insurance
- −$23
- HOA
- −$0
- Vacancy / Maint / Mgmt
- −$273
- Net cashflow
- $649
Break-even live
UW: 25.0% down · 7.5% · 30yr · 1.5% tax · 5.0% vac · 8.0% maint · 8.0% mgmt
Financing live
Cash to close
- Down payment
- $13,750
- Closing costs
- $1,650
- Reserves months
- —
- Total cash needed
- —
Loan-product check · same deal, 3 products live
Conventional
25% down · 7.5% · 30yr
- Down + closing
- —
- Monthly P&I
- —
- Monthly cashflow
- —
- DSCR
- —
- Eligible?
- —
Personal DTI + credit; lowest rate.
DSCR
20% down · 8.5% · 30yr
- Down + closing
- —
- Monthly P&I
- —
- Monthly cashflow
- —
- DSCR
- —
- Eligible?
- —
No personal income docs; deal must DSCR.
Hard money
10% down · 12.0% · 12mo
- Down + closing
- —
- Monthly P&I
- —
- Monthly cashflow
- —
- DSCR
- —
- Eligible?
- —
Short-term bridge; refi at stabilization.
Rent comps 40 comps
| Address | Beds | Baths | Sqft | Rent | $/sqft | DOM | Units | Dist |
|---|---|---|---|---|---|---|---|---|
| 16804 SE Division St Unit 3 Portland, OR | 1.0 | 1.0 | 475 | $1,200 | $2.53 | 4d | 1 | 0.20mi |
| 2675 SE 162nd Ave Portland, OR | 1.0–2.0 | 1.0 | 689 | $1,495 | $2.17 | 12d | 1 | 0.42mi |
| 17726 SE Division St Portland, OR | 1.0–2.0 | 1.0–1.5 | 788 | $1,575 | $2.00 | 11d | 3 | 0.57mi |
| 17924 SE Division St Portland, OR | 2.0–3.0 | 1.0 | 770 | $1,349 | $1.75 | 43d | 3 | 0.65mi |
| 15301-15353 SE Division St Unit 15335 Portland, OR | 1.0 | 1.0 | 600 | $1,150 | $1.92 | 23d | 1 | 0.72mi |
| 16124 SE Alder St Apt 4 Portland, OR | 1.0 | 1.0 | 750 | $1,100 | $1.47 | 43d | 1 | 0.76mi |
| 16124 SE Alder St Unit 19-B Portland, OR | 1.0 | 1.0 | 500 | $1,050 | $2.10 | 23d | 1 | 0.76mi |
| 650 SE 162nd Ave Portland, OR | 1.0–2.0 | 1.0 | 745 | $1,349 | $1.81 | 2d | 9 | 0.79mi |
| 17455 SE Washington Ct Portland, OR | 1.0 | 1.0 | 681 | $1,295 | $1.90 | 7d | 2 | 0.83mi |
| 14992 SE Division St Unit 1 Bedroom Portland, OR | 1.0 | 1.0 | 543 | $999 | $1.84 | 43d | 1 | 0.93mi |
| 14992 SE Division St Portland, OR | 1.0–3.0 | 1.0 | 726 | $1,174 | $1.62 | 16d | 3 | 0.93mi |
| 16025 SE Stark St Portland, OR | 1.0 | 1.0 | 629 | $1,034 | $1.64 | 43d | 1 | 0.94mi |
| 15847 SE Stark St Portland, OR | 1.0–2.0 | 1.0 | 750 | $1,295 | $1.73 | 43d | 4 | 0.97mi |
| 17920 SE Stark St Unit 4 Portland, OR | 1.0 | 1.0 | 560 | $1,150 | $2.05 | 43d | 1 | 1.01mi |
| 635 SE 182nd Ave Unit 669 Portland, OR | 1.0 | 1.0 | 600 | $1,150 | $1.92 | 23d | 1 | 1.05mi |
| 16503 E Burnside St Portland, OR | 1.0–3.0 | 1.0 | 797 | $1,195 | $1.50 | 43d | 1 | 1.06mi |
| 15340 SE Stark St Unit 15370 Portland, OR | 1.0 | 1.0 | 550 | $1,200 | $2.18 | 43d | 1 | 1.07mi |
| 17528 E Burnside St Portland, OR | 2.0 | 1.0–1.5 | 655 | $1,749 | $2.67 | 16d | 5 | 1.09mi |
| 17376 NE Couch St Portland, OR | 1.0 | 1.0 | 724 | $1,150 | $1.59 | 43d | 1 | 1.11mi |
| 10 NE 162nd Ave Portland, OR | 1.0–2.0 | 1.0 | 950 | $1,325 | $1.39 | 11d | 5 | 1.11mi |
| 123 NE 172nd Ave Portland, OR | 1.0 | 1.0 | 600 | $1,095 | $1.82 | 43d | 1 | 1.11mi |
| 783 SE 185th Ave Portland, OR | 1.0–3.0 | 1.0–2.0 | 861 | $1,634 | $1.90 | 2d | 10 | 1.11mi |
| 17442 SE Powell Blvd Portland, OR | 2.0 | 1.0 | 729 | $1,075 | $1.47 | 10d | 1 | 1.12mi |
| 17450 SE Powell Blvd Portland, OR | 2.0 | 1.0 | 729 | $1,075 | $1.47 | 20d | 1 | 1.12mi |
| 17468 SE Powell Blvd Portland, OR | 2.0 | 1.0 | 729 | $1,075 | $1.47 | 20d | 1 | 1.12mi |
| 2629 SE 145th Ave Portland, OR | 1.0 | 1.0 | 700 | $1,150 | $1.64 | 43d | 1 | 1.14mi |
| 16047 E Burnside St Unit 16 Portland, OR | 1.0 | 1.0 | 750 | $1,200 | $1.60 | 4d | 1 | 1.14mi |
| 2633 SE 145th Ave Portland, OR | 1.0 | 1.0 | 675 | $1,150 | $1.70 | 43d | 1 | 1.16mi |
| 2609 SE 145th Ave Unit E-39 Portland, OR | 2.0 | 1.0 | 750 | $1,299 | $1.73 | 43d | 1 | 1.22mi |
| 2609 SE 145th Ave Unit F-51 Portland, OR | 1.0 | 1.0 | 642 | $1,222 | $1.90 | 12d | 1 | 1.22mi |
| 2609 SE 145th Ave Unit D-27 Portland, OR | 1.0 | 1.0 | 642 | $1,099 | $1.71 | 12d | 1 | 1.22mi |
| 2609 SE 145th Ave Unit A-09 Portland, OR | 2.0 | 1.0 | 750 | $1,299 | $1.73 | 23d | 1 | 1.22mi |
| 878 SE 187th Ave Unit 131 Portland, OR | 1.0 | 1.0 | 435 | $1,175 | $2.70 | 14d | 1 | 1.22mi |
| 878 SE 187th Ave Unit 107 Portland, OR | 1.0 | 1.0 | 435 | $1,100 | $2.53 | 43d | 1 | 1.22mi |
| 15075 SE Stark St Unit 214 Portland, OR | 1.0 | 1.0 | 597 | $1,095 | $1.83 | 43d | 1 | 1.22mi |
| 746 SE 187th Ave Unit 101 Portland, OR | 1.0 | 1.0 | 500 | $1,195 | $2.39 | 43d | 1 | 1.22mi |
| 17925 E Burnside St Unit 105 Portland, OR | 1.0 | 1.0 | 640 | $1,300 | $2.03 | 43d | 1 | 1.26mi |
| 9700 NE Everett Ct Portland, OR | 1.0 | 1.0 | 494 | $1,250 | $2.53 | 2d | 4 | 1.27mi |
| 125 SE 151st Ave Unit 105 Portland, OR | 1.0 | 1.0 | 518 | $1,095 | $2.11 | 2d | 1 | 1.31mi |
| 18245 E Burnside St Unit 111 Portland, OR | 2.0 | 1.0 | 750 | $1,395 | $1.86 | 16d | 1 | 1.31mi |
Listing history 7 events
-
2026-06-18days on market $55,000 Active 8 DOM
-
2026-06-17days on market $55,000 Active 7 DOM
-
2026-06-16days on market $55,000 Active 6 DOM
-
2026-06-15days on market $55,000 Active 5 DOM
-
2026-06-13days on market $55,000 Active 3 DOM
-
2026-06-13remarks 699-char remark
-
2026-06-13$55,000 Active 2 DOM
ⓘ Source: listings_history table (triggers on properties + properties_extension) + one-shot
backfill from property_details.listing_events for pre-trigger history.
Climate risk First Street
- Flood 1/10 Low FEMA zone X (unshaded) · 0% chance over 30 yrs
- Wildfire 4/10 Moderate
- Heat 3/10 Moderate 7 d/yr ≥92°F today · 15 d/yr by 30 yrs out
- Wind 1/10 Low
- Air quality 10/10 Extreme 23 unhealthy d/yr today · 27 by 30 yrs out
Nearby sold comps map
Loading sold comps map…
Walkable amenities ~0.75 mi
Loading nearby amenities…
Taxation est. · year 1
- Rental income
- $15,625
- − Mortgage interest
- −$3,081
- − Property taxes
- −$825
- − Insurance
- −$275
- − Repairs & maintenance
- −$1,250
- − Management
- −$1,250
- − Depreciation
- −$1,600
- Taxable income
- $7,344
- Est. tax owed @ 24.0%
- −$1,763
- After-tax cash flow
- $6,020/yr
For passive investors: Depreciation is non-cash, so a rental often shows a tax loss while cash-flowing — sheltering income. Rental losses are passive: they offset passive income freely, and up to $25,000/yr can offset ordinary (W-2) income if you actively participate and your MAGI is under $100k (phasing out to $0 by $150k); unused losses carry forward. On sale, claimed depreciation is recaptured at up to 25%, and gains may owe capital-gains tax (a 1031 exchange can defer both). Figures are a year-1 estimate at your 24.0% rate — not tax advice; consult a CPA.
Schools (NCES district)
- District
- Centennial SD 28J
- NCES district ID
- 4102800
- Math proficiency
- 31% ▼ -2.00%
- Reading proficiency
- 43% ▼ -2.00%
- Median HH income
- $49,619
- Composite
- 34.5/100
- National rank
- #10133
- State rank
- #125 of 183 in OR
Livability — Portland
- Score
- 77/100
- State rank
- #72
- US rank
- #3256
Category grades
Schools grade is shown separately in the Schools card above.
Census & demographics
- Census place
- Portland, OR
- County
- Multnomah County · 786,692 people
- City population
- 774,334
- Metro
- Portland-Vancouver-Hillsboro, OR-WA
- Population (ZIP)
- 37,558
- Household income
- $75,090
- Rent vs Own
- Severe rent burden
- 1744.0
Population outlook (Multnomah County) Hauer SSP2
- Today (2025)
- 930,825 people
- By 2030
- 996,904 · +7.1%
- By 2040
- 1,121,379 · +20.5%
- By 2050
- 1,242,124 · +33.4%
- By 2075
- 1,464,431 · +57.3%
- By 2100
- 1,576,181 · +69.3%
Race, ethnicity, and origin ACS 2023
- Neighborhood character
- Diverse neighborhood (Simpson 0.67)
- Race & ethnicity
- White 51% Hispanic / Latino 21% Asian 13% Two or more races 12% Black 9% Pacific Islander 1%
- Hispanic origin (detail)
- Mexican 15% Cuban 1%
- Common ancestry
- Italian 3% Scotch-Irish 2% Subsaharan African 2%
- Foreign-born
- 25% · Canada, Vietnam, China
- Languages at home
- 63% English-only · Spanish 16% Vietnamese 6% Russian/Polish/Slavic 5%
Political lean MEDSL · Multnomah
- 2024 margin
- Solid D (+62.1) · D 79.3% · R 17.2% · Other 3.5%
- 2008→2024 swing
- +6.0pp toward D · 2008: 56.1pp · 2024: 62.1pp
- All cycles
- 2024: D+62.1 2020: D+61.3 2016: D+58.3 2012: D+54.9 2008: D+56.1
Not yet ingested
- Civics
- —
Market trends
- HPI YoY
- ▼ -334.44%
- Current HPI
- 289.931
- Rent YoY
- ▲ 1.64%
- Metro
- Portland-Vancouver-Hillsboro, OR-WA
- State GDP YoY
- ▲ 2.05%
- F500 in state
- 2
Industry mix (Fortune 500 HQ in OR)
| Industry | F500 HQs | Revenue |
|---|---|---|
| Consumer Goods | 1 | $51B |
|
||
Price history
1 event — show timeline
- 2026-06-10 Listed $55,000 RMLS
Property tax history
-31.6%/yrLatest (2015): $6 · +0.0% YoY. Source: county tax records.
Cash-flow waterfall
monthlySold comps — $/sqft
last 12 mo · ≤1 miLoading sold comps…