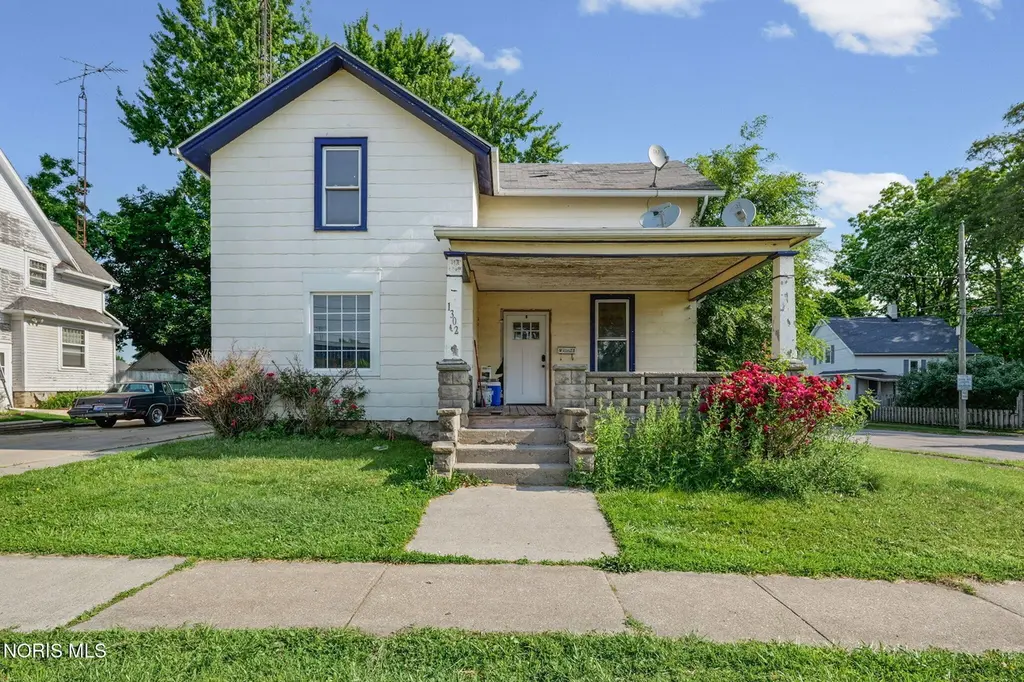
1302 Napoleon St · Fremont, OH
Flood risk 7/10 · Major
- FEMA flood zone
- X (unshaded)
- Chance of flooding over 30 yrs
- 0.75%
- Est. flood insurance / yr
- $473 – $860
Fire risk 1/10 · Minimal
- Est. fire insurance / yr
- $713 – $1,323
Heat risk 3/10 · Minor
- Hot days now (above 99°F)
- 7 days/yr
- Hot days in 30 yrs
- 17 days/yr
Wind risk 2/10 · Minimal
- Chance of severe wind over 30 yrs
- —
Air-quality risk 2/10 · Minimal
- Unhealthy air days now
- 1 days/yr
- Unhealthy air days in 30 yrs
- 1 days/yr
Risk factors via First Street. Map © Google.
Why this score? — see what drove the C+ grade
The composite is a weighted blend of 9 inputs, each scored 0–100. Each bar is that input's sub-score; the figure is the points it added to the 100-point composite (weight × sub-score).
- Cash flow +22.4/30.0
- ARV discount +15.0/15.0
- DSCR +7.2/10.0
- 1% rule +5.4/10.0
- Livability +3.7/5.0
- Schools +3.3/10.0
- Rent growth +2.5/5.0
- Condition / age +2.5/5.0
- Appreciation +0.0/10.0
$120,000
🖨 Deal sheet 📄 Offer letter ✓ Due diligence
Listing remarks MLS
VERY OPEN FLOOR PLAN...SPACIOUS ROOMS! FOUR bedroom-two bedrooms up and two bedrooms down. One bedroom on the main floor could be used as a family room. Wide, oak trim in formal DR. Large landingon the second floor is perfect for a computer area. Large eat-in kitchen-could move laundry area up into the kitchen. Sun porch off one bedroom on second floor.
Key facts
- 6,447 sq ft lot
- Built 1900
- Listed 9 days
Property features AI
Exterior
- Parking: Driveway parking
- Utilities: Cable available; Electricity connected (200+ amp service, circuit breakers); Natural gas connected; Public water; Public sewer
- Home design: Residential single-family home; Two levels
- Construction: Block foundation; Block, wood siding and other construction materials
- Exterior features: Shingle roof; Chain link fencing; Corner lot; City street frontage; Asphalt road
Interior
- Kitchen: Eat-in kitchen; Luxury vinyl plank (LVP) flooring in kitchen
- Bedrooms: Multiple bedrooms on main and upper levels (includes bedrooms with ceiling fans)
- Flooring: Carpet; Laminate / LVP
- Bathrooms: 1 full bathroom
- Heating & cooling: Forced air heating (natural gas); Central air conditioning
- Interior features: Eat-in kitchen; Ceiling fans throughout; Separate shower; Basement
- Laundry & utility: Laundry on main level
Neighborhood map
What this means for you Summary
Snapshot
- This is a 3-bed/1.0-bath single-family listed at $120k.
Deal economics
- At list price, monthly cash flow is $145 ($2k/yr) — positive.
- The deal already cash-flows at list — no discount required.
- Meets the 1% rule at list price ($1k rent vs $120k).
- Cap rate 8.3% vs local median 5.3% in Fremont — top-decile yield for the area; either an underpriced asset or a hidden risk that comps aren't pricing in. Stress-test before assuming the spread holds.
Location & tenants
- Location reads 74/100 on livability (#283 in OH, #4,637 nationally) — a middle-class / working-renter tenant base. Strengths: cost of living A+, housing A+, health & safety A+; Watch: amenities F, commute F, employment F.
- Fremont City (town): math 35% / reading 44% proficiency, ranked #543 of 656 in OH (top 83%) — families likely to look elsewhere, expect single-tenant / working-renter base with shorter leases.
- Zoned schools: Lutz Elementary School (math 52% / reading 48%, grade D+, #900 of 1,584 statewide, top 57%, 400 students, 0% FRL); Fremont Middle School (math 32% / reading 39%, grade F, #544 of 654 statewide, top 83%, 840 students, 56% FRL); Fremont Ross High School (math 17% / reading 45%, grade F, #614 of 781 statewide, top 79%, 1,021 students, 53% FRL) — zoned schools average 36% FRL vs 54% district-wide (17 pts lower); this property's tenant base skews higher-income than the district average.
- Market conditions: 88 active listings in the ZIP; 1 comparable units currently listed for rent nearby; 23 units permitted in Sandusky County in 2024 (0 in 5+ unit buildings).
Forward outlook
- Local home prices are declining (-3.0%/yr); year-one equity from $830 of loan paydown is wiped out by about $4k of value loss. Plan a longer hold.
- Sandusky County population projected at -17% by 2050 — secular population decline; favor cash flow + early exit over multi-decade hold.
Negotiation context
- Only 9 days on market — expect competitive offers; lowballing is unlikely to land.
- 2 sale attempts since 22y ago with the ask held roughly flat each time — persistent listings suggest the price (not the market) is what's stuck; bring a comps-based counter.
- Current owner paid $86k; 40% above their basis — modest negotiation headroom, anchor on the comps not their cost.
Risks & watch-outs
- Watch-outs: flood insurance adds $56/mo; built in 1900 — expect roof / HVAC / electrical / plumbing capex.
- Climate carrying-cost: major flood risk — expect insurance premiums to compound above CPI over the hold.
Questions for the listing agent
- Built in 1900 — when were the roof, HVAC, electrical panel, plumbing, and water heater last replaced?
- What's the actual annual flood-insurance premium (NFIP or private), and is the property in a SFHA with mandatory coverage?
- Is there a deadline driving the sale (1031 exchange, divorce, estate, relocation)? That informs how much negotiation room exists.
- Schools are B-rated — typically a magnet for longer-tenancy family renters. What's the average tenant stay here, and is there a school-zone premium baked into asking?
- What's the average days-on-market for RENTAL listings here right now (not sales)? A rising rental-DOM trend means longer vacancies and softer asking-rent achievability than the comps imply.
- What's the recent tenant-quality profile in this submarket — average credit score on applications, eviction rate, late-payment / NSF rate, and stable-employment percentage? A property-management company in the area should have these aggregated.
- How much new for-sale + rental construction is in the pipeline within 1–3 miles? Heavy new supply typically softens prices + rents 12–24 months out; constrained supply supports both.
Investment metrics
- 1% rule
- 1.04% ✓
- Cap rate
- 8.30%
- Cash-on-cash
- 7.15%
- DSCR
- 1.32
- GRM
- 8.0
CMA / ARV
- ARV (on-the-fly)
- $206,340
- Comps found
- 12
Show comp detail 12 sales within ~0.75 mi
| Address | Dist | Beds/Ba | Sqft | Sold | Price | $/sf | Match |
|---|---|---|---|---|---|---|---|
| 2119 Lake St | 0.63mi | 3/2.0 | 1,749 (-3%) | 7mo | $249,300 | $143 | 55 |
| 1611 Mcpherson Blvd | 0.41mi | 4/1.5 (+1) | 1,648 (-9%) | 6mo | $223,000 | $135 | 54 |
| 1512 Mcpherson Blvd | 0.37mi | 4/1.5 (+1) | 1,566 (-14%) | 0mo | $232,875 | $149 | 53 |
| 603 Lime St | 0.59mi | 4/1.5 (+1) | 1,683 (-7%) | 1mo | $150,000 | $89 | 53 |
| 930 Clinton St | 0.59mi | 4/2.0 (+1) | 1,870 (+3%) | 6mo | $238,000 | $127 | 53 |
| 1310 Mcpherson Blvd | 0.37mi | 4/3.0 (+1) | 1,988 (+10%) | 1mo | $200,000 | $101 | 52 |
| 833 Franklin Ave | 0.50mi | 3/2.0 | 1,598 (-12%) | 2mo | $179,900 | $113 | 52 |
| 320 High St | 0.74mi | 3/1.5 | 1,716 (-5%) | 4mo | $170,000 | $99 | 51 |
| 104 N Wood St | 0.48mi | 3/3.0 | 1,914 (+6%) | 11mo | $184,000 | $96 | 50 |
| 1342 Mcpherson Blvd | 0.36mi | 3/1.5 | 1,540 (-15%) | 7mo | $175,000 | $114 | 50 |
| 530 S Wayne St | 0.67mi | 4/1.5 (+1) | 1,710 (-6%) | 5mo | $91,700 | $54 | 48 |
| 2242 Napoleon Rd | 0.73mi | 4/2.0 (+1) | 1,656 (-8%) | 2mo | $230,000 | $139 | 41 |
Match score weights: distance 35% · size 25% · config 20% · recency 20%. Top-matched comps best support the ARV.
Projected returns pro-forma
-3.0% appreciation · 3.0% rent growth · sell at horizon
- IRR
- -8.2%
- Equity multiple
- 0.70×
- Total profit
- $-10,196
- Equity at exit
- $17,892
- IRR
- 1.3%
- Equity multiple
- 1.09×
- Total profit
- $3,107
- Equity at exit
- $10,375
Cash invested: $33,600 (down + closing). Projections, not guarantees.
Landlord ↔ Tenant lean methodology
- Overall (STATE)
- 73 Landlord-Friendly
- State Ohio
- 73 Landlord-Friendly · R+6
- County
- — inherits STATE
- City
- — inherits STATE
ZIP-level market 43420
- Home prices YoY
- -32.4%
- Active inventory
- 88
- Price-to-rent
- 8.0×
Monthly cashflow live
- Estimated rent
- $1,250 medium interval (Pro) →
- Mortgage (P&I)
- −$629
- Tax from tax record
- −$108 /mo · $1,294/yr
- Insurance
- −$50
- Flood insurance flood zone
- −$56 /mo · $666/yr
- HOA
- −$0
- Vacancy / Maint / Mgmt
- −$262
- Net cashflow
- $145
Break-even live
UW: 25.0% down · 7.5% · 30yr · 1.5% tax · 5.0% vac · 8.0% maint · 8.0% mgmt
Financing live
Cash to close
- Down payment
- $30,000
- Closing costs
- $3,600
- Reserves months
- —
- Total cash needed
- —
Loan-product check · same deal, 3 products live
Conventional
25% down · 7.5% · 30yr
- Down + closing
- —
- Monthly P&I
- —
- Monthly cashflow
- —
- DSCR
- —
- Eligible?
- —
Personal DTI + credit; lowest rate.
DSCR
20% down · 8.5% · 30yr
- Down + closing
- —
- Monthly P&I
- —
- Monthly cashflow
- —
- DSCR
- —
- Eligible?
- —
No personal income docs; deal must DSCR.
Hard money
10% down · 12.0% · 12mo
- Down + closing
- —
- Monthly P&I
- —
- Monthly cashflow
- —
- DSCR
- —
- Eligible?
- —
Short-term bridge; refi at stabilization.
Rent comps 1 comps
| Address | Beds | Baths | Sqft | Rent | $/sqft | DOM | Units | Dist |
|---|---|---|---|---|---|---|---|---|
| 900 Stilwell Ave Fremont, OH | 3.0 | 2.0 | 1484 | $1,250 | $0.84 | 17d | 1 | 0.46mi |
Listing history 8 events
-
2026-06-18days on market $120,000 Active 9 DOM
-
2026-06-17days on market $120,000 Active 8 DOM
-
2026-06-16days on market $120,000 Active 7 DOM
-
2026-06-15days on market $120,000 Active 6 DOM
-
2026-06-13days on market $120,000 Active 4 DOM
-
2026-06-12days on market $120,000 Active 3 DOM
-
2026-06-09remarks 311-char remark
-
2026-06-09$120,000 Active 1 DOM
ⓘ Source: listings_history table (triggers on properties + properties_extension) + one-shot
backfill from property_details.listing_events for pre-trigger history.
Tax reassessment forecast OH · Partial reset (capped growth)
- Current annual tax
- $1,294 · $108/mo
- Projected year-2 tax
- $1,583 · $132/mo
- Expected delta
- +$289/yr (+$24/mo · 22.3%)
ⓘ Screening estimate from a state-policy table — verify with the county assessor before closing.
Climate risk First Street
- Flood 7/10 Severe FEMA zone X (unshaded) · 75% chance over 30 yrs
- Wildfire 1/10 Low
- Heat 3/10 Moderate 7 d/yr ≥99°F today · 17 d/yr by 30 yrs out
- Wind 2/10 Low
- Air quality 2/10 Low 1 unhealthy d/yr today · 1 by 30 yrs out
Nearby sold comps map
Loading sold comps map…
Walkable amenities ~0.75 mi
Loading nearby amenities…
Taxation est. · year 1
- Rental income
- $15,000
- − Mortgage interest
- −$6,722
- − Property taxes
- −$1,294
- − Insurance
- −$1,266
- − Repairs & maintenance
- −$1,200
- − Management
- −$1,200
- − Depreciation
- −$3,491
- Taxable loss
- −$174
- Est. tax savings @ 24.0%
- +$42
- After-tax cash flow
- $1,779/yr
For passive investors: Depreciation is non-cash, so a rental often shows a tax loss while cash-flowing — sheltering income. Rental losses are passive: they offset passive income freely, and up to $25,000/yr can offset ordinary (W-2) income if you actively participate and your MAGI is under $100k (phasing out to $0 by $150k); unused losses carry forward. On sale, claimed depreciation is recaptured at up to 25%, and gains may owe capital-gains tax (a 1031 exchange can defer both). Figures are a year-1 estimate at your 24.0% rate — not tax advice; consult a CPA.
Schools (NCES district)
- District
- Fremont City
- NCES district ID
- 3904401
- Math proficiency
- 35% ▼ -27.00%
- Reading proficiency
- 44% ▼ -13.00%
- Median HH income
- $44,046
- Composite
- 33.48/100
- National rank
- #5449
- State rank
- #543 of 656 in OH
Livability — Fremont
- Score
- 74/100
- State rank
- #283
- US rank
- #4637
Category grades
Schools grade is shown separately in the Schools card above.
Census & demographics
- Census place
- Fremont, OH
- County
- Sandusky · 51,886 people
- City population
- 29,400
- Population (ZIP)
- 29,400
- Household income
- $62,802
- Rent vs Own
- Severe rent burden
- 10.4
Population outlook (Sandusky County) Hauer SSP2
- Today (2025)
- 57,409 people
- By 2030
- 55,791 · -2.8%
- By 2040
- 51,837 · -9.7%
- By 2050
- 47,712 · -16.9%
- By 2075
- 39,908 · -30.5%
- By 2100
- 33,171 · -42.2%
Race, ethnicity, and origin ACS 2023
- Neighborhood character
- Predominantly White (76%)
- Race & ethnicity
- White 76% Hispanic / Latino 14% Two or more races 9% Black 5%
- Hispanic origin (detail)
- Mexican 12%
- Common ancestry
- Romanian 3% Lithuanian 2% Slovak 1%
- Foreign-born
- 2% · Canada
- Languages at home
- 94% English-only · Spanish 5%
Political lean MEDSL · Sandusky
- 2024 margin
- Solid R (+30.9) · D 34.1% · R 65.0%
- 2008→2024 swing
- -35.5pp toward R · 2008: 4.6pp · 2024: -30.9pp
- All cycles
- 2024: R+30.9 2020: R+27.6 2016: R+23.0 2012: D+1.9 2008: D+4.6
Not yet ingested
- Civics
- —
Market trends
- HPI YoY
- ▼ -90.51%
- Current HPI
- 188.5274
- Rent YoY
- —
- Metro
- —
- State GDP YoY
- ▲ 1.98%
- F500 in state
- 48
Industry mix (Fortune 500 HQ in OH)
| Industry | F500 HQs | Revenue |
|---|---|---|
| Insurance | 3 | $145B |
|
||
| Industrial Machinery | 3 | $49B |
|
||
| Financial Services | 3 | $24B |
|
||
| Consumer Goods | 2 | $93B |
|
||
| Aerospace / Defense | 2 | $47B |
|
||
| Utilities | 2 | $33B |
|
||
Price history
+410.6% since first listed7 events — show timeline
- 2026-06-03 Listed $120,000 NORIS
- 2004-09-22 Sold (Public Records) $85,500 Public Records
- 2004-09-21 Price Changed $85,500 NORIS
- 2004-09-21 Sold (MLS) $85,500 NORIS
- 2004-07-27 Listed $85,000 NORIS
- 1989-09-18 Sold (Public Records) $27,500 Public Records
- 1987-02-13 Sold (Public Records) $23,500 Public Records
Property tax history
+3.2%/yrLatest (2025): $1,294 · +91.6% YoY. Source: county tax records.
Cash-flow waterfall
monthlySold comps — $/sqft
last 12 mo · ≤1 miLoading sold comps…