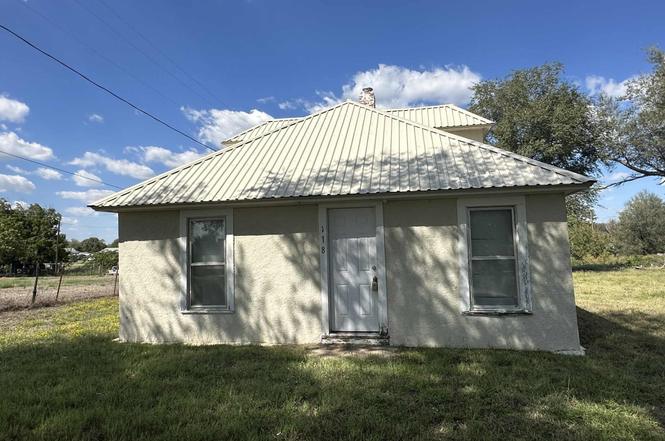
118 E School St · Gage, OK
Flood risk 1/10 · Minimal
- FEMA flood zone
- —
- Chance of flooding over 30 yrs
- 0.0%
- Est. flood insurance / yr
- —
Fire risk 7/10 · Major
- Est. fire insurance / yr
- $2,463 – $4,575
Heat risk 6/10 · Moderate
- Hot days now (above 104°F)
- 7 days/yr
- Hot days in 30 yrs
- 19 days/yr
Wind risk 2/10 · Minimal
- Chance of severe wind over 30 yrs
- 0.0%
Air-quality risk 1/10 · Minimal
- Unhealthy air days now
- 0 days/yr
- Unhealthy air days in 30 yrs
- 0 days/yr
Risk factors via First Street. Map © Google.
Why this score? — see what drove the A- grade
The composite is a weighted blend of 9 inputs, each scored 0–100. Each bar is that input's sub-score; the figure is the points it added to the 100-point composite (weight × sub-score).
- Cash flow +30.0/30.0
- ARV discount +15.0/15.0
- 1% rule +10.0/10.0
- DSCR +10.0/10.0
- Appreciation +7.4/10.0
- Livability +2.9/5.0
- Rent growth +2.5/5.0
- Schools +2.5/10.0
- Condition / age +2.5/5.0
$65,000
🖨 Deal sheet (PDF) 📄 Offer letter ✓ Due diligence
Listing remarks
Discover the charm of small-town living with this delightful 2-bedroom, 1-bathroom home located in the heart of Gage, OK. Well-sized rooms with natural light, making the space feel warm and inviting. The kitchen has a functional layout with ample cabinetry and counter space. Detached garage providing additional storage or workshop space. Situated in a quiet neighborhood, offering a peaceful environment while still being close to local amenities. Perfectly priced for first-time buyers or those seeking a cozy retreat, this property offers a comfortable and welcoming atmosphere.
Key facts
- Ample cabinetry
- Functional layout
- Quiet neighborhood
Tags
Property features AI
Exterior
- Parking: Detached 1-car garage
- Utilities: Public water; Public sewer
- Home design: Single family residence; Single-story; Faces south
- Construction: Stucco construction; Metal roof
- Exterior features: Gravel road access
Interior
- Kitchen: Refrigerator
- Flooring: Concrete; Ceramic tile; Tile; Vinyl
- Bathrooms: 1 full bathroom
- Heating & cooling: Central heating (natural gas); Window air conditioning unit(s)
- Interior features: Window coverings; Refrigerator included
Neighborhood map
What this means for you Summary
Snapshot
- This is a 3-bed/1.0-bath single-family listed at $65k.
Deal economics
- At list price, monthly cash flow is $417 ($5k/yr) — positive.
- The deal already cash-flows at list — no discount required.
- Meets the 1% rule at list price ($1k rent vs $65k).
- Recommended offer: $57k (12.0% below list) — sets the bar for market timing.
Location & tenants
- Location reads 57/100 on livability (#458 in OK) — a working-class tenant base; expect higher turnover. Strengths: cost of living A+, housing A-; Watch: health & safety C-, schools F, crime F.
- Fargo (rural): math 25% / reading 25% proficiency, ranked #320 of 513 in OK (top 62%) — low school quality limits family demand, transient renter base, plan for 1-2y turnover; 60% free/reduced lunch — lower-income household profile, screen leases tightly.
- Market conditions: 7 active listings in the ZIP.
Forward outlook
- In year one you build about $4k of equity ($449 loan paydown + $3k appreciation (4.7% local appreciation)).
- Ellis County population projected at +12% by 2050 — modest demand growth; plan on rents tracking national, not racing it.
- At projected returns (4.7% appreciation + 3.0% rent growth), your $18k cash investment doubles in ~3 years — after that, you're playing with house money.
- By year 9, paydown + projected appreciation supports a ~$31k cash-out refi (75% LTV) — recoverable capital for the next deal without selling this one.
Negotiation context
- It's been on market 268 days — a 12% lower offer ($57k) is reasonable based on typical stale-listing flexibility.
Risks & watch-outs
- Watch-outs: built in 1914 — expect roof / HVAC / electrical / plumbing capex.
- Climate carrying-cost: major wildfire risk; extreme-heat days projected 7→19/yr by 2055 (HVAC capex compounding) — expect insurance premiums to compound above CPI over the hold.
Questions for the listing agent
- It's been on market 268 days. Have you received any prior offers? Is the seller open to a 12% concession, seller financing, or rate buy-down credit?
- Built in 1914 — when were the roof, HVAC, electrical panel, plumbing, and water heater last replaced?
- Why hasn't it sold? Are there any deal-killer items the seller is aware of (foundation, flood, title, zoning, code violations)?
- Is there a deadline driving the sale (1031 exchange, divorce, estate, relocation)? That informs how much negotiation room exists.
- Schools are F-rated, which usually means shorter tenancies and higher turnover. Who's the typical renter profile here, and what's been the actual vacancy rate?
- Crime grade is F in this area — have there been break-ins, vandalism, or insurance claims at this property in the last 3 years? What carrier currently insures it and at what premium?
- What's the average days-on-market for RENTAL listings here right now (not sales)? A rising rental-DOM trend means longer vacancies and softer asking-rent achievability than the comps imply.
- What's the recent tenant-quality profile in this submarket — average credit score on applications, eviction rate, late-payment / NSF rate, and stable-employment percentage? A property-management company in the area should have these aggregated.
- How much new for-sale + rental construction is in the pipeline within 1–3 miles? Heavy new supply typically softens prices + rents 12–24 months out; constrained supply supports both.
Investment metrics
- 1% rule
- 1.59% ✓
- Cap rate
- 14.00%
- Cash-on-cash
- 27.52%
- DSCR
- 2.22
- GRM
- 5.2
CMA / ARV
- ARV (on-the-fly)
- $85,544
- Comps found
- 2
Show comp detail 2 sales within ~0.75 mi
| Address | Dist | Beds/Ba | Sqft | Sold | Price | $/sf | Match |
|---|---|---|---|---|---|---|---|
| 300 N Main | 0.06mi | 2/1.0 (-1) | 1,184 (+2%) | 12mo | $37,000 | $31 | 78 |
| 704 W Cedar St | 0.56mi | 2/1.0 (-1) | 1,008 (-13%) | 13mo | $75,000 | $74 | 37 |
Match score weights: distance 35% · size 25% · config 20% · recency 20%. Top-matched comps best support the ARV.
Projected returns pro-forma
4.72% appreciation · 3.0% rent growth · sell at horizon
- IRR
- 36.5%
- Equity multiple
- 3.23×
- Total profit
- $40,513
- Equity at exit
- $35,730
- IRR
- 34.9%
- Equity multiple
- 6.49×
- Total profit
- $99,975
- Equity at exit
- $60,771
Cash invested: $18,200 (down + closing). Projections, not guarantees.
Landlord ↔ Tenant lean methodology
- Overall (STATE)
- 83 Strongly Landlord-Friendly
- State Oklahoma
- 83 Strongly Landlord-Friendly · R+20
- County
- — inherits STATE
- City
- — inherits STATE
ZIP-level market 73843
- Home prices YoY
- 3.5%
- Active inventory
- 7
- Price-to-rent
- 5.2×
Monthly cashflow live
- Estimated rent
- $1,032 medium interval (Pro) →
- Mortgage (P&I)
- −$341
- Tax from tax record
- −$30 /mo · $362/yr
- Insurance
- −$27
- HOA
- −$0
- Vacancy / Maint / Mgmt
- −$217
- Net cashflow
- $417
Break-even live
Sensitivity live
| Price | -10% $454 | -5% $436 | +0% $417 | +5% $399 | +10% $381 |
|---|---|---|---|---|---|
| Rent | -10% $336 | -5% $377 | +0% $417 | +5% $458 | +10% $499 |
| Rate | -1.0pp $450 | -0.5pp $434 | base $417 | +0.5pp $401 | +1.0pp $383 |
UW: 25.0% down · 7.5% · 30yr · 1.5% tax · 5.0% vac · 8.0% maint · 8.0% mgmt
Financing live
Cash to close
- Down payment
- $16,250
- Closing costs
- $1,950
- Reserves months
- —
- Total cash needed
- —
Loan-product check · same deal, 3 products live
Conventional
25% down · 7.5% · 30yr
- Down + closing
- —
- Monthly P&I
- —
- Monthly cashflow
- —
- DSCR
- —
- Eligible?
- —
Personal DTI + credit; lowest rate.
DSCR
20% down · 8.5% · 30yr
- Down + closing
- —
- Monthly P&I
- —
- Monthly cashflow
- —
- DSCR
- —
- Eligible?
- —
No personal income docs; deal must DSCR.
Hard money
10% down · 12.0% · 12mo
- Down + closing
- —
- Monthly P&I
- —
- Monthly cashflow
- —
- DSCR
- —
- Eligible?
- —
Short-term bridge; refi at stabilization.
Listing history 16 events
-
2026-06-21days on market $65,000 Active 268 DOM
-
2026-06-18days on market $65,000 Active 266 DOM
-
2026-06-17days on market $65,000 Active 265 DOM
-
2026-06-16days on market $65,000 Active 264 DOM
-
2026-06-15days on market $65,000 Active 263 DOM
-
2026-06-13days on market $65,000 Active 261 DOM
-
2026-06-12days on market $65,000 Active 260 DOM
-
2026-06-09days on market $65,000 Active 257 DOM
-
2026-06-08days on market $65,000 Active 256 DOM
-
2026-06-08days on market $65,000 Active 255 DOM
-
2026-06-05days on market $65,000 Active 253 DOM
-
2026-06-04days on market $65,000 Active 251 DOM
-
2026-06-02days on market $65,000 Active 250 DOM
-
2026-06-01days on market $65,000 Active 249 DOM
-
2026-05-31days on market $65,000 Active 248 DOM
-
2025-09-25$65,000 Active
ⓘ Source: listings_history table (triggers on properties + properties_extension) + one-shot
backfill from property_details.listing_events for pre-trigger history.
Tax reassessment forecast OK · Resets to sale price
- Current annual tax
- $362 · $30/mo
- Projected year-2 tax
- $585 · $49/mo
- Expected delta
- +$223/yr (+$19/mo · 61.6%)
ⓘ Screening estimate from a state-policy table — verify with the county assessor before closing.
Climate risk First Street
- Flood 1/10 Low 0% chance over 30 yrs
- Wildfire 7/10 Severe
- Heat 6/10 Major 7 d/yr ≥104°F today · 19 d/yr by 30 yrs out
- Wind 2/10 Low 0% chance of damaging wind over 30 yrs
- Air quality 1/10 Low 0 unhealthy d/yr today · 0 by 30 yrs out
Nearby sold comps map
Loading sold comps map…
Walkable amenities ~0.75 mi
Loading nearby amenities…
Taxation est. · year 1
- Rental income
- $12,388
- − Mortgage interest
- −$3,641
- − Property taxes
- −$362
- − Insurance
- −$325
- − Repairs & maintenance
- −$991
- − Management
- −$991
- − Depreciation
- −$1,891
- Taxable income
- $4,187
- Est. tax owed @ 24.0%
- −$1,005
- After-tax cash flow
- $4,004/yr
For passive investors: Depreciation is non-cash, so a rental often shows a tax loss while cash-flowing — sheltering income. Rental losses are passive: they offset passive income freely, and up to $25,000/yr can offset ordinary (W-2) income if you actively participate and your MAGI is under $100k (phasing out to $0 by $150k); unused losses carry forward. On sale, claimed depreciation is recaptured at up to 25%, and gains may owe capital-gains tax (a 1031 exchange can defer both). Figures are a year-1 estimate at your 24.0% rate — not tax advice; consult a CPA.
Schools (NCES district)
- District
- Fargo
- NCES district ID
- 4011430
- Math proficiency
- 25% ▼ -20.00%
- Reading proficiency
- 25% ▼ -15.00%
- Median HH income
- $51,652
- Composite
- 25.25/100
- National rank
- #12909
- State rank
- #320 of 513 in OK
Livability — Gage
- Score
- 57/100
- State rank
- #458
- US rank
- #21665
Category grades
Schools grade is shown separately in the Schools card above.
Census & demographics
- Census place
- Gage, OK
- Population (ZIP)
- 896
Population outlook (Ellis County) Hauer SSP2
- Today (2025)
- 4,446 people
- By 2030
- 4,549 · +2.3%
- By 2040
- 4,757 · +7.0%
- By 2050
- 4,978 · +12.0%
- By 2075
- 5,455 · +22.7%
- By 2100
- 5,346 · +20.2%
Race, ethnicity, and origin ACS 2023
- Neighborhood character
- Predominantly White (89%)
- Race & ethnicity
- White 89% Two or more races 10% Hispanic / Latino 2%
- Common ancestry
- Slovak 4% European 2% Italian 2%
- Foreign-born
- 0%
- Languages at home
- 99% English-only · Spanish 1%
Political lean MEDSL · Ellis
- 2024 margin
- Solid R (+76.6) · D 10.9% · R 87.5% · Other 1.7%
- 2008→2024 swing
- -6.1pp toward R · 2008: -70.5pp · 2024: -76.6pp
- All cycles
- 2024: R+76.6 2020: R+81.5 2016: R+79.7 2012: R+74.9 2008: R+70.5
Not yet ingested
- Civics
- —
Market trends
- HPI YoY
- ▲ 4.72%
- Current HPI
- 138.5346
- Rent YoY
- —
- Metro
- —
- State GDP YoY
- ▲ 1.55%
- F500 in state
- 6
Industry mix (Fortune 500 HQ in OK)
| Industry | F500 HQs | Revenue |
|---|---|---|
| Energy | 3 | $48B |
|
||
Price history
1 event — show timeline
- 2025-09-25 Listed $65,000 NWOAR
Property tax history
+14.8%/yrLatest (2025): $362 · -7.2% YoY. Source: county tax records.
Cash-flow waterfall
monthlySold comps — $/sqft
last 12 mo · ≤1 miLoading sold comps…