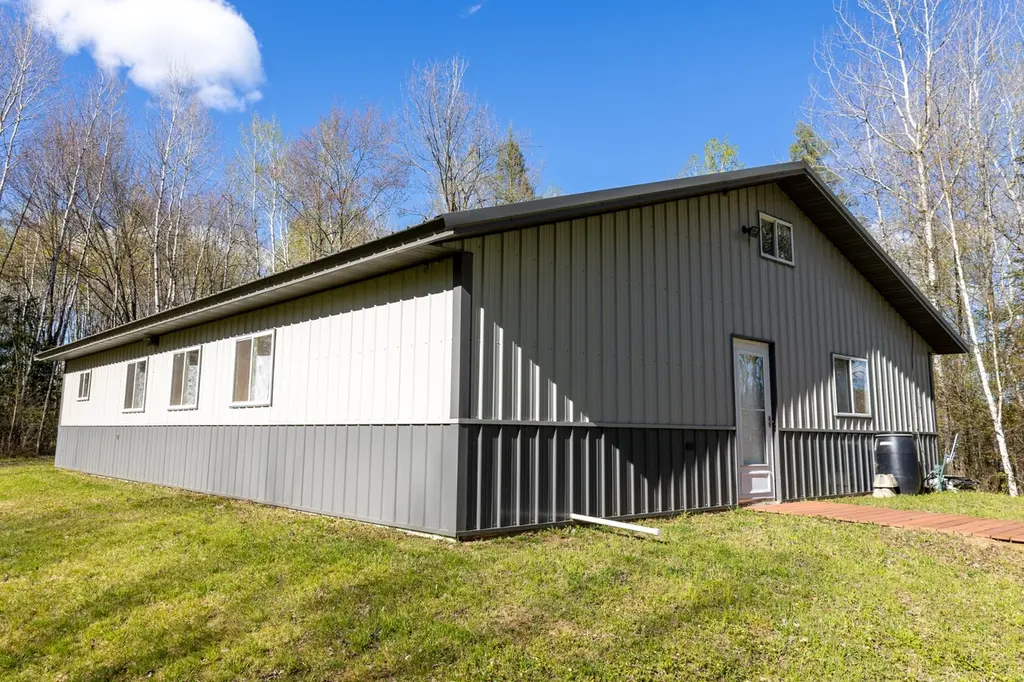
N2669 Ten Crossing Rd · Ogema, WI
Flood risk 1/10 · Minimal
- FEMA flood zone
- X
- Chance of flooding over 30 yrs
- 0.0%
- Est. flood insurance / yr
- $473 – $860
Fire risk 3/10 · Minor
- Est. fire insurance / yr
- $636 – $1,182
Heat risk 1/10 · Minimal
- Hot days now (above 91°F)
- 7 days/yr
- Hot days in 30 yrs
- 13 days/yr
Wind risk 1/10 · Minimal
- Chance of severe wind over 30 yrs
- —
Air-quality risk 1/10 · Minimal
- Unhealthy air days now
- 0 days/yr
- Unhealthy air days in 30 yrs
- 0 days/yr
Risk factors via First Street. Map © Google.
Why this score? — see what drove the D- grade
The composite is a weighted blend of 9 inputs, each scored 0–100. Each bar is that input's sub-score; the figure is the points it added to the 100-point composite (weight × sub-score).
- ARV discount +15.0/15.0
- Appreciation +7.9/10.0
- Cash flow +4.3/30.0
- Schools +3.4/10.0
- Livability +3.3/5.0
- Rent growth +2.5/5.0
- Condition / age +2.5/5.0
- 1% rule +0.0/10.0
- DSCR +0.0/10.0
$264,900
🖨 Deal sheet 📄 Offer letter ✓ Due diligence
Listing remarks
(908/JM) Your Ultimate Outdoor Retreat! Experience all Northwoods has to offer with this 3 bed, 1 bath cabin tucked into 80+/- acres on Ten Crossing Road, just northwest of Ogema. This diverse property is a literal outdoorsmen's dream and offers opportunities for a variety of activities, all while providing unparalleled privacy for “up north” living. A mix of high & low ground along with stream and food plots make this a perfect habitat for wildlife as deer, bear, turkey, and more are consistently seen on trail cams. A network of maintained trails allows for exploring and provides access to multiple deer stands. Cabin is less than 15 years old and has heat, electric, and a
Key facts
- Wildlife habitat
- Maintained trails
- Stream
Tags
Property features AI
Exterior
- Parking: Attached garage (1 garage space); Driveway; Gravel parking
- Utilities: No water source available; Electric with circuit breakers; Water not available
- Home design: Single-family residence; One level
- Construction: Frame construction with metal siding; Metal roof; Slab foundation; Built for residential use (hunting current use indicated)
- Exterior features: Private, secluded, wooded lot with wetlands; Unimproved road frontage and surface
Interior
- Kitchen: Electric oven; Electric range; Microwave
- Flooring: Carpet; Concrete
- Bathrooms: 1 full bathroom
- Heating & cooling: Forced air heating (propane); Ceiling fan(s) for cooling
- Interior features: Ceiling fan(s)
Neighborhood map
What this means for you Summary
Snapshot
- This is a 3-bed/1.0-bath other listed at $265k.
Deal economics
- At list price, monthly cash flow is $-703 ($-8k/yr) — negative.
- To cash-flow at today's rent, offer at most $141k (46.9% below list).
- To meet the 1% rule (rent ≥ 1% of price), the offer needs to be $117k (55.9% below list).
- Recommended offer: $117k (55.9% below list) — sets the bar for 1% rule.
Location & tenants
- Location reads 66/100 on livability (#487 in WI) — a middle-class / working-renter tenant base. Strengths: cost of living A+, housing A+, employment B+; Watch: crime C-, health & safety D, amenities F.
- Prentice School District (rural): math 40% / reading 35% proficiency, ranked #299 of 426 in WI (top 70%) — families likely to look elsewhere, expect single-tenant / working-renter base with shorter leases.
- Zoned schools: Prentice Elementary (math 54% / reading 44%, grade D, #257 of 1,041 statewide, top 30%, 128 students, 64% FRL); Prentice Middle (math 37% / reading 37%, grade F, #175 of 383 statewide, top 48%, 103 students, 50% FRL); Prentice High (math 30% / reading 30%, grade F, #208 of 483 statewide, top 46%, 117 students, 43% FRL) — zoned schools average 52% FRL vs 33% district-wide (19 pts higher); higher-poverty schools than district average — tighter screening recommended.
- Market conditions: 24 active listings in the ZIP; 47 units permitted in Price County in 2024 (0 in 5+ unit buildings).
Forward outlook
- In year one you build about $17k of equity ($2k loan paydown + $15k appreciation (5.7% local appreciation)).
- Price County population projected at -25% by 2050 — secular population decline; favor cash flow + early exit over multi-decade hold.
- By year 3, paydown + projected appreciation supports a ~$42k cash-out refi (75% LTV) — recoverable capital for the next deal without selling this one.
Negotiation context
- It's been on market 34 days — a 3% lower offer ($257k) is reasonable based on typical stale-listing flexibility.
- 2 sale attempts with the ask held roughly flat each time — persistent listings suggest the price (not the market) is what's stuck; bring a comps-based counter.
- Current owner paid $65k; list at $265k implies a 308% gain — meaningful room to come down on a strong offer.
Questions for the listing agent
- What do current leases actually rent for vs. the listed asking? Can we see a recent rent roll and the last 12 months of T-12 income?
- It's been on market 34 days. Have you received any prior offers? Is the seller open to a 56% concession, seller financing, or rate buy-down credit?
- Is there a deadline driving the sale (1031 exchange, divorce, estate, relocation)? That informs how much negotiation room exists.
- Schools are D-rated, which usually means shorter tenancies and higher turnover. Who's the typical renter profile here, and what's been the actual vacancy rate?
- The area grade is low — what's the realistic commute time and amenity access for the typical tenant pool here? Any planned neighborhood developments (good or bad) we should know about?
- What's the average days-on-market for RENTAL listings here right now (not sales)? A rising rental-DOM trend means longer vacancies and softer asking-rent achievability than the comps imply.
- What's the recent tenant-quality profile in this submarket — average credit score on applications, eviction rate, late-payment / NSF rate, and stable-employment percentage? A property-management company in the area should have these aggregated.
- How much new for-sale + rental construction is in the pipeline within 1–3 miles? Heavy new supply typically softens prices + rents 12–24 months out; constrained supply supports both.
Investment metrics
- 1% rule
- 0.44% ✗
- Cap rate
- 3.11%
- Cash-on-cash
- -11.37%
- DSCR
- 0.49
- GRM
- 18.9
CMA / ARV
- ARV (median comp)
- $502,003
- List price
- $264,900
- Delta
- -47.23%
- Verdict
- UNDERPRICED
- Comps
- 2 within 2.0 mi
Projected returns pro-forma
5.72% appreciation · 3.0% rent growth · sell at horizon
- IRR
- 5.4%
- Equity multiple
- 1.37×
- Total profit
- $27,181
- Equity at exit
- $161,829
- IRR
- 7.8%
- Equity multiple
- 2.56×
- Total profit
- $116,037
- Equity at exit
- $289,498
Cash invested: $74,172 (down + closing). Projections, not guarantees.
Landlord ↔ Tenant lean methodology
- Overall (STATE)
- 73 Landlord-Friendly
- State Wisconsin
- 73 Landlord-Friendly · R+2
- County
- — inherits STATE
- City
- — inherits STATE
ZIP-level market 54459
- Home prices YoY
- 2.7%
- Active inventory
- 24
- Price-to-rent
- 18.9×
Monthly cashflow live
- Estimated rent
- $1,169 medium interval (Pro) →
- Mortgage (P&I)
- −$1,389
- Tax from tax record
- −$127 /mo · $1,524/yr
- Insurance
- −$110
- HOA
- −$0
- Vacancy / Maint / Mgmt
- −$245
- Net cashflow
- $-703
Break-even live
UW: 25.0% down · 7.5% · 30yr · 1.5% tax · 5.0% vac · 8.0% maint · 8.0% mgmt
Financing live
Cash to close
- Down payment
- $66,225
- Closing costs
- $7,947
- Reserves months
- —
- Total cash needed
- —
Loan-product check · same deal, 3 products live
Conventional
25% down · 7.5% · 30yr
- Down + closing
- —
- Monthly P&I
- —
- Monthly cashflow
- —
- DSCR
- —
- Eligible?
- —
Personal DTI + credit; lowest rate.
DSCR
20% down · 8.5% · 30yr
- Down + closing
- —
- Monthly P&I
- —
- Monthly cashflow
- —
- DSCR
- —
- Eligible?
- —
No personal income docs; deal must DSCR.
Hard money
10% down · 12.0% · 12mo
- Down + closing
- —
- Monthly P&I
- —
- Monthly cashflow
- —
- DSCR
- —
- Eligible?
- —
Short-term bridge; refi at stabilization.
Listing history 19 events
-
2026-06-18days on market $264,900 Active 34 DOM
-
2026-06-17status $264,900 Active 33 DOM
-
2026-06-17days on market $264,900 Active Under Contract 33 DOM
-
2026-06-16days on market $264,900 Active Under Contract 32 DOM
-
2026-06-15days on market $264,900 Active Under Contract 31 DOM
-
2026-06-15days on market $264,900 Active Under Contract 30 DOM
-
2026-06-13days on market $264,900 Active Under Contract 29 DOM
-
2026-06-12days on market $264,900 Active Under Contract 28 DOM
-
2026-06-10status $264,900 Active Under Contract 25 DOM
-
2026-06-09days on market $264,900 Active 25 DOM
-
2026-06-08days on market $264,900 Active 24 DOM
-
2026-06-08days on market $264,900 Active 23 DOM
-
2026-06-05days on market $264,900 Active 21 DOM
-
2026-06-03days on market $264,900 Active 19 DOM
-
2026-06-02days on market $264,900 Active 18 DOM
-
2026-06-01days on market $264,900 Active 17 DOM
-
2026-05-31days on market $264,900 Active 16 DOM
-
2026-05-15$264,900 Active 933-char remark
-
2007-01-03soldstatus $65,000
ⓘ Source: listings_history table (triggers on properties + properties_extension) + one-shot
backfill from property_details.listing_events for pre-trigger history.
Tax reassessment forecast WI · Partial reset (capped growth)
- Current annual tax
- $1,524 · $127/mo
- Projected year-2 tax
- $3,212 · $268/mo
- Expected delta
- +$1,688/yr (+$141/mo · 110.8%)
ⓘ Screening estimate from a state-policy table — verify with the county assessor before closing.
Climate risk First Street
- Flood 1/10 Low FEMA zone X · 0% chance over 30 yrs
- Wildfire 3/10 Moderate
- Heat 1/10 Low 7 d/yr ≥91°F today · 13 d/yr by 30 yrs out
- Wind 1/10 Low
- Air quality 1/10 Low 0 unhealthy d/yr today · 0 by 30 yrs out
Nearby sold comps map
Loading sold comps map…
Walkable amenities ~0.75 mi
Loading nearby amenities…
Taxation est. · year 1
- Rental income
- $14,028
- − Mortgage interest
- −$14,839
- − Property taxes
- −$1,524
- − Insurance
- −$1,324
- − Repairs & maintenance
- −$1,122
- − Management
- −$1,122
- − Depreciation
- −$7,706
- Taxable loss
- −$13,610
- Est. tax savings @ 24.0%
- +$3,266
- After-tax cash flow
- $-5,170/yr
For passive investors: Depreciation is non-cash, so a rental often shows a tax loss while cash-flowing — sheltering income. Rental losses are passive: they offset passive income freely, and up to $25,000/yr can offset ordinary (W-2) income if you actively participate and your MAGI is under $100k (phasing out to $0 by $150k); unused losses carry forward. On sale, claimed depreciation is recaptured at up to 25%, and gains may owe capital-gains tax (a 1031 exchange can defer both). Figures are a year-1 estimate at your 24.0% rate — not tax advice; consult a CPA.
Schools (NCES district)
- District
- Prentice School District
- NCES district ID
- 5512210
- Math proficiency
- 40% ▼ -5.00%
- Reading proficiency
- 35% ▬ 0.00%
- Median HH income
- $39,103
- Composite
- 33.92/100
- National rank
- #10345
- State rank
- #299 of 426 in WI
Livability — Ogema
- Score
- 66/100
- State rank
- #487
- US rank
- #12361
Category grades
Schools grade is shown separately in the Schools card above.
Census & demographics
- Population (ZIP)
- 1,377
Population outlook (Price County) Hauer SSP2
- Today (2025)
- 12,757 people
- By 2030
- 12,157 · -4.7%
- By 2040
- 10,761 · -15.6%
- By 2050
- 9,515 · -25.4%
- By 2075
- 8,293 · -35.0%
- By 2100
- 7,470 · -41.4%
Race, ethnicity, and origin ACS 2023
- Neighborhood character
- Predominantly White (93%)
- Race & ethnicity
- White 93% Two or more races 4% Hispanic / Latino 2% Black 1%
- Common ancestry
- Romanian 9% Portuguese 6% Lithuanian 2%
Political lean MEDSL · Price
- 2024 margin
- Solid R (+31.1) · D 33.9% · R 65.1%
- 2008→2024 swing
- -44.5pp toward R · 2008: 13.4pp · 2024: -31.1pp
- All cycles
- 2024: R+31.1 2020: R+27.6 2016: R+25.0 2012: D+0.0 2008: D+13.4
Not yet ingested
- Civics
- —
Market trends
- HPI YoY
- ▲ 5.72%
- Current HPI
- 220.756
- Rent YoY
- —
- Metro
- —
- State GDP YoY
- ▲ 2.10%
- F500 in state
- 20
Industry mix (Fortune 500 HQ in WI)
| Industry | F500 HQs | Revenue |
|---|---|---|
| Industrial Machinery | 4 | $23B |
|
||
| Industrial Technology | 2 | $36B |
|
||
| Insurance | 1 | $36B |
|
||
| Professional Services | 1 | $19B |
|
||
| Utilities | 1 | $9B |
|
||
| Consumer Goods | 1 | $3B |
|
||
Price history
+307.5% since first listed4 events — show timeline
- 2026-06-17 Relisted — GNMLS
- 2026-06-09 Contingent — GNMLS
- 2026-05-15 Listed $264,900 GNMLS
- 2007-01-03 Sold (Public Records) $65,000 Public Records
Property tax history
-0.2%/yrLatest (2025): $1,524 · -14.0% YoY. Source: county tax records.
Cash-flow waterfall
monthlySold comps — $/sqft
last 12 mo · ≤1 miLoading sold comps…