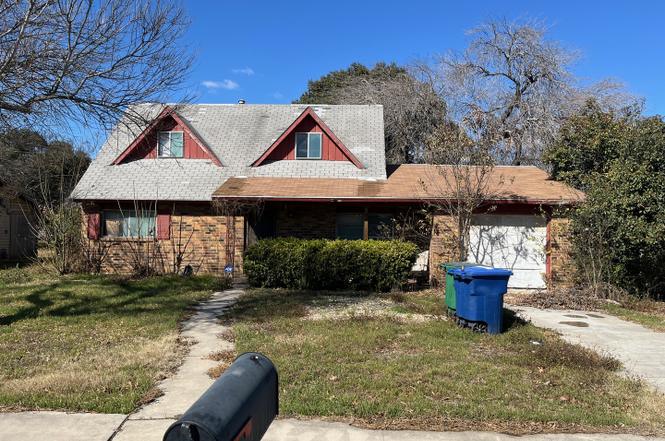
3507 Crestmont Dr · San Antonio, TX
Flood risk 5/10 · Moderate
- FEMA flood zone
- X (unshaded)
- Chance of flooding over 30 yrs
- 0.24%
- Est. flood insurance / yr
- $507 – $1,088
Fire risk 1/10 · Minimal
- Est. fire insurance / yr
- $1,222 – $2,270
Heat risk 8/10 · Major
- Hot days now (above 108°F)
- 7 days/yr
- Hot days in 30 yrs
- 22 days/yr
Wind risk 6/10 · Moderate
- Chance of severe wind over 30 yrs
- 74.0%
Air-quality risk 2/10 · Minimal
- Unhealthy air days now
- 0 days/yr
- Unhealthy air days in 30 yrs
- 1 days/yr
Risk factors via First Street. Map © Google.
Why this score? — see what drove the C grade
The composite is a weighted blend of 9 inputs, each scored 0–100. Each bar is that input's sub-score; the figure is the points it added to the 100-point composite (weight × sub-score).
- ARV discount +15.0/15.0
- Cash flow +14.1/30.0
- 1% rule +6.7/10.0
- Appreciation +5.0/10.0
- DSCR +4.3/10.0
- Livability +4.0/5.0
- Schools +3.8/10.0
- Rent growth +2.5/5.0
- Condition / age +2.5/5.0
$120,000
🖨 Deal sheet (PDF) 📄 Offer letter ✓ Due diligence
Listing remarks
Home is vacant. No electricity, bring flashlight. Seller: Estate of Glenn Roger Bevil, Laird H. McNeil Dep Admin No seller disclosure. This is a estate sale. Home has not been lived in for a undetermined amount of time. The Property is sold "AS IS", and Seller is not responsible for any charges for or costs of, or credits, offsets, allowances or discounts against the purchase price for, any repairs or improvements. See also other remarks.
Key facts
- 0.24 acre lot
- Garage
- Built 1967
Neighborhood map
What this means for you Summary
Snapshot
- This is a 3-bed/2.0-bath single-family listed at $120k.
Deal economics
- At list price, monthly cash flow is $18 ($215/yr) — positive.
- The deal already cash-flows at list — no discount required.
- Meets the 1% rule at list price ($1k rent vs $120k).
- Recommended offer: $116k (3.0% below list) — sets the bar for market timing.
- Cap rate 6.5% vs local median 3.8% in San Antonio — top-decile yield for the area; either an underpriced asset or a hidden risk that comps aren't pricing in. Stress-test before assuming the spread holds.
Location & tenants
- Location reads 80/100 on livability (#31 in TX, #1,616 nationally) — a professional / high-income tenant draw. Strengths: amenities A+, commute A+, cost of living A+; Watch: crime F.
- North East ISD (urban): math 38% / reading 49% proficiency, ranked #276 of 826 in TX (top 33%) — families likely to look elsewhere, expect single-tenant / working-renter base with shorter leases.
- Zoned schools: Oak Grove El (math 17% / reading 37%, grade F, #2,791 of 4,322 statewide, top 68%, 389 students, 88% FRL); Garner Middle (math 17% / reading 30%, grade F, #1,317 of 1,662 statewide, top 80%, 804 students, 83% FRL); Macarthur H S (math 31% / reading 51%, grade F, #774 of 1,632 statewide, top 49%, 2,055 students, 58% FRL) — zoned schools average 77% FRL vs 41% district-wide (35 pts higher); higher-poverty schools than district average — tighter screening recommended.
- Zoned-school proficiency averages 30% at this address vs 44% district-wide (-13 pts) — the specific schools serving this property underperform the North East ISD average; the district grade overstates school quality for this exact location.
- Market conditions: 1 active listings in the ZIP; 40 comparable units currently listed for rent nearby; rentals at typical pace (median 26d on market — plan ~3-4 weeks tenant-placement turnaround); 8,308 units permitted in Bexar County in 2024 (2,506 in 5+ unit buildings).
Forward outlook
- In year one you build about $4k of equity ($830 loan paydown + $4k appreciation (3.0% local appreciation)).
- Bexar County population projected at +50% by 2050 — long-run rental-demand tailwind backs the buy-and-hold thesis.
- At projected returns (3.0% appreciation + 3.0% rent growth), your $34k cash investment doubles in ~6 years — after that, you're playing with house money.
- By year 8, paydown + projected appreciation supports a ~$33k cash-out refi (75% LTV) — recoverable capital for the next deal without selling this one.
Negotiation context
- It's been on market 34 days — a 3% lower offer ($116k) is reasonable based on typical stale-listing flexibility.
Risks & watch-outs
- Watch-outs: property tax is 4.1% of price.
- Climate carrying-cost: moderate flood risk; major wind risk, 74% chance of damaging wind over 30y; extreme-heat days projected 7→22/yr by 2055 (HVAC capex compounding) — expect insurance premiums to compound above CPI over the hold.
Questions for the listing agent
- It's been on market 34 days. Have you received any prior offers? Is the seller open to a 3% concession, seller financing, or rate buy-down credit?
- Built in 1967 — when were the roof, HVAC, electrical panel, plumbing, and water heater last replaced?
- Property tax is high relative to price — has the assessment been appealed recently, and will the sale trigger a re-assessment?
- Is there a deadline driving the sale (1031 exchange, divorce, estate, relocation)? That informs how much negotiation room exists.
- Crime grade is F in this area — have there been break-ins, vandalism, or insurance claims at this property in the last 3 years? What carrier currently insures it and at what premium?
- What's the average days-on-market for RENTAL listings here right now (not sales)? A rising rental-DOM trend means longer vacancies and softer asking-rent achievability than the comps imply.
- What's the recent tenant-quality profile in this submarket — average credit score on applications, eviction rate, late-payment / NSF rate, and stable-employment percentage? A property-management company in the area should have these aggregated.
- How much new for-sale + rental construction is in the pipeline within 1–3 miles? Heavy new supply typically softens prices + rents 12–24 months out; constrained supply supports both.
Investment metrics
- 1% rule
- 1.17% ✓
- Cap rate
- 6.47%
- Cash-on-cash
- 0.64%
- DSCR
- 1.03
- GRM
- 7.1
CMA / ARV
- ARV (on-the-fly)
- $215,688
- Comps found
- 3
Show comp detail 3 sales within ~0.75 mi
| Address | Dist | Beds/Ba | Sqft | Sold | Price | $/sf | Match |
|---|---|---|---|---|---|---|---|
| 3326 Easy Bend Dr | 0.23mi | 3/1.5 | 1,210 (-4%) | 4mo | $197,000 | $163 | 78 |
| 10803 Edgecrest | 0.10mi | 3/2.0 | 1,135 (-10%) | 2mo | $199,900 | $176 | 78 |
| 3323 Easy Bnd | 0.26mi | 3/1.0 | 1,160 (-8%) | 22mo | $199,999 | $172 | 53 |
Match score weights: distance 35% · size 25% · config 20% · recency 20%. Top-matched comps best support the ARV.
Projected returns pro-forma
3.0% appreciation · 3.0% rent growth · sell at horizon
- IRR
- 8.2%
- Equity multiple
- 1.47×
- Total profit
- $15,779
- Equity at exit
- $53,957
- IRR
- 10.9%
- Equity multiple
- 2.63×
- Total profit
- $54,840
- Equity at exit
- $83,154
Cash invested: $33,600 (down + closing). Projections, not guarantees.
Landlord ↔ Tenant lean methodology
- Overall (STATE)
- 87 Strongly Landlord-Friendly
- State Texas
- 87 Strongly Landlord-Friendly · R+5
- County
- — inherits STATE
- City
- — inherits STATE
ZIP-level market 78217-2833
- Active inventory
- 1
- Price-to-rent
- 7.1×
Monthly cashflow live
- Estimated rent
- $1,403 high interval (Pro) →
- Mortgage (P&I)
- −$629
- Tax from tax record
- −$411 /mo · $4,937/yr
- Insurance
- −$50
- HOA
- −$0
- Vacancy / Maint / Mgmt
- −$295
- Net cashflow
- $18
Break-even live
Sensitivity live
| Price | -10% $86 | -5% $52 | +0% $18 | +5% $-16 | +10% $-50 |
|---|---|---|---|---|---|
| Rent | -10% $-93 | -5% $-38 | +0% $18 | +5% $73 | +10% $129 |
| Rate | -1.0pp $78 | -0.5pp $48 | base $18 | +0.5pp $-13 | +1.0pp $-45 |
UW: 25.0% down · 7.5% · 30yr · 1.5% tax · 5.0% vac · 8.0% maint · 8.0% mgmt
Financing live
Cash to close
- Down payment
- $30,000
- Closing costs
- $3,600
- Reserves months
- —
- Total cash needed
- —
Loan-product check · same deal, 3 products live
Conventional
25% down · 7.5% · 30yr
- Down + closing
- —
- Monthly P&I
- —
- Monthly cashflow
- —
- DSCR
- —
- Eligible?
- —
Personal DTI + credit; lowest rate.
DSCR
20% down · 8.5% · 30yr
- Down + closing
- —
- Monthly P&I
- —
- Monthly cashflow
- —
- DSCR
- —
- Eligible?
- —
No personal income docs; deal must DSCR.
Hard money
10% down · 12.0% · 12mo
- Down + closing
- —
- Monthly P&I
- —
- Monthly cashflow
- —
- DSCR
- —
- Eligible?
- —
Short-term bridge; refi at stabilization.
Rent comps 40 comps
| Address | Beds | Baths | Sqft | Rent | $/sqft | DOM | Units | Dist |
|---|---|---|---|---|---|---|---|---|
| 10631 Nacogdoches Rd Unit 710 San Antonio, TX | 2.0 | 2.0 | 929 | $1,414 | $1.52 | 12d | 1 | 0.15mi |
| 10631 Nacogdoches Rd San Antonio, TX | 1.0–2.0 | 1.0–2.0 | 748 | $1,280 | $1.71 | 3d | 12 | 0.17mi |
| 3518 Herron Ct San Antonio, TX | 3.0 | 2.0 | 1772 | $1,800 | $1.02 | 25d | 1 | 0.37mi |
| 3800 Perrin Central Blvd San Antonio, TX | 1.0–3.0 | 1.0–2.0 | 940 | $1,789 | $1.90 | 25d | 35 | 0.74mi |
| 3800 Perrin Central Blvd San Antonio, TX | 1.0–3.0 | 1.0–2.0 | 940 | $1,769 | $1.88 | 45d | 38 | 0.74mi |
| 3902 Perrin Central Blvd Unit 710 San Antonio, TX | 2.0 | 2.0 | 976 | $940 | $0.96 | 23d | 1 | 0.89mi |
| 3270 Nacogdoches Rd San Antonio, TX | 1.0–2.0 | 1.0–2.0 | 712 | $1,150 | $1.62 | 5d | 1 | 0.90mi |
| 3848 Maverick Creek Rd San Antonio, TX | 2.0 | 2.0 | 982 | $1,195 | $1.22 | 45d | 1 | 0.91mi |
| 3787 Perrin Central Blvd Apt 710 San Antonio, TX | 2.0 | 2.0 | 892 | $961 | $1.08 | 0d | 1 | 0.91mi |
| 3902 Perrin Central Blvd San Antonio, TX | 1.0–2.0 | 1.0–2.0 | 777 | $1,424 | $1.83 | 0d | 29 | 0.97mi |
| 3919 Perrin Central Blvd San Antonio, TX | 1.0–2.0 | 1.0–2.0 | 778 | $1,185 | $1.52 | 0d | 42 | 1.02mi |
| 12106 Ridge Ct San Antonio, TX | 3.0 | 2.0 | 1206 | $1,625 | $1.35 | 25d | 1 | 1.06mi |
| 12228 Ridge Crown St San Antonio, TX | 2.0 | 2.0 | 980 | $1,100 | $1.12 | 9d | 1 | 1.13mi |
| 12219 Ridge Crown St San Antonio, TX | 2.0 | 2.0 | 1004 | $1,200 | $1.20 | 45d | 1 | 1.13mi |
| 10527 Perrin Beitel Rd San Antonio, TX | 1.0–2.0 | 1.0–2.0 | 899 | $1,200 | $1.33 | 0d | 2 | 1.13mi |
| 3614 Ridge Dawn St San Antonio, TX | 3.0 | 3.0 | 1207 | $1,749 | $1.45 | 16d | 1 | 1.14mi |
| 3843 Barrington St Unit 242K San Antonio, TX | 2.0 | 2.0 | 884 | $1,495 | $1.69 | 18d | 1 | 1.19mi |
| 3843 Barrington St Unit 165Q San Antonio, TX | 2.0 | 2.0 | 888 | $995 | $1.12 | 45d | 1 | 1.19mi |
| 3843 Barrington St San Antonio, TX | 1.0–2.0 | 1.0 | 869 | $1,300 | $1.50 | 45d | 2 | 1.20mi |
| 2935 Nacogdoches Rd San Antonio, TX | 1.0–2.0 | 1.0–2.0 | 998 | $1,300 | $1.30 | 45d | 2 | 1.20mi |
| 3903 Barrington St Apt 710 San Antonio, TX | 2.0 | 2.0 | 1004 | $919 | $0.92 | 0d | 1 | 1.20mi |
| 10014 Broadway San Antonio, TX | 1.0–3.0 | 1.0–2.0 | 1062 | $1,540 | $1.45 | 25d | 15 | 1.21mi |
| 12219 Ridge Cave St San Antonio, TX | 3.0 | 2.0 | 1177 | $2,200 | $1.87 | 45d | 1 | 1.22mi |
| 4110 First View Dr San Antonio, TX | 3.0 | 2.0 | 1361 | $1,600 | $1.18 | 45d | 1 | 1.23mi |
| 4110 First View Dr San Antonio, TX | 3.0 | 2.0 | 1361 | $1,600 | $1.18 | 25d | 1 | 1.23mi |
| 4138 Clear Spring Dr San Antonio, TX | 3.0 | 2.0 | 1435 | $1,650 | $1.15 | 45d | 1 | 1.28mi |
| 4411 Terra Summit Rd San Antonio, TX | 3.0 | 2.0 | 1193 | $1,300 | $1.09 | 25d | 1 | 1.28mi |
| 11206 Center Point Rd San Antonio, TX | 2.0 | 2.0 | 1000 | $1,225 | $1.23 | 23d | 1 | 1.28mi |
| 4409 Terra Summit Rd San Antonio, TX | 2.0 | 2.0 | 982 | $1,195 | $1.22 | 45d | 1 | 1.28mi |
| 11207 Terra Loop Rd San Antonio, TX | 2.0 | 2.0 | 980 | $1,225 | $1.25 | 23d | 1 | 1.29mi |
| 11214 Center Point Rd San Antonio, TX | 3.0 | 2.0 | 1180 | $1,320 | $1.12 | 45d | 1 | 1.30mi |
| 11211 Terra Loop Rd San Antonio, TX | 2.0 | 2.0 | 982 | $1,225 | $1.25 | 25d | 1 | 1.30mi |
| 12015 Stoney Pass San Antonio, TX | 3.0 | 2.0 | 1083 | $1,650 | $1.52 | 45d | 1 | 1.30mi |
| 11607 Capotillo St Unit 4 San Antonio, TX | 2.0 | 1.5 | 968 | $1,020 | $1.05 | 18d | 1 | 1.32mi |
| 3510 Stoney Dawn San Antonio, TX | 3.0 | 2.0 | 1067 | $1,850 | $1.73 | 23d | 1 | 1.32mi |
| 4322 Vespero San Antonio, TX | 3.0 | 2.0 | 1499 | $1,600 | $1.07 | 18d | 1 | 1.33mi |
| 9511 Perrin Beitel Apt 710 San Antonio, TX | 2.0 | 2.0 | 1000 | $973 | $0.97 | 0d | 1 | 1.33mi |
| 8800 Starcrest Dr San Antonio, TX | 1.0–4.0 | 1.0–2.5 | 1196 | $1,299 | $1.09 | 0d | 16 | 1.34mi |
| 11235 Terra Loop Rd San Antonio, TX | 2.0 | 2.0 | 982 | $1,225 | $1.25 | 25d | 1 | 1.35mi |
| 4242 Bayliss St San Antonio, TX | 3.0 | 2.0 | 1446 | $1,725 | $1.19 | 45d | 1 | 1.35mi |
Listing history 8 events
-
2026-04-09soldstatus
-
2026-02-11soldstatus
-
2025-02-24status Pending
-
2025-02-12historical Active Option
-
2025-02-06price $120,000
-
2025-01-21$158,860 New
-
2017-02-21soldstatus
-
2001-02-12soldstatus
ⓘ Source: listings_history table (triggers on properties + properties_extension) + one-shot
backfill from property_details.listing_events for pre-trigger history.
Tax reassessment forecast TX · Resets to sale price
- Current annual tax
- $4,937 · $411/mo
- Projected year-2 tax
- $4,937 · $411/mo
- Expected delta
- $0/yr ($0/mo · 0.0%)
ⓘ Screening estimate from a state-policy table — verify with the county assessor before closing.
Climate risk First Street
- Flood 5/10 Major FEMA zone X (unshaded) · 24% chance over 30 yrs
- Wildfire 1/10 Low
- Heat 8/10 Severe 7 d/yr ≥108°F today · 22 d/yr by 30 yrs out
- Wind 6/10 Major 74% chance of damaging wind over 30 yrs
- Air quality 2/10 Low 0 unhealthy d/yr today · 1 by 30 yrs out
Nearby sold comps map
Loading sold comps map…
Walkable amenities ~0.75 mi
Loading nearby amenities…
Taxation est. · year 1
- Rental income
- $16,839
- − Mortgage interest
- −$6,722
- − Property taxes
- −$4,937
- − Insurance
- −$600
- − Repairs & maintenance
- −$1,347
- − Management
- −$1,347
- − Depreciation
- −$3,491
- Taxable loss
- −$1,604
- Est. tax savings @ 24.0%
- +$385
- After-tax cash flow
- $600/yr
For passive investors: Depreciation is non-cash, so a rental often shows a tax loss while cash-flowing — sheltering income. Rental losses are passive: they offset passive income freely, and up to $25,000/yr can offset ordinary (W-2) income if you actively participate and your MAGI is under $100k (phasing out to $0 by $150k); unused losses carry forward. On sale, claimed depreciation is recaptured at up to 25%, and gains may owe capital-gains tax (a 1031 exchange can defer both). Figures are a year-1 estimate at your 24.0% rate — not tax advice; consult a CPA.
Schools (NCES district)
- District
- North East ISD
- NCES district ID
- 4832940
- Math proficiency
- 38% ▼ -14.00%
- Reading proficiency
- 49% ▼ -4.00%
- Median HH income
- $57,715
- Composite
- 38.1/100
- National rank
- #4276
- State rank
- #276 of 826 in TX
Livability — San Antonio
- Score
- 80/100
- State rank
- #31
- US rank
- #1616
Category grades
Schools grade is shown separately in the Schools card above.
Census & demographics
- Census place
- San Antonio, TX
Population outlook (Bexar County) Hauer SSP2
- Today (2025)
- 2,336,851 people
- By 2030
- 2,560,728 · +9.6%
- By 2040
- 3,020,569 · +29.3%
- By 2050
- 3,493,522 · +49.5%
- By 2075
- 4,668,459 · +99.8%
- By 2100
- 5,533,242 · +136.8%
Not yet ingested
- Political lean
- —
- Race & ethnicity
- —
- Common origin
- —
- Civics
- —
Market trends
- HPI YoY
- —
- Current HPI
- —
- Rent YoY
- —
- Metro
- —
- State GDP YoY
- ▲ 3.95%
- F500 in state
- 110
Industry mix (Fortune 500 HQ in TX)
| Industry | F500 HQs | Revenue |
|---|---|---|
| Energy | 16 | $1,198B |
|
||
| Technology | 5 | $198B |
|
||
| Engineering / Construction | 4 | $72B |
|
||
| Energy Services | 3 | $60B |
|
||
| Utilities | 3 | $41B |
|
||
| Healthcare | 2 | $330B |
|
||
Price history
-24.5% since first listed8 events — show timeline
- 2026-04-09 Sold (Public Records) — Public Records
- 2026-02-11 Sold (Public Records) — Public Records
- 2025-02-24 Pending — LERA
- 2025-02-12 Contingent — LERA
- 2025-02-06 Price Changed $120,000 LERA
- 2025-01-21 Listed $158,860 LERA
- 2017-02-21 Sold (Public Records) — Public Records
- 2001-02-12 Sold (Public Records) — Public Records
Property tax history
+7.3%/yrLatest (2025): $4,937 · +1.2% YoY. Source: county tax records.
Cash-flow waterfall
monthlySold comps — $/sqft
last 12 mo · ≤1 miLoading sold comps…