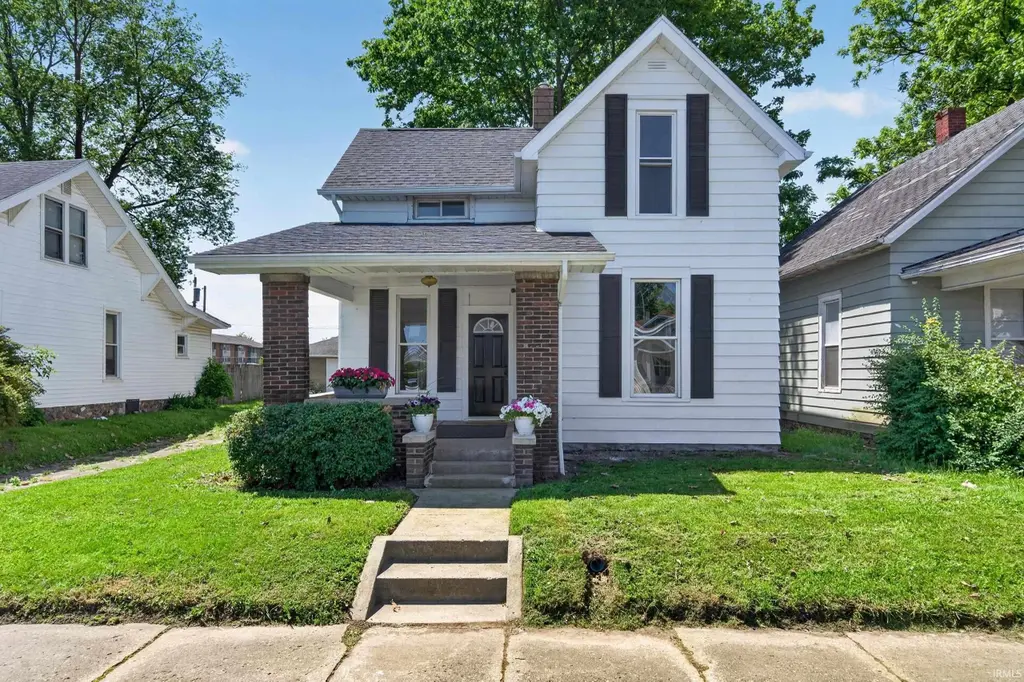
719 W 2nd St · Marion, IN
Flood risk 1/10 · Minimal
- FEMA flood zone
- X (unshaded)
- Chance of flooding over 30 yrs
- 0.0%
- Est. flood insurance / yr
- $473 – $860
Fire risk 1/10 · Minimal
- Est. fire insurance / yr
- $717 – $1,331
Heat risk 3/10 · Minor
- Hot days now (above 100°F)
- 7 days/yr
- Hot days in 30 yrs
- 18 days/yr
Wind risk 2/10 · Minimal
- Chance of severe wind over 30 yrs
- —
Air-quality risk 2/10 · Minimal
- Unhealthy air days now
- 1 days/yr
- Unhealthy air days in 30 yrs
- 3 days/yr
Risk factors via First Street. Map © Google.
Why this score? — see what drove the D grade
The composite is a weighted blend of 9 inputs, each scored 0–100. Each bar is that input's sub-score; the figure is the points it added to the 100-point composite (weight × sub-score).
- Cash flow +15.8/30.0
- ARV discount +5.9/15.0
- DSCR +4.9/10.0
- 1% rule +3.6/10.0
- Livability +3.2/5.0
- Rent growth +2.5/5.0
- Condition / age +2.5/5.0
- Schools +1.7/10.0
- Appreciation +0.0/10.0
$134,900
🖨 Deal sheet 📄 Offer letter ✓ Due diligence
Listing remarks
NEWLY RENOVATED AND MUST SEE! This one is a charmer! Step into the large foyer area that leads into the large living space on the main level adorned with high ceilings, all new paint and flooring. The main level also features the completely renovated kitchen featuring all new cabinetry, countertops and brand-new appliances that will remain. A laundry room and half bath have been added as well. The upper-level features 4 bedrooms and a brand-new full bathroom. All new carpet, ceramic tile, LVP and refinished natural hardwood floors throughout. The water heater, furnace, central air and electrical panel are all new. New wood privacy fence encases the back yard. The garage is a one car detache
Key facts
- Large foyer area
- Brand new appliances
- Large living space
Tags
Property features AI
Finance
- HOA & community: No association amenities
Exterior
- Parking: Detached garage (1 car); Shared driveway
- Utilities: Public water; Public sewer; Cable available; Electric service
- Home design: Single-family residence, site-built; 2 stories
- Construction: Aluminum siding; Asphalt shingle roof; Built above grade (finished area listed)
- Exterior features: Covered porch; Patio; Fenced yard with full privacy wood fence; Level lot; Asphalt road access (public maintained)
Interior
- Kitchen: Dishwasher; Microwave; Refrigerator; Electric range
- Flooring: Carpet; Vinyl; Ceramic tile
- Bathrooms: 1 full bathroom; 1 half bathroom; One main-level bathroom
- Heating & cooling: Natural gas forced-air heating; Central air conditioning
- Interior features: Entrance foyer; Laminate counters; Partial basement with crawl space and sump pump; One fireplace
- Laundry & utility: Washer hookup on main level; Electric dryer hookup on main level; Electric water heater
Neighborhood map
What this means for you Summary
Snapshot
- This is a 3-bed/1.5-bath single-family listed at $135k.
Deal economics
- At list price, monthly cash flow is $63 ($754/yr) — positive.
- The deal already cash-flows at list — no discount required.
- To meet the 1% rule (rent ≥ 1% of price), the offer needs to be $116k (14.2% below list).
- Recommended offer: $116k (14.2% below list) — sets the bar for 1% rule.
- Cap rate 6.9% vs local median 8.7% in Marion — below-typical yield; the buyer is paying a premium for something (appreciation thesis, condition, location) that the cap rate doesn't capture.
Location & tenants
- Location reads 65/100 on livability (#337 in IN) — a middle-class / working-renter tenant base. Strengths: crime A+, cost of living A+, housing A+; Watch: amenities F, commute F, employment F.
- Marion Community Schools (town): math 18% / reading 24% proficiency, ranked #277 of 301 in IN (top 92%) — low school quality limits family demand, transient renter base, plan for 1-2y turnover; 67% free/reduced lunch — lower-income household profile, screen leases tightly.
- Zoned schools: Riverview Elementary School (math 42% / reading 27%, grade F, #597 of 994 statewide, top 63%, 396 students, 72% FRL); John L Mcculloch Junior High Sch (math 11% / reading 22%, grade F, #287 of 330 statewide, top 88%, 524 students, 74% FRL); Marion High School (math 12% / reading 47%, grade F, #308 of 369 statewide, top 84%, 1,050 students, 66% FRL) — zoned schools at 71% FRL track the district average.
- Market conditions: 124 active listings in the ZIP; 4 comparable units currently listed for rent nearby; rentals lingering (median 44d on market — plan ~5-8 weeks vacancy on turnover, expect pricing pressure); 100% of comp listings sitting > 30 days — soft ceiling on asking rent; 52 units permitted in Grant County in 2024 (8 in 5+ unit buildings).
Forward outlook
- Local home prices are declining (-3.0%/yr); year-one equity from $933 of loan paydown is wiped out by about $4k of value loss. Plan a longer hold.
- Grant County population projected at -18% by 2050 — secular population decline; favor cash flow + early exit over multi-decade hold.
Negotiation context
- It's been on market 21 days — a 2% lower offer ($133k) is reasonable based on typical stale-listing flexibility.
Risks & watch-outs
- Watch-outs: built in 1900 — expect roof / HVAC / electrical / plumbing capex.
Questions for the listing agent
- Built in 1900 — when were the roof, HVAC, electrical panel, plumbing, and water heater last replaced?
- Is there a deadline driving the sale (1031 exchange, divorce, estate, relocation)? That informs how much negotiation room exists.
- Schools are F-rated, which usually means shorter tenancies and higher turnover. Who's the typical renter profile here, and what's been the actual vacancy rate?
- The area grade is low — what's the realistic commute time and amenity access for the typical tenant pool here? Any planned neighborhood developments (good or bad) we should know about?
- What's the average days-on-market for RENTAL listings here right now (not sales)? A rising rental-DOM trend means longer vacancies and softer asking-rent achievability than the comps imply.
- What's the recent tenant-quality profile in this submarket — average credit score on applications, eviction rate, late-payment / NSF rate, and stable-employment percentage? A property-management company in the area should have these aggregated.
- How much new for-sale + rental construction is in the pipeline within 1–3 miles? Heavy new supply typically softens prices + rents 12–24 months out; constrained supply supports both.
Investment metrics
- 1% rule
- 0.86% ✗
- Cap rate
- 6.85%
- Cash-on-cash
- 2.00%
- DSCR
- 1.09
- GRM
- 9.7
CMA / ARV
- ARV (on-the-fly)
- $130,200
- Comps found
- 12
Show comp detail 12 sales within ~0.75 mi
| Address | Dist | Beds/Ba | Sqft | Sold | Price | $/sf | Match |
|---|---|---|---|---|---|---|---|
| 205 N F St | 0.27mi | 3/2.0 | 1,412 (+1%) | 1mo | $164,900 | $117 | 83 |
| 716 W 7th St | 0.29mi | 2/1.0 (-1) | 1,409 (+1%) | 3mo | $65,000 | $46 | 75 |
| 1015 W 3rd St | 0.20mi | 2/1.5 (-1) | 1,298 (-7%) | 7mo | $76,900 | $59 | 67 |
| 221 N D St | 0.21mi | 3/2.0 | 1,221 (-13%) | 2mo | $144,500 | $118 | 65 |
| 1515 W 4th St | 0.57mi | 3/1.0 | 1,361 (-3%) | 3mo | $161,500 | $119 | 64 |
| 614 W 5th St | 0.19mi | 4/2.0 (+1) | 1,574 (+12%) | 0mo | $99,000 | $63 | 63 |
| 229 W Spencer Ave | 0.28mi | 2/1.5 (-1) | 1,214 (-13%) | 1mo | $115,000 | $95 | 59 |
| 636 W 1st St | 0.10mi | 2/1.0 (-1) | 1,218 (-13%) | 11mo | $113,200 | $93 | 58 |
| 215 N G St | 0.34mi | 3/1.0 | 1,242 (-11%) | 12mo | $25,000 | $20 | 54 |
| 820 N Oxford Dr | 0.69mi | 3/1.0 | 1,492 (+7%) | 2mo | $155,000 | $104 | 53 |
| 617 Berkley Dr | 0.47mi | 2/1.5 (-1) | 1,564 (+12%) | 3mo | $145,000 | $93 | 51 |
| 1323 W Jeffras Ave | 0.53mi | 3/1.0 | 1,193 (-15%) | 12mo | $79,000 | $66 | 38 |
Match score weights: distance 35% · size 25% · config 20% · recency 20%. Top-matched comps best support the ARV.
Projected returns pro-forma
-3.0% appreciation · 3.0% rent growth · sell at horizon
- IRR
- -13.2%
- Equity multiple
- 0.53×
- Total profit
- $-17,891
- Equity at exit
- $20,114
- IRR
- -4.2%
- Equity multiple
- 0.72×
- Total profit
- $-10,557
- Equity at exit
- $11,664
Cash invested: $37,772 (down + closing). Projections, not guarantees.
Landlord ↔ Tenant lean methodology
- Overall (STATE)
- 90 Strongly Landlord-Friendly
- State Indiana
- 90 Strongly Landlord-Friendly · R+11
- County
- — inherits STATE
- City
- — inherits STATE
ZIP-level market 46952
- Home prices YoY
- -29.9%
- Active inventory
- 124
- Price-to-rent
- 9.7×
Monthly cashflow live
- Estimated rent
- $1,158 medium interval (Pro) →
- Mortgage (P&I)
- −$707
- Tax from tax record
- −$88 /mo · $1,060/yr
- Insurance
- −$56
- HOA
- −$0
- Vacancy / Maint / Mgmt
- −$243
- Net cashflow
- $63
Break-even live
UW: 25.0% down · 7.5% · 30yr · 1.5% tax · 5.0% vac · 8.0% maint · 8.0% mgmt
Financing live
Cash to close
- Down payment
- $33,725
- Closing costs
- $4,047
- Reserves months
- —
- Total cash needed
- —
Loan-product check · same deal, 3 products live
Conventional
25% down · 7.5% · 30yr
- Down + closing
- —
- Monthly P&I
- —
- Monthly cashflow
- —
- DSCR
- —
- Eligible?
- —
Personal DTI + credit; lowest rate.
DSCR
20% down · 8.5% · 30yr
- Down + closing
- —
- Monthly P&I
- —
- Monthly cashflow
- —
- DSCR
- —
- Eligible?
- —
No personal income docs; deal must DSCR.
Hard money
10% down · 12.0% · 12mo
- Down + closing
- —
- Monthly P&I
- —
- Monthly cashflow
- —
- DSCR
- —
- Eligible?
- —
Short-term bridge; refi at stabilization.
Rent comps 4 comps
| Address | Beds | Baths | Sqft | Rent | $/sqft | DOM | Units | Dist |
|---|---|---|---|---|---|---|---|---|
| 715 E Sherman St Marion, IN | 2.0 | 1.0 | 1085 | $1,050 | $0.97 | 43d | 1 | 1.12mi |
| 2116 W 2nd St Marion, IN | 1.0–2.0 | 1.0 | 764 | $945 | $1.24 | 43d | 1 | 1.14mi |
| 2145 W 2nd St Marion, IN | 3.0 | 1.5 | 1377 | $1,650 | $1.20 | 43d | 1 | 1.25mi |
| 2111 W Frederick Dr Marion, IN | 1.0–2.0 | 1.0–1.5 | 965 | $937 | $0.97 | 43d | 4 | 1.43mi |
Listing history 14 events
-
2026-06-19days on market $134,900 Active 21 DOM
-
2026-06-18days on market $134,900 Active 20 DOM
-
2026-06-17days on market $134,900 Active 19 DOM
-
2026-06-16days on market $134,900 Active 18 DOM
-
2026-06-15days on market $134,900 Active 17 DOM
-
2026-06-14days on market $134,900 Active 15 DOM
-
2026-06-12pricedays on market $134,900 Active 14 DOM
-
2026-06-09days on market $139,900 Active 11 DOM
-
2026-06-08days on market $139,900 Active 10 DOM
-
2026-06-07days on market $139,900 Active 9 DOM
-
2026-06-02days on market $139,900 Active 4 DOM
-
2026-06-01days on market $139,900 Active 3 DOM
-
2026-05-31days on market $139,900 Active 2 DOM
-
2026-05-29$139,900 Active
ⓘ Source: listings_history table (triggers on properties + properties_extension) + one-shot
backfill from property_details.listing_events for pre-trigger history.
Tax reassessment forecast IN · Partial reset (capped growth)
- Current annual tax
- $1,060 · $88/mo
- Projected year-2 tax
- $1,103 · $92/mo
- Expected delta
- +$43/yr (+$4/mo · 4.1%)
ⓘ Screening estimate from a state-policy table — verify with the county assessor before closing.
Climate risk First Street
- Flood 1/10 Low FEMA zone X (unshaded) · 0% chance over 30 yrs
- Wildfire 1/10 Low
- Heat 3/10 Moderate 7 d/yr ≥100°F today · 18 d/yr by 30 yrs out
- Wind 2/10 Low
- Air quality 2/10 Low 1 unhealthy d/yr today · 3 by 30 yrs out
Nearby sold comps map
Loading sold comps map…
Walkable amenities ~0.75 mi
Loading nearby amenities…
Taxation est. · year 1
- Rental income
- $13,896
- − Mortgage interest
- −$7,556
- − Property taxes
- −$1,060
- − Insurance
- −$674
- − Repairs & maintenance
- −$1,112
- − Management
- −$1,112
- − Depreciation
- −$3,924
- Taxable loss
- −$1,543
- Est. tax savings @ 24.0%
- +$370
- After-tax cash flow
- $1,124/yr
For passive investors: Depreciation is non-cash, so a rental often shows a tax loss while cash-flowing — sheltering income. Rental losses are passive: they offset passive income freely, and up to $25,000/yr can offset ordinary (W-2) income if you actively participate and your MAGI is under $100k (phasing out to $0 by $150k); unused losses carry forward. On sale, claimed depreciation is recaptured at up to 25%, and gains may owe capital-gains tax (a 1031 exchange can defer both). Figures are a year-1 estimate at your 24.0% rate — not tax advice; consult a CPA.
Schools (NCES district)
- District
- Marion Community Schools
- NCES district ID
- 1806390
- Math proficiency
- 18% ▼ -9.00%
- Reading proficiency
- 24% ▼ -6.00%
- Median HH income
- $33,415
- Composite
- 17.13/100
- National rank
- #9115
- State rank
- #277 of 301 in IN
Livability — Marion
- Score
- 65/100
- State rank
- #337
- US rank
- #13006
Category grades
Schools grade is shown separately in the Schools card above.
Census & demographics
- Census place
- Marion, IN
- County
- Grant County · 41,561 people
- City population
- 41,561
- Metro
- Marion, IN
- Population (ZIP)
- 18,189
- Household income
- $52,880
- Rent vs Own
- Severe rent burden
- 662.0
Population outlook (Grant County) Hauer SSP2
- Today (2025)
- 64,394 people
- By 2030
- 62,145 · -3.5%
- By 2040
- 57,252 · -11.1%
- By 2050
- 52,968 · -17.7%
- By 2075
- 45,986 · -28.6%
- By 2100
- 39,400 · -38.8%
Race, ethnicity, and origin ACS 2023
- Neighborhood character
- Predominantly White (84%)
- Race & ethnicity
- White 84% Two or more races 7% Hispanic / Latino 5% Black 4% Asian 1%
- Hispanic origin (detail)
- Mexican 4%
- Common ancestry
- Italian 3% Romanian 1% Iranian 1%
- Foreign-born
- 4% · Canada
- Languages at home
- 96% English-only · Spanish 3%
Political lean MEDSL · Grant
- 2024 margin
- Solid R (+41.8) · D 28.2% · R 70.0% · Other 1.9%
- 2008→2024 swing
- -28.7pp toward R · 2008: -13.1pp · 2024: -41.8pp
- All cycles
- 2024: R+41.8 2020: R+38.8 2016: R+39.5 2012: R+22.0 2008: R+13.1
Not yet ingested
- Civics
- —
Market trends
- HPI YoY
- ▼ -76.69%
- Current HPI
- 180.1174
- Rent YoY
- —
- Metro
- Marion, IN
- State GDP YoY
- ▲ 2.90%
- F500 in state
- 18
Industry mix (Fortune 500 HQ in IN)
| Industry | F500 HQs | Revenue |
|---|---|---|
| Industrial Machinery | 2 | $37B |
|
||
| Healthcare | 1 | $177B |
|
||
| Pharmaceuticals | 1 | $45B |
|
||
| Metals / Steel | 1 | $18B |
|
||
| Agriculture | 1 | $17B |
|
||
| Packaging | 1 | $12B |
|
||
Price history
1 event — show timeline
- 2026-05-29 Listed $139,900 IRMLS
Property tax history
-3.3%/yrLatest (2025): $1,060 · -0.7% YoY. Source: county tax records.
Cash-flow waterfall
monthlySold comps — $/sqft
last 12 mo · ≤1 miLoading sold comps…