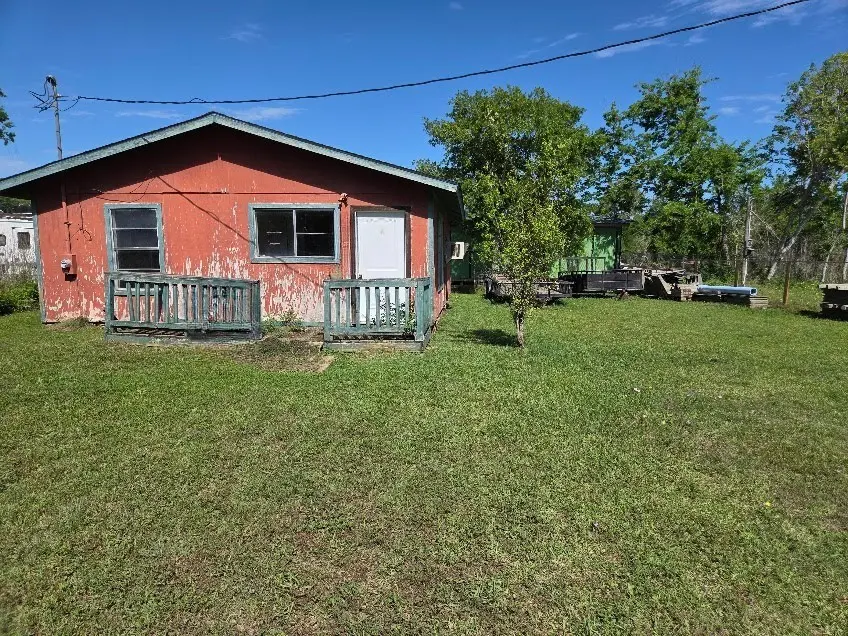
62 Guinevere Dr · Sargent, TX
Flood risk 7/10 · Major
- FEMA flood zone
- AE
- Chance of flooding over 30 yrs
- 0.76%
- Est. flood insurance / yr
- $1,737 – $8,500
Fire risk 3/10 · Minor
- Est. fire insurance / yr
- $1,222 – $2,270
Heat risk 10/10 · Severe
- Hot days now (above 117°F)
- 6 days/yr
- Hot days in 30 yrs
- 20 days/yr
Wind risk 9/10 · Severe
- Chance of severe wind over 30 yrs
- 99.0%
Air-quality risk 2/10 · Minimal
- Unhealthy air days now
- 1 days/yr
- Unhealthy air days in 30 yrs
- 1 days/yr
Risk factors via First Street. Map © Google.
Why this score? — see what drove the B+ grade
The composite is a weighted blend of 9 inputs, each scored 0–100. Each bar is that input's sub-score; the figure is the points it added to the 100-point composite (weight × sub-score).
- Cash flow +30.0/30.0
- ARV discount +15.0/15.0
- 1% rule +10.0/10.0
- DSCR +10.0/10.0
- Rent growth +3.3/5.0
- Schools +3.1/10.0
- Livability +2.5/5.0
- Condition / age +2.5/5.0
- Appreciation +0.0/10.0
$55,999
🖨 Deal sheet 📄 Offer letter ✓ Due diligence
Listing remarks MLS
FIXER UPPER NEAR THE BEACH! If you are a handyman and looking for a fixer upper NEAR SARGENT BEACH this might be it. This home has two bedrooms, one bathroom and a lot of potential. WE MAKE IT EASY TO OWN. This is a great opportunity! Don't wait, call us today to see if we can put the deed in your name and make this your dream property.
Key facts
- 2,178 sq ft lot
- Built 1994
- Listed 249 days
Neighborhood map
What this means for you Summary
Snapshot
- This is a 2-bed/1.0-bath single-family listed at $56k.
Deal economics
- At list price, monthly cash flow is $-24 ($-293/yr) — negative.
- To cash-flow at today's rent, offer at most $52k (7.7% below list).
- Meets the 1% rule at list price ($973 rent vs $56k).
- Recommended offer: $49k (12.0% below list) — sets the bar for market timing.
Location & tenants
- Location reads: area grade B — affects rentability + tenant quality, not the cash-flow math above.
- Van Vleck ISD (town): math 36% / reading 37% proficiency, ranked #492 of 826 in TX (top 60%) — families likely to look elsewhere, expect single-tenant / working-renter base with shorter leases.
- Market conditions: Rents rising (+3.3%/yr); 620 active listings in the ZIP; 153 units permitted in Matagorda County in 2024 (0 in 5+ unit buildings).
Forward outlook
- Local home prices are declining (-3.0%/yr); year-one equity from $387 of loan paydown is wiped out by about $2k of value loss. Plan a longer hold.
Negotiation context
- It's been on market 250 days — a 12% lower offer ($49k) is reasonable based on typical stale-listing flexibility.
- 2 sale attempts with the ask held roughly flat each time — persistent listings suggest the price (not the market) is what's stuck; bring a comps-based counter.
Risks & watch-outs
- Watch-outs: flood insurance adds $427/mo.
- Climate carrying-cost: in FEMA flood zone AE (mandatory federal flood insurance); severe wind risk, 99% chance of damaging wind over 30y; extreme-heat days projected 6→20/yr by 2055 (HVAC capex compounding) — expect insurance premiums to compound above CPI over the hold.
Questions for the listing agent
- What do current leases actually rent for vs. the listed asking? Can we see a recent rent roll and the last 12 months of T-12 income?
- It's been on market 250 days. Have you received any prior offers? Is the seller open to a 12% concession, seller financing, or rate buy-down credit?
- What's the actual annual flood-insurance premium (NFIP or private), and is the property in a SFHA with mandatory coverage?
- Why hasn't it sold? Are there any deal-killer items the seller is aware of (foundation, flood, title, zoning, code violations)?
- Is there a deadline driving the sale (1031 exchange, divorce, estate, relocation)? That informs how much negotiation room exists.
- What's the average days-on-market for RENTAL listings here right now (not sales)? A rising rental-DOM trend means longer vacancies and softer asking-rent achievability than the comps imply.
- What's the recent tenant-quality profile in this submarket — average credit score on applications, eviction rate, late-payment / NSF rate, and stable-employment percentage? A property-management company in the area should have these aggregated.
- How much new for-sale + rental construction is in the pipeline within 1–3 miles? Heavy new supply typically softens prices + rents 12–24 months out; constrained supply supports both.
Investment metrics
- 1% rule
- 1.74% ✓
- Cap rate
- 14.91%
- Cash-on-cash
- 30.77%
- DSCR
- 2.37
- GRM
- 4.8
CMA / ARV
- ARV (median comp)
- $102,098
- List price
- $55,999
- Delta
- -45.15%
- Verdict
- UNDERPRICED
- Comps
- 4 within 1.0 mi
Projected returns pro-forma
-3.0% appreciation · 3.28% rent growth · sell at horizon
- IRR
- -18.1%
- Equity multiple
- 0.36×
- Total profit
- $-10,092
- Equity at exit
- $8,350
- IRR
- -8.4%
- Equity multiple
- 0.45×
- Total profit
- $-8,585
- Equity at exit
- $4,842
Cash invested: $15,680 (down + closing). Projections, not guarantees.
Landlord ↔ Tenant lean methodology
- Overall (STATE)
- 87 Strongly Landlord-Friendly
- State Texas
- 87 Strongly Landlord-Friendly · R+5
- County
- — inherits STATE
- City
- — inherits STATE
ZIP-level market 77414
- Home prices YoY
- -17.7%
- Rents YoY
- 3.3%
- Active inventory
- 620
- Price-to-rent
- 4.8×
Monthly cashflow live
- Estimated rent
- $973 medium interval (Pro) →
- Mortgage (P&I)
- −$294
- Tax from tax record
- −$49 /mo · $594/yr
- Insurance
- −$23
- Flood insurance flood zone
- −$427 /mo · $5,118/yr
- HOA
- −$0
- Vacancy / Maint / Mgmt
- −$204
- Net cashflow
- $-24
Break-even live
UW: 25.0% down · 7.5% · 30yr · 1.5% tax · 5.0% vac · 8.0% maint · 8.0% mgmt
Financing live
Cash to close
- Down payment
- $14,000
- Closing costs
- $1,680
- Reserves months
- —
- Total cash needed
- —
Loan-product check · same deal, 3 products live
Conventional
25% down · 7.5% · 30yr
- Down + closing
- —
- Monthly P&I
- —
- Monthly cashflow
- —
- DSCR
- —
- Eligible?
- —
Personal DTI + credit; lowest rate.
DSCR
20% down · 8.5% · 30yr
- Down + closing
- —
- Monthly P&I
- —
- Monthly cashflow
- —
- DSCR
- —
- Eligible?
- —
No personal income docs; deal must DSCR.
Hard money
10% down · 12.0% · 12mo
- Down + closing
- —
- Monthly P&I
- —
- Monthly cashflow
- —
- DSCR
- —
- Eligible?
- —
Short-term bridge; refi at stabilization.
Listing history 20 events
-
2026-06-19days on market $55,999 Active 250 DOM
-
2026-06-18days on market $55,999 Active 249 DOM
-
2026-06-17days on market $55,999 Active 248 DOM
-
2026-06-16days on market $55,999 Active 247 DOM
-
2026-06-15days on market $55,999 Active 246 DOM
-
2026-06-14days on market $55,999 Active 244 DOM
-
2026-06-12days on market $55,999 Active 243 DOM
-
2026-06-09days on market $55,999 Active 240 DOM
-
2026-06-08days on market $55,999 Active 239 DOM
-
2026-06-07days on market $55,999 Active 238 DOM
-
2026-06-07days on market $55,999 Active 237 DOM
-
2026-06-03days on market $55,999 Active 234 DOM
-
2026-06-02days on market $55,999 Active 233 DOM
-
2026-06-01days on market $55,999 Active 232 DOM
-
2026-05-31days on market $55,999 Active 231 DOM
-
2026-05-30days on market $55,999 Active 230 DOM
-
2026-02-19status Active 338-char remark
Show marketing remark (338 chars)
FIXER UPPER NEAR THE BEACH! If you are a handyman and looking for a fixer upper NEAR SARGENT BEACH this might be it. This home has two bedrooms, one bathroom and a lot of potential. WE MAKE IT EASY TO OWN. This is a great opportunity! Don't wait, call us today to see if we can put the deed in your name and make this your dream property.
-
2026-01-23status Pending 338-char remark
Show marketing remark (338 chars)
FIXER UPPER NEAR THE BEACH! If you are a handyman and looking for a fixer upper NEAR SARGENT BEACH this might be it. This home has two bedrooms, one bathroom and a lot of potential. WE MAKE IT EASY TO OWN. This is a great opportunity! Don't wait, call us today to see if we can put the deed in your name and make this your dream property.
-
2025-09-15$55,999 Active 338-char remark
Show marketing remark (338 chars)
FIXER UPPER NEAR THE BEACH! If you are a handyman and looking for a fixer upper NEAR SARGENT BEACH this might be it. This home has two bedrooms, one bathroom and a lot of potential. WE MAKE IT EASY TO OWN. This is a great opportunity! Don't wait, call us today to see if we can put the deed in your name and make this your dream property.
-
2022-04-14soldstatus
ⓘ Source: listings_history table (triggers on properties + properties_extension) + one-shot
backfill from property_details.listing_events for pre-trigger history.
Tax reassessment forecast TX · Resets to sale price
- Current annual tax
- $594 · $49/mo
- Projected year-2 tax
- $1,025 · $85/mo
- Expected delta
- +$431/yr (+$36/mo · 72.5%)
ⓘ Screening estimate from a state-policy table — verify with the county assessor before closing.
Climate risk First Street
- Flood 7/10 Severe FEMA zone AE · 76% chance over 30 yrs
- Wildfire 3/10 Moderate
- Heat 10/10 Extreme 6 d/yr ≥117°F today · 20 d/yr by 30 yrs out
- Wind 9/10 Extreme 99% chance of damaging wind over 30 yrs
- Air quality 2/10 Low 1 unhealthy d/yr today · 1 by 30 yrs out
Nearby sold comps map
Loading sold comps map…
Walkable amenities ~0.75 mi
Loading nearby amenities…
Taxation est. · year 1
- Rental income
- $11,675
- − Mortgage interest
- −$3,137
- − Property taxes
- −$594
- − Insurance
- −$5,398
- − Repairs & maintenance
- −$934
- − Management
- −$934
- − Depreciation
- −$1,629
- Taxable loss
- −$951
- Est. tax savings @ 24.0%
- +$228
- After-tax cash flow
- $-65/yr
For passive investors: Depreciation is non-cash, so a rental often shows a tax loss while cash-flowing — sheltering income. Rental losses are passive: they offset passive income freely, and up to $25,000/yr can offset ordinary (W-2) income if you actively participate and your MAGI is under $100k (phasing out to $0 by $150k); unused losses carry forward. On sale, claimed depreciation is recaptured at up to 25%, and gains may owe capital-gains tax (a 1031 exchange can defer both). Figures are a year-1 estimate at your 24.0% rate — not tax advice; consult a CPA.
Schools (NCES district)
- District
- Van Vleck ISD
- NCES district ID
- 4843950
- Math proficiency
- 36% ▼ -14.00%
- Reading proficiency
- 37% ▼ -8.00%
- Median HH income
- $43,348
- Composite
- 30.96/100
- National rank
- #6106
- State rank
- #492 of 826 in TX
Livability — Sargent
No livability data for this city. (Only ~50 U.S. cities are tracked.)
Census & demographics
- Census place
- Sargent, TX
- County
- Matagorda County · 24,334 people
- Metro
- Bay City, TX
- Population (ZIP)
- 24,334
- Household income
- $59,128
- Rent vs Own
- Severe rent burden
- 1228.0
Population outlook (Matagorda County) Hauer SSP2
- Today (2025)
- 37,148 people
- By 2030
- 37,082 · -0.2%
- By 2040
- 36,987 · -0.4%
- By 2050
- 36,934 · -0.6%
- By 2075
- 37,178 · +0.1%
- By 2100
- 35,184 · -5.3%
Race, ethnicity, and origin ACS 2023
- Neighborhood character
- Diverse neighborhood (Simpson 0.65)
- Race & ethnicity
- Hispanic / Latino 43% White 39% Black 13% Two or more races 13% Asian 2%
- Hispanic origin (detail)
- Mexican 37% Puerto Rican 1%
- Common ancestry
- Lithuanian 1% Slovak 1% Serbian 1%
- Foreign-born
- 12% · Canada
- Languages at home
- 71% English-only · Spanish 26% Other Indo-European 2% German/W. Germanic 1%
Political lean MEDSL · Matagorda
- 2024 margin
- Solid R (+50.5) · D 24.3% · R 74.8%
- 2008→2024 swing
- -23.1pp toward R · 2008: -27.4pp · 2024: -50.5pp
- All cycles
- 2024: R+50.5 2020: R+44.5 2016: R+40.7 2012: R+33.5 2008: R+27.4
Not yet ingested
- Civics
- —
Market trends
- HPI YoY
- ▼ -36.31%
- Current HPI
- 168.9985
- Rent YoY
- ▲ 3.28%
- Metro
- Bay City, TX
- State GDP YoY
- ▲ 3.95%
- F500 in state
- 110
Industry mix (Fortune 500 HQ in TX)
| Industry | F500 HQs | Revenue |
|---|---|---|
| Energy | 16 | $1,198B |
|
||
| Technology | 5 | $198B |
|
||
| Engineering / Construction | 4 | $72B |
|
||
| Energy Services | 3 | $60B |
|
||
| Utilities | 3 | $41B |
|
||
| Healthcare | 2 | $330B |
|
||
Price history
4 events — show timeline
- 2026-02-19 Relisted — HARMLS
- 2026-01-23 Pending — HARMLS
- 2025-09-15 Listed $55,999 HARMLS
- 2022-04-14 Sold (Public Records) — Public Records
Property tax history
+3.6%/yrLatest (2025): $594 · -5.0% YoY. Source: county tax records.
Cash-flow waterfall
monthlySold comps — $/sqft
last 12 mo · ≤1 miLoading sold comps…