 🏗️ New Construction
395 6th St #305 · San Francisco, CA
Flood risk 6/10 · Moderate
- FEMA flood zone
- X (unshaded)
- Chance of flooding over 30 yrs
- 0.68%
- Est. flood insurance / yr
- $507 – $1,088
Fire risk 1/10 · Minimal
- Est. fire insurance / yr
- $659 – $1,223
Heat risk 3/10 · Minor
- Hot days now (above 79°F)
- 8 days/yr
- Hot days in 30 yrs
- 17 days/yr
Wind risk 1/10 · Minimal
- Chance of severe wind over 30 yrs
- —
Air-quality risk 8/10 · Major
- Unhealthy air days now
- 15 days/yr
- Unhealthy air days in 30 yrs
- 15 days/yr
Risk factors via First Street. Map © Google.
Why this score? — see what drove the C grade
The composite is a weighted blend of 9 inputs, each scored 0–100. Each bar is that input's sub-score; the figure is the points it added to the 100-point composite (weight × sub-score).
- Cash flow +15.0/30.0
- ARV discount +7.5/15.0
- Appreciation +7.4/10.0
- 1% rule +5.8/10.0
- Rent growth +5.0/5.0
- Schools +5.0/10.0
- Condition / age +4.8/5.0
- DSCR +4.6/10.0
- Livability +3.8/5.0
$449,000
🖨 Deal sheet 📄 Offer letter ✓ Due diligence
Listing remarks
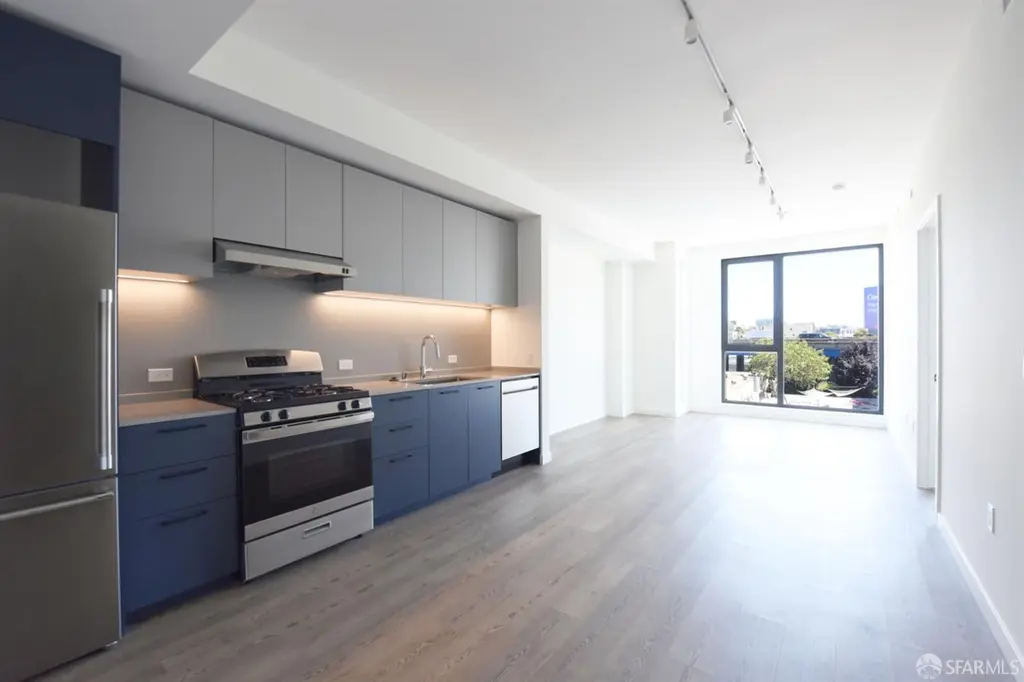
Developer Special, Priced Below City Guidelines. Below Market Rate (BMR) ownership homes at 395 6th Street RENOU is the only new construction BMR opportunity in San Francisco, offering a rare path to ownership in a newly built, design-forward residential community. This two-bedroom faces the east, offering exceptional natural light. The spacious primary bedroom is complemented by a secondary bedroom that works seamlessly for guests, flexible use, or a dedicated home office. A well-balanced split-bedroom layout supports both privacy and adaptability. Paired with an attended lobby and a rooftop terrace above the city, creating a home designed for how San Francisco lives today. Studio,
Key facts
- Rooftop terrace
- Attended lobby
- $589 HOA
Tags
Property features AI
Finance
- HOA & community: Community of 90 units; Monthly HOA fee of $589; Community amenities include a barbecue area and a roof deck; Pets allowed (cats and dogs)
Exterior
- Home design: Contemporary / Modern/High Tech style; New construction; Condominium (attached)
- Construction: Built in 2025; Concrete foundation
- Exterior features: Entry level unit
Interior
- Kitchen: Dishwasher; Garbage disposal; Free-standing gas range
- Bedrooms: 2 bedrooms
- Bathrooms: 2 full bathrooms
- Heating & cooling: Heat pump (heating and cooling)
- Interior features: Heat pump provides heating and cooling; Dishwasher; Garbage disposal; Free-standing gas range
- Laundry & utility: Washer/dryer hookups
Neighborhood map
What this means for you Summary
Snapshot
- This is a 2-bed/2.0-bath condo listed at $449k. Condition is rated excellent.
Deal economics
- At list price, monthly cash flow is $139 ($2k/yr) — positive.
- The deal already cash-flows at list — no discount required.
- Meets the 1% rule at list price ($5k rent vs $449k).
- Cap rate 6.7% vs local median 2.1% in San Francisco — top-decile yield for the area; either an underpriced asset or a hidden risk that comps aren't pricing in. Stress-test before assuming the spread holds.
Location & tenants
- Location reads 76/100 on livability (#90 in CA, #3,143 nationally) — a middle-class / working-renter tenant base. Strengths: amenities A+, commute A+, employment A+; Watch: crime F, cost of living F.
- San Francisco Unified (urban): math 50% / reading 56% proficiency, ranked #322 of 1,400 in CA (top 23%) — acceptable for families but not a draw, mixed tenant base, ~2y average lease.
- Market conditions: Rents rising fast (+18.9%/yr); 136 active listings in the ZIP; 40 comparable units currently listed for rent nearby; rentals leasing fast (median 5d on market — plan ~1-2 weeks tenant-placement turnaround); high-income renter base; 750 units permitted in San Francisco County in 2024 (688 in 5+ unit buildings).
- This rent runs 32% of the median local income ($183k/yr) — at the standard rent-burdened threshold; future hikes will face affordability resistance.
Forward outlook
- In year one you build about $25k of equity ($3k loan paydown + $22k appreciation (4.8% local appreciation)).
- San Francisco County population projected at +39% by 2050 — long-run rental-demand tailwind backs the buy-and-hold thesis.
- At projected returns (4.8% appreciation + 8.0% rent growth), your $126k cash investment doubles in ~4 years — after that, you're playing with house money.
- By year 2, paydown + projected appreciation supports a ~$40k cash-out refi (75% LTV) — recoverable capital for the next deal without selling this one.
Negotiation context
- Only 13 days on market — expect competitive offers; lowballing is unlikely to land.
Risks & watch-outs
- Climate carrying-cost: major flood risk — expect insurance premiums to compound above CPI over the hold.
Questions for the listing agent
- What does the HOA fee cover, when was the last increase, and are there any pending special assessments or reserve-fund shortfalls?
- Any open or pending special assessments — roof, HVAC, plumbing, elevator, façade? What's the per-unit balance and payoff schedule, and is the seller paying it off at close or rolling it to the buyer?
- Is there a deadline driving the sale (1031 exchange, divorce, estate, relocation)? That informs how much negotiation room exists.
- Schools are B-rated — typically a magnet for longer-tenancy family renters. What's the average tenant stay here, and is there a school-zone premium baked into asking?
- Crime grade is F in this area — have there been break-ins, vandalism, or insurance claims at this property in the last 3 years? What carrier currently insures it and at what premium?
- What's the average days-on-market for RENTAL listings here right now (not sales)? A rising rental-DOM trend means longer vacancies and softer asking-rent achievability than the comps imply.
- What's the recent tenant-quality profile in this submarket — average credit score on applications, eviction rate, late-payment / NSF rate, and stable-employment percentage? A property-management company in the area should have these aggregated.
- How much new apartment / multifamily construction is in the pipeline within 1–3 miles? Heavy new supply (>2% of stock underway) typically softens rents 12–24 months out; light construction supports rent growth.
Investment metrics
- 1% rule
- 1.08% ✓
- Cap rate
- 6.67%
- Cash-on-cash
- 1.33%
- DSCR
- 1.06
- GRM
- 7.7
CMA / ARV
No comps found within radius.
Projected returns pro-forma
4.81% appreciation · 8.0% rent growth · sell at horizon
- IRR
- 16.4%
- Equity multiple
- 2.06×
- Total profit
- $133,559
- Equity at exit
- $249,257
- IRR
- 19.3%
- Equity multiple
- 4.67×
- Total profit
- $460,836
- Equity at exit
- $425,958
Cash invested: $125,720 (down + closing). Projections, not guarantees.
Landlord ↔ Tenant lean methodology
- Overall (CITY)
- 0 Strongly Tenant-Friendly
- State California
- 18 Strongly Tenant-Friendly · D+13
- County
- — inherits STATE
- City San Francisco
- 0 Strongly Tenant-Friendly · D+57
ZIP-level market 94107
- Home prices YoY
- 2.6%
- Rents YoY
- 18.9%
- Active inventory
- 136
- Price-to-rent
- 7.7×
Monthly cashflow live
- Estimated rent
- $4,850 high interval (Pro) →
- Mortgage (P&I)
- −$2,355
- Tax est. 1.5%
- −$561 /mo · $6,735/yr
- Insurance
- −$187
- HOA
- −$589
- Vacancy / Maint / Mgmt
- −$1,018
- Net cashflow
- $139
Break-even live
UW: 25.0% down · 7.5% · 30yr · 1.5% tax · 5.0% vac · 8.0% maint · 8.0% mgmt
Financing live
Cash to close
- Down payment
- $112,250
- Closing costs
- $13,470
- Reserves months
- —
- Total cash needed
- —
Loan-product check · same deal, 3 products live
Conventional
25% down · 7.5% · 30yr
- Down + closing
- —
- Monthly P&I
- —
- Monthly cashflow
- —
- DSCR
- —
- Eligible?
- —
Personal DTI + credit; lowest rate.
DSCR
20% down · 8.5% · 30yr
- Down + closing
- —
- Monthly P&I
- —
- Monthly cashflow
- —
- DSCR
- —
- Eligible?
- —
No personal income docs; deal must DSCR.
Hard money
10% down · 12.0% · 12mo
- Down + closing
- —
- Monthly P&I
- —
- Monthly cashflow
- —
- DSCR
- —
- Eligible?
- —
Short-term bridge; refi at stabilization.
Rent comps 40 comps
| Address | Beds | Baths | Sqft | Rent | $/sqft | DOM | Units | Dist |
|---|---|---|---|---|---|---|---|---|
| 271 Clara St Unit 1A San Francisco, CA | 2.0 | 1.5 | 1000 | $5,499 | $5.50 | 10d | 1 | 0.01mi |
| 272 Clara St #455 San Francisco, CA | 1.0 | 2.0 | 1050 | $5,580 | $5.31 | 20d | 1 | 0.02mi |
| 155 Harriet St #1 San Francisco, CA | 2.0 | 1.5 | 920 | $3,595 | $3.91 | 43d | 1 | 0.07mi |
| 900 Folsom St San Francisco, CA | 2.0 | 1.0–2.0 | 863 | $6,186 | $7.17 | 2d | 24 | 0.14mi |
| 84 Harriet St Unit A San Francisco, CA | 1.0 | 1.0 | 718 | $3,295 | $4.59 | 20d | 1 | 0.14mi |
| 400 Clementina St #1449 San Francisco, CA | 1.0–2.0 | 1.0–2.0 | 775 | $5,210 | $6.72 | 1d | 2 | 0.18mi |
| 23 Boardman Pl Unit LTBP23F San Francisco, CA | 3.0 | 1.0 | 1050 | $4,700 | $4.48 | 43d | 1 | 0.22mi |
| 821 Folsom St #401 San Francisco, CA | 1.0 | 1.0 | 652 | $3,650 | $5.60 | 24d | 1 | 0.27mi |
| 673 Brannan St San Francisco, CA | 1.0–5.0 | 1.0–2.0 | 1302 | $4,659 | $3.58 | 1d | 2 | 0.29mi |
| 434 Minna St San Francisco, CA | 2.0 | 1.0–2.0 | 719 | $6,581 | $9.15 | 1d | 15 | 0.30mi |
| 99 Rausch St San Francisco, CA | 1.0 | 1.0 | 655 | $4,250 | $6.49 | 24d | 1 | 0.30mi |
| 603 Natoma St Apt 406 San Francisco, CA | 1.0 | 1.0 | 556 | $2,950 | $5.31 | 43d | 1 | 0.34mi |
| 60 Rausch St San Francisco, CA | 1.0 | 1.0 | 767 | $4,300 | $5.61 | 5d | 1 | 0.34mi |
| 975 Bryant St San Francisco, CA | 2.0 | 1.0–2.0 | 697 | $6,104 | $8.76 | 1d | 10 | 0.35mi |
| 73 Sumner St San Francisco, CA | 2.0 | 2.0 | 1100 | $4,750 | $4.32 | 43d | 1 | 0.36mi |
| 345 8th St San Francisco, CA | 1.0 | 1.0 | 946 | $4,095 | $4.33 | 43d | 2 | 0.38mi |
| 2 Mint Plz San Francisco, CA | 2.0 | 1.0 | 800 | $4,500 | $5.62 | 43d | 1 | 0.40mi |
| 555 Bryant St San Francisco, CA | 2.0 | 1.0–2.0 | 687 | $6,339 | $9.23 | 1d | 10 | 0.41mi |
| 555 4th St #539 San Francisco, CA | 1.0 | 1.0 | 752 | $4,500 | $5.98 | 43d | 1 | 0.41mi |
| 6 Mint Plz San Francisco, CA | 2.0 | 2.0 | 915 | $7,995 | $8.74 | 5d | 1 | 0.41mi |
| 855 Brannan St San Francisco, CA | 3.0 | 1.0–2.0 | 958 | $6,137 | $6.41 | 1d | 5 | 0.42mi |
| 1222 Harrison St San Francisco, CA | 2.0 | 1.0–2.5 | 853 | $6,299 | $7.38 | 2d | 34 | 0.43mi |
| 601 4th St #1523 San Francisco, CA | 1.0 | 1.0 | 1085 | $6,730 | $6.20 | 2d | 1 | 0.44mi |
| 1247 Harrison St #21 San Francisco, CA | 1.0 | 1.5 | 1089 | $4,950 | $4.55 | 18d | 1 | 0.44mi |
| 1075 Market St San Francisco, CA | 1.0 | 1.0 | 546 | $3,500 | $6.40 | 24d | 2 | 0.46mi |
| 960 Market St San Francisco, CA | 1.0 | 1.0 | 613 | $4,295 | $7.01 | 21d | 1 | 0.46mi |
| 1075 Market St #461 San Francisco, CA | 1.0 | 1.0 | 648 | $3,460 | $5.34 | 20d | 1 | 0.47mi |
| 1028 Market St San Francisco, CA | 2.0 | 1.0 | 526 | $5,121 | $9.73 | 1d | 6 | 0.48mi |
| 1190 Mission St San Francisco, CA | 1.0 | 1.0 | 508 | $3,136 | $6.17 | 1d | 5 | 0.50mi |
| 360 Berry St San Francisco, CA | 1.0–2.0 | 1.0–2.0 | 842 | $6,800 | $8.08 | 1d | 4 | 0.50mi |
| 300 Berry St #907 San Francisco, CA | 1.0 | 1.0 | 732 | $5,000 | $6.83 | 7d | 1 | 0.51mi |
| 50 Jones St San Francisco, CA | 1.0 | 1.0 | 471 | $3,397 | $7.21 | 3d | 9 | 0.51mi |
| 1 St Francis Pl San Francisco, CA | 3.0 | 1.0–2.0 | 923 | $4,365 | $4.73 | 2d | 2 | 0.52mi |
| 355 Berry St San Francisco, CA | 1.0 | 1.0 | 707 | $4,968 | $7.02 | 1d | 4 | 0.53mi |
| 33 8th St San Francisco, CA | 1.0–2.0 | 1.0 | 646 | $6,624 | $10.25 | 2d | 10 | 0.53mi |
| 1288 Howard St #1908 San Francisco, CA | 1.0–2.0 | 1.0–2.0 | 782 | $6,710 | $8.58 | 1d | 2 | 0.53mi |
| 260 King St #717 San Francisco, CA | 1.0 | 1.0 | 759 | $4,850 | $6.39 | 2d | 1 | 0.56mi |
| 1 Henry Adams St San Francisco, CA | 3.0 | 2.0 | 873 | $6,759 | $7.74 | 1d | 3 | 0.58mi |
| 255 King St San Francisco, CA | 3.0 | 1.0–2.5 | 1228 | $6,890 | $5.61 | 2d | 1 | 0.59mi |
| 1 Hawthorne St Unit 8G San Francisco, CA | 1.0 | 1.0 | 846 | $4,200 | $4.96 | 18d | 1 | 0.60mi |
HOA detail condo
- Monthly dues
- $589 · $7,068/yr
- Assessments
- None detected in remarks — confirm with the listing agent.
Listing history 10 events
-
2026-06-18days on market $449,000 Active 13 DOM
-
2026-06-17days on market $449,000 Active 12 DOM
-
2026-06-16days on market $449,000 Active 11 DOM
-
2026-06-15days on market $449,000 Active 10 DOM
-
2026-06-13days on market $449,000 Active 8 DOM
-
2026-06-13days on market $449,000 Active 7 DOM
-
2026-06-09days on market $449,000 Active 4 DOM
-
2026-06-08days on market $449,000 Active 3 DOM
-
2026-06-07remarks 699-char remark
-
2026-06-07$449,000 Active 2 DOM
ⓘ Source: listings_history table (triggers on properties + properties_extension) + one-shot
backfill from property_details.listing_events for pre-trigger history.
Climate risk First Street
- Flood 6/10 Major FEMA zone X (unshaded) · 68% chance over 30 yrs
- Wildfire 1/10 Low
- Heat 3/10 Moderate 8 d/yr ≥79°F today · 17 d/yr by 30 yrs out
- Wind 1/10 Low
- Air quality 8/10 Severe 15 unhealthy d/yr today · 15 by 30 yrs out
Nearby sold comps map
Loading sold comps map…
Walkable amenities ~0.75 mi
Loading nearby amenities…
Taxation est. · year 1
- Rental income
- $58,198
- − Mortgage interest
- −$25,151
- − Property taxes
- −$6,735
- − Insurance
- −$2,245
- − Repairs & maintenance
- −$4,656
- − Management
- −$4,656
- − HOA
- −$7,068
- − Depreciation
- −$13,062
- Taxable loss
- −$5,375
- Est. tax savings @ 24.0%
- +$1,290
- After-tax cash flow
- $2,963/yr
For passive investors: Depreciation is non-cash, so a rental often shows a tax loss while cash-flowing — sheltering income. Rental losses are passive: they offset passive income freely, and up to $25,000/yr can offset ordinary (W-2) income if you actively participate and your MAGI is under $100k (phasing out to $0 by $150k); unused losses carry forward. On sale, claimed depreciation is recaptured at up to 25%, and gains may owe capital-gains tax (a 1031 exchange can defer both). Figures are a year-1 estimate at your 24.0% rate — not tax advice; consult a CPA.
Condition & rehab AI · 9 photos
This modern, move-in-ready condo in San Francisco offers a prime location with excellent condition and minimal maintenance needs. Potential buyers and renters can expect a high return on investment with minor updates.
Value-add opportunities
- Both Painting the exterior and interior walls — Fresh paint can enhance the home's curb appeal and interior aesthetics.
- Both Landscaping improvements — Enhanced landscaping can improve the home's curb appeal and add value.
- Both Adding smart home features — Smart home features can increase both resale and rental value by making the home more modern and convenient.
- Both Upgrading the kitchen appliances — Modern, high-end appliances can significantly boost the home's value and appeal to potential buyers or renters.
Renovation cost estimate screening
Value-add ROI direction
- Both Painting the exterior and interior walls — Fresh paint can enhance the home's curb appeal and interior aesthetics. ↑
- Both Landscaping improvements — Enhanced landscaping can improve the home's curb appeal and add value. ↑
- Both Adding smart home features — Smart home features can increase both resale and rental value by making the home more modern and convenient. ↑
- Both Upgrading the kitchen appliances — Modern, high-end appliances can significantly boost the home's value and appeal to potential buyers or renters. ↑
ⓘ Cost ranges are severity-bucket heuristics (US national rule-of-thumb). Get contractor quotes + a written scope before underwriting a rehab budget.
Schools (NCES district)
- District
- San Francisco Unified
- NCES district ID
- 0634410
- Math proficiency
- 50% ▬ 0.00%
- Reading proficiency
- 56% ▲ 1.00%
- Median HH income
- $81,249
- Composite
- 50.14/100
- National rank
- #4088
- State rank
- #322 of 1400 in CA
Livability — San Francisco
- Score
- 76/100
- State rank
- #90
- US rank
- #3143
Category grades
Schools grade is shown separately in the Schools card above.
Census & demographics
- Census place
- San Francisco, CA
- County
- San Francisco County · 827,552 people
- City population
- 827,552
- Metro
- San Francisco-Oakland-Berkeley, CA
- Population (ZIP)
- 31,823
- Household income
- $182,897
- Rent vs Own
- Severe rent burden
- 1851.0
Population outlook (San Francisco County) Hauer SSP2
- Today (2025)
- 1,030,936 people
- By 2030
- 1,110,409 · +7.7%
- By 2040
- 1,270,010 · +23.2%
- By 2050
- 1,435,001 · +39.2%
- By 2075
- 1,779,074 · +72.6%
- By 2100
- 1,966,767 · +90.8%
Race, ethnicity, and origin ACS 2023
- Neighborhood character
- Diverse neighborhood (Simpson 0.68)
- Race & ethnicity
- White 45% Asian 32% Hispanic / Latino 13% Two or more races 12% Black 3%
- Hispanic origin (detail)
- Mexican 4%
- Common ancestry
- Lithuanian 3% Romanian 2% Italian 2%
- Foreign-born
- 36% · China, Canada, Vietnam
- Languages at home
- 59% English-only · Chinese 12% Spanish 9% Other Indo-European 5%
Political lean MEDSL · San Francisco
- 2024 margin
- Solid D (+64.8) · D 80.3% · R 15.5% · Other 4.1%
- 2008→2024 swing
- -5.7pp toward R · 2008: 70.5pp · 2024: 64.8pp
- All cycles
- 2024: D+64.8 2020: D+72.5 2016: D+76.1 2012: D+70.2 2008: D+70.5
Not yet ingested
- Civics
- —
Market trends
- HPI YoY
- ▲ 4.81%
- Current HPI
- 192.3569
- Rent YoY
- ▲ 18.89%
- Metro
- San Francisco-Oakland-Berkeley, CA
- State GDP YoY
- ▲ 3.21%
- F500 in state
- 116
Industry mix (Fortune 500 HQ in CA)
| Industry | F500 HQs | Revenue |
|---|---|---|
| Technology | 27 | $1,492B |
|
||
| Financial Services | 3 | $174B |
|
||
| Retail | 3 | $44B |
|
||
| Insurance | 3 | $26B |
|
||
| Media / Entertainment | 2 | $115B |
|
||
| Pharmaceuticals / Biotech | 2 | $62B |
|
||
Price history
1 event — show timeline
- 2026-06-05 Listed $449,000 San Francisco MLS
Cash-flow waterfall
monthlySold comps — $/sqft
last 12 mo · ≤1 miLoading sold comps…