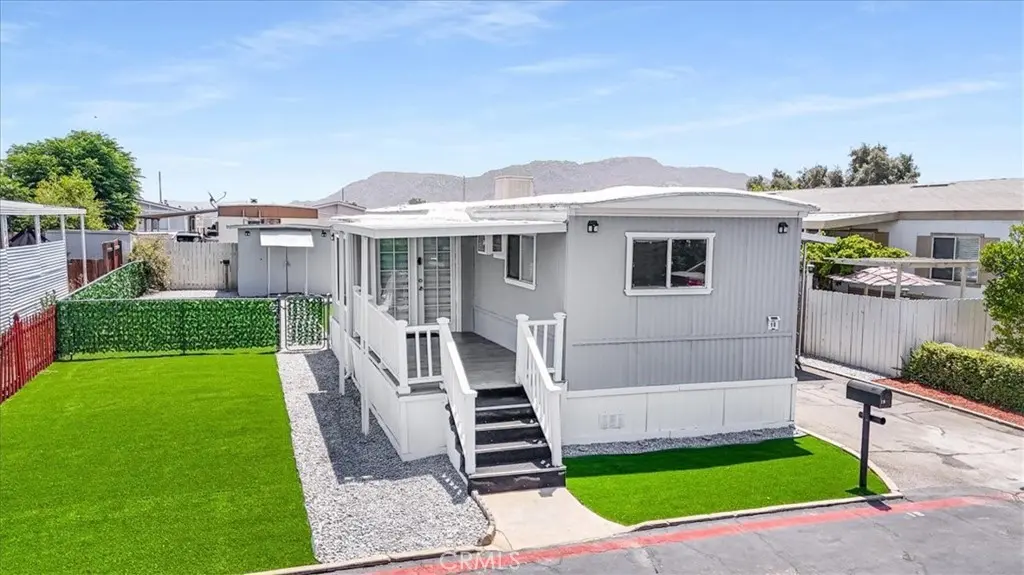
26781 Alessandro #18 · Moreno Valley, CA
Flood risk 1/10 · Minimal
- FEMA flood zone
- X
- Chance of flooding over 30 yrs
- 0.0%
- Est. flood insurance / yr
- $435 – $905
Fire risk 8/10 · Major
- Est. fire insurance / yr
- $659 – $1,223
Heat risk 8/10 · Major
- Hot days now (above threshold)
- 8 days/yr
- Hot days in 30 yrs
- 23 days/yr
Wind risk No data
- Chance of severe wind over 30 yrs
- —
Air-quality risk 9/10 · Severe
- Unhealthy air days now
- 21 days/yr
- Unhealthy air days in 30 yrs
- 25 days/yr
Risk factors via First Street. Map © Google.
Why this score? — see what drove the B grade
The composite is a weighted blend of 9 inputs, each scored 0–100. Each bar is that input's sub-score; the figure is the points it added to the 100-point composite (weight × sub-score).
- Cash flow +30.0/30.0
- 1% rule +10.0/10.0
- DSCR +10.0/10.0
- ARV discount +7.5/15.0
- Condition / age +4.0/5.0
- Rent growth +3.0/5.0
- Schools +2.8/10.0
- Livability +2.8/5.0
- Appreciation +0.0/10.0
$130,000
🖨 Deal sheet 📄 Offer letter ✓ Due diligence
Listing remarks
Beautiful 2 Bed, 2 Bath Single Wide Home Fully Remodeled and Move-In Ready! This charming home has been completely remodeled inside and freshly painted on the outside, offering a modern and welcoming feel throughout. Enjoy the low-maintenance turf yard with separate outdoor spaces perfect for pets, relaxing, or entertaining guests. The open layout, updated finishes, and cozy atmosphere make this home a perfect fit for comfortable living. Don’t miss the opportunity to own this beautifully upgraded home!
Key facts
- Community pool
- Built 1973
- Listed 5 days
Property features AI
Finance
- Other: Manager approval required
- Financial info: Land lease amount approximately $1,150
- HOA & community: Land lease community
Exterior
- Parking: Park name: C (park-managed space)
- Utilities: Public sewer; District/Public water
- Home design: Single-story mobile home; Front entry; Mobile home dimensions approximately 12' x 60'
- Construction: Mobile home remains on site; Year built reported from public records
- Exterior features: Community pool; Park in the community; 0–1 unit per acre lot density
Interior
- Bathrooms: 2 full bathrooms
- Interior features: Front entry
- Laundry & utility: Washer hookup; Gas dryer hookup
Neighborhood map
What this means for you Summary
Snapshot
- This is a 2-bed/2.0-bath manufactured listed at $130k. Condition is rated good.
Deal economics
- At list price, monthly cash flow is $1k ($12k/yr) — positive.
- The deal already cash-flows at list — no discount required.
- Meets the 1% rule at list price ($2k rent vs $130k).
- Cap rate 15.8% vs local median 3.9% in Moreno Valley — top-decile yield for the area; either an underpriced asset or a hidden risk that comps aren't pricing in. Stress-test before assuming the spread holds.
Location & tenants
- Location reads 55/100 on livability (#838 in CA) — a working-class tenant base; expect higher turnover. Strengths: housing A+, employment B; Watch: schools D-, amenities F, commute F.
- Moreno Valley Unified (suburban): math 23% / reading 34% proficiency, ranked #1,050 of 1,400 in CA (top 75%) — low school quality limits family demand, transient renter base, plan for 1-2y turnover; 69% free/reduced lunch — lower-income household profile, screen leases tightly.
- Market conditions: Rents rising (+2.1%/yr); 135 active listings in the ZIP; 2 comparable units currently listed for rent nearby; high-income renter base; 9,195 units permitted in Riverside County in 2024 (1,512 in 5+ unit buildings).
Forward outlook
- Local home prices are declining (-3.0%/yr); year-one equity from $899 of loan paydown is wiped out by about $4k of value loss. Plan a longer hold.
- Riverside County population projected at +22% by 2050 — long-run rental-demand tailwind backs the buy-and-hold thesis.
- At projected returns (-3.0% appreciation + 2.1% rent growth), your $36k cash investment doubles in ~4 years — after that, you're playing with house money.
Negotiation context
- Only 5 days on market — expect competitive offers; lowballing is unlikely to land.
Risks & watch-outs
- Climate carrying-cost: severe wildfire risk; extreme-heat days projected 8→23/yr by 2055 (HVAC capex compounding) — expect insurance premiums to compound above CPI over the hold.
Questions for the listing agent
- Built in 1973 — when were the roof, HVAC, electrical panel, plumbing, and water heater last replaced?
- Is there a deadline driving the sale (1031 exchange, divorce, estate, relocation)? That informs how much negotiation room exists.
- Schools are D-rated, which usually means shorter tenancies and higher turnover. Who's the typical renter profile here, and what's been the actual vacancy rate?
- What's the average days-on-market for RENTAL listings here right now (not sales)? A rising rental-DOM trend means longer vacancies and softer asking-rent achievability than the comps imply.
- What's the recent tenant-quality profile in this submarket — average credit score on applications, eviction rate, late-payment / NSF rate, and stable-employment percentage? A property-management company in the area should have these aggregated.
- How much new for-sale + rental construction is in the pipeline within 1–3 miles? Heavy new supply typically softens prices + rents 12–24 months out; constrained supply supports both.
Investment metrics
- 1% rule
- 1.88% ✓
- Cap rate
- 15.85%
- Cash-on-cash
- 34.12%
- DSCR
- 2.52
- GRM
- 4.4
CMA / ARV
- ARV (on-the-fly)
- $64,800
- Comps found
- 1
Show comp detail 1 sale within ~0.75 mi
| Address | Dist | Beds/Ba | Sqft | Sold | Price | $/sf | Match |
|---|---|---|---|---|---|---|---|
| 26871 Alessandro Blvd #20 | 0.20mi | 2/2.0 | 720 (0%) | 13mo | $65,000 | $90 | 80 |
Match score weights: distance 35% · size 25% · config 20% · recency 20%. Top-matched comps best support the ARV.
Projected returns pro-forma
-3.0% appreciation · 2.11% rent growth · sell at horizon
- IRR
- 28.5%
- Equity multiple
- 2.17×
- Total profit
- $42,719
- Equity at exit
- $19,383
- IRR
- 35.4%
- Equity multiple
- 4.12×
- Total profit
- $113,476
- Equity at exit
- $11,240
Cash invested: $36,400 (down + closing). Projections, not guarantees.
Landlord ↔ Tenant lean methodology
- Overall (STATE)
- 18 Strongly Tenant-Friendly
- State California
- 18 Strongly Tenant-Friendly · D+13
- County
- — inherits STATE
- City
- — inherits STATE
ZIP-level market 92555
- Home prices YoY
- -13.2%
- Rents YoY
- 2.1%
- Active inventory
- 135
- Price-to-rent
- 4.4×
Monthly cashflow live
- Estimated rent
- $2,447 medium interval (Pro) →
- Mortgage (P&I)
- −$682
- Tax est. 1.5%
- −$162 /mo · $1,950/yr
- Insurance
- −$54
- HOA
- −$0
- Vacancy / Maint / Mgmt
- −$514
- Net cashflow
- $1,035
Break-even live
UW: 25.0% down · 7.5% · 30yr · 1.5% tax · 5.0% vac · 8.0% maint · 8.0% mgmt
Financing live
Cash to close
- Down payment
- $32,500
- Closing costs
- $3,900
- Reserves months
- —
- Total cash needed
- —
Loan-product check · same deal, 3 products live
Conventional
25% down · 7.5% · 30yr
- Down + closing
- —
- Monthly P&I
- —
- Monthly cashflow
- —
- DSCR
- —
- Eligible?
- —
Personal DTI + credit; lowest rate.
DSCR
20% down · 8.5% · 30yr
- Down + closing
- —
- Monthly P&I
- —
- Monthly cashflow
- —
- DSCR
- —
- Eligible?
- —
No personal income docs; deal must DSCR.
Hard money
10% down · 12.0% · 12mo
- Down + closing
- —
- Monthly P&I
- —
- Monthly cashflow
- —
- DSCR
- —
- Eligible?
- —
Short-term bridge; refi at stabilization.
Rent comps 2 comps
| Address | Beds | Baths | Sqft | Rent | $/sqft | DOM | Units | Dist |
|---|---|---|---|---|---|---|---|---|
| 14147 Darwin Dr Moreno Valley, CA | 1.0–2.0 | 1.0–2.0 | 914 | $2,826 | $3.09 | 24d | 24 | 0.61mi |
| 26074 Bay Ave Unit 3 Moreno Valley, CA | 2.0 | 1.0 | 650 | $1,895 | $2.92 | 43d | 1 | 0.80mi |
Listing history 5 events
-
2026-06-04days on market $130,000 Active 5 DOM
-
2026-06-03days on market $130,000 Active 4 DOM
-
2026-06-02days on market $130,000 Active 3 DOM
-
2026-06-01days on market $130,000 Active 2 DOM
-
2026-05-25historical $130,000
ⓘ Source: listings_history table (triggers on properties + properties_extension) + one-shot
backfill from property_details.listing_events for pre-trigger history.
Climate risk First Street
- Flood 1/10 Low FEMA zone X · 0% chance over 30 yrs
- Wildfire 8/10 Severe
- Heat 8/10 Severe
- Air quality 9/10 Extreme 21 unhealthy d/yr today · 25 by 30 yrs out
Nearby sold comps map
Loading sold comps map…
Walkable amenities ~0.75 mi
Loading nearby amenities…
Taxation est. · year 1
- Rental income
- $29,368
- − Mortgage interest
- −$7,282
- − Property taxes
- −$1,950
- − Insurance
- −$650
- − Repairs & maintenance
- −$2,349
- − Management
- −$2,349
- − Depreciation
- −$3,782
- Taxable income
- $11,005
- Est. tax owed @ 24.0%
- −$2,641
- After-tax cash flow
- $9,779/yr
For passive investors: Depreciation is non-cash, so a rental often shows a tax loss while cash-flowing — sheltering income. Rental losses are passive: they offset passive income freely, and up to $25,000/yr can offset ordinary (W-2) income if you actively participate and your MAGI is under $100k (phasing out to $0 by $150k); unused losses carry forward. On sale, claimed depreciation is recaptured at up to 25%, and gains may owe capital-gains tax (a 1031 exchange can defer both). Figures are a year-1 estimate at your 24.0% rate — not tax advice; consult a CPA.
Condition & rehab AI · 30 photos
This fully remodeled and move-in ready manufactured home offers a modern and welcoming feel with updated finishes and a low-maintenance turf yard.
Value-add opportunities
- Both landscaping — enhances curb appeal and adds value
- Both exterior paint — fresh paint improves curb appeal and value
- Both landscaping — low-maintenance turf yard adds value and reduces maintenance
Renovation cost estimate screening
Value-add ROI direction
- Both landscaping — enhances curb appeal and adds value ↑
- Both exterior paint — fresh paint improves curb appeal and value ↑
- Both landscaping — low-maintenance turf yard adds value and reduces maintenance ↑
ⓘ Cost ranges are severity-bucket heuristics (US national rule-of-thumb). Get contractor quotes + a written scope before underwriting a rehab budget.
Schools (NCES district)
- District
- Moreno Valley Unified
- NCES district ID
- 0625800
- Math proficiency
- 23% ▲ 1.00%
- Reading proficiency
- 34% ▲ 3.00%
- Median HH income
- $55,495
- Composite
- 28.36/100
- National rank
- #12131
- State rank
- #1050 of 1400 in CA
Livability — Moreno Valley
- Score
- 55/100
- State rank
- #838
- US rank
- #23203
Category grades
Schools grade is shown separately in the Schools card above.
Census & demographics
- Census place
- Moreno Valley, CA
- County
- Riverside County · 2,287,001 people
- City population
- 212,104
- Metro
- Riverside-San Bernardino-Ontario, CA
- Population (ZIP)
- 45,978
- Household income
- $121,425
- Rent vs Own
- Severe rent burden
- 457.0
Population outlook (Riverside County) Hauer SSP2
- Today (2025)
- 2,664,475 people
- By 2030
- 2,802,692 · +5.2%
- By 2040
- 3,050,904 · +14.5%
- By 2050
- 3,256,783 · +22.2%
- By 2075
- 3,655,058 · +37.2%
- By 2100
- 3,766,594 · +41.4%
Race, ethnicity, and origin ACS 2023
- Neighborhood character
- Diverse neighborhood (Simpson 0.68)
- Race & ethnicity
- Hispanic / Latino 49% Black 21% White 20% Two or more races 14% Asian 7% Native American 1%
- Hispanic origin (detail)
- Mexican 43%
- Common ancestry
- Lithuanian 1% Scottish 1% Slovak 1%
- Foreign-born
- 20% · Canada, China, Vietnam
- Languages at home
- 59% English-only · Spanish 32% Tagalog/Filipino 3% Other Indo-European 1%
Political lean MEDSL · Riverside
- 2024 margin
- Toss-up / Even · D 48.0% · R 49.3% · Other 2.6%
- 2008→2024 swing
- -3.6pp toward R · 2008: 2.3pp · 2024: -1.3pp
- All cycles
- 2024: R+1.3 2020: D+8.0 2016: D+4.3 2012: R+0.4 2008: D+2.3
Not yet ingested
- Civics
- —
Market trends
- HPI YoY
- ▼ -55.67%
- Current HPI
- 364.6628
- Rent YoY
- ▲ 2.11%
- Metro
- Riverside-San Bernardino-Ontario, CA
- State GDP YoY
- ▲ 3.21%
- F500 in state
- 116
Industry mix (Fortune 500 HQ in CA)
| Industry | F500 HQs | Revenue |
|---|---|---|
| Technology | 27 | $1,492B |
|
||
| Financial Services | 3 | $174B |
|
||
| Retail | 3 | $44B |
|
||
| Insurance | 3 | $26B |
|
||
| Media / Entertainment | 2 | $115B |
|
||
| Pharmaceuticals / Biotech | 2 | $62B |
|
||
Price history
1 event — show timeline
- 2026-05-25 Coming Soon $130,000 CRMLS
Cash-flow waterfall
monthlySold comps — $/sqft
last 12 mo · ≤1 miLoading sold comps…