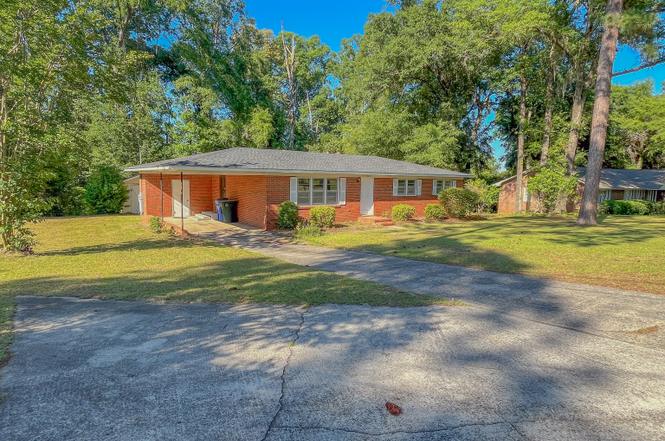
307 Brookdale Dr · Dublin, GA
Flood risk 1/10 · Minimal
- FEMA flood zone
- X (unshaded)
- Chance of flooding over 30 yrs
- 0.0%
- Est. flood insurance / yr
- $507 – $1,088
Fire risk 3/10 · Minor
- Est. fire insurance / yr
- $963 – $1,789
Heat risk 7/10 · Major
- Hot days now (above 109°F)
- 7 days/yr
- Hot days in 30 yrs
- 17 days/yr
Wind risk 6/10 · Moderate
- Chance of severe wind over 30 yrs
- 76.0%
Air-quality risk 1/10 · Minimal
- Unhealthy air days now
- 0 days/yr
- Unhealthy air days in 30 yrs
- 0 days/yr
Risk factors via First Street. Map © Google.
Why this score? — see what drove the D+ grade
The composite is a weighted blend of 9 inputs, each scored 0–100. Each bar is that input's sub-score; the figure is the points it added to the 100-point composite (weight × sub-score).
- Cash flow +16.1/30.0
- ARV discount +15.0/15.0
- DSCR +5.0/10.0
- 1% rule +4.4/10.0
- Livability +3.1/5.0
- Rent growth +2.9/5.0
- Condition / age +2.5/5.0
- Schools +1.0/10.0
- Appreciation +0.0/10.0
$181,900
🖨 Deal sheet (PDF) 📄 Offer letter ✓ Due diligence
Listing remarks MLS
MOTIVATED TO SELL!! Now Priced at $159,000!! Looking for a great family home? Look here!! Brick home in Green Acres neighborhood has 3 BRs/2BAs. A second family room was added plus a laundry room and storage room. This addition gives approximately 1772 sq ft of living space. The main house still has the original pine floors for that charm you are searching for! This one will sell! Call me today! These is a large 14x24 storage building with electricity that stays with property. A great man cave with lots of space! You must see this one!!
Key facts
- Ensuite bath
- Versatile mudroom
- Hardwood floors
Tags
Property features AI
Finance
- HOA & community: No HOA; No community amenities
Exterior
- Parking: Carport; Open parking; Parking pad; Storage; Total parking for 2 vehicles
- Utilities: Public water; Public sewer; Electricity available; Sewer connected; Water available; Cable available; High speed internet
- Home design: Single family residence; House; Resale property; Built in 1965; Located in the Green Acres subdivision
- Construction: Brick exterior; Block foundation; Composition roof; Built in 1965
- Exterior features: Brick construction; Composition roof; Outbuilding on the property
Interior
- Kitchen: Dishwasher; Electric water heater
- Bedrooms: 3 bedrooms on the main level
- Flooring: Hardwood; Laminate
- Bathrooms: 2 full bathrooms on the main level
- Heating & cooling: Heat pump for heating and cooling
- Interior features: One-level home; Den; Dining room and living room combo; Crawl space foundation
- Laundry & utility: Mud room
Neighborhood map
What this means for you Summary
Snapshot
- This is a 3-bed/2.5-bath single-family listed at $182k.
Deal economics
- At list price, monthly cash flow is $94 ($1k/yr) — positive.
- The deal already cash-flows at list — no discount required.
- To meet the 1% rule (rent ≥ 1% of price), the offer needs to be $171k (6.0% below list).
- Recommended offer: $171k (6.0% below list) — sets the bar for 1% rule.
- Cap rate 6.9% vs local median 4.2% in Dublin — top-decile yield for the area; either an underpriced asset or a hidden risk that comps aren't pricing in. Stress-test before assuming the spread holds.
Location & tenants
- Location reads 62/100 on livability (#322 in GA) — a middle-class / working-renter tenant base. Strengths: cost of living A+, housing A; Watch: crime D+, amenities F, commute F.
- Dublin City (town): math 10% / reading 16% proficiency, ranked #165 of 174 in GA (top 95%) — low school quality limits family demand, transient renter base, plan for 1-2y turnover; 78% free/reduced lunch — lower-income household profile, screen leases tightly.
- Zoned schools: Hillcrest Elementary (math 22% / reading 8%, grade F, #988 of 1,228 statewide, top 81%, 533 students, 100% FRL); Dublin Middle School (math 7% / reading 19%, grade F, #408 of 470 statewide, top 87%, 618 students, 100% FRL); Dublin High School (math 2% / reading 10%, grade F, #390 of 424 statewide, top 93%, 544 students, 100% FRL) — zoned schools average 100% FRL vs 78% district-wide (22 pts higher); higher-poverty schools than district average — tighter screening recommended.
- Market conditions: Rents rising (+1.4%/yr); 224 active listings in the ZIP; 2 comparable units currently listed for rent nearby; 55 units permitted in Laurens County in 2024 (24 in 5+ unit buildings).
- This rent runs 37% of the median local income ($56k/yr) — at the standard rent-burdened threshold; future hikes will face affordability resistance.
Forward outlook
- Local home prices are declining (-3.0%/yr); year-one equity from $1k of loan paydown is wiped out by about $5k of value loss. Plan a longer hold.
- Laurens County population projected at -21% by 2050 — secular population decline; favor cash flow + early exit over multi-decade hold.
Negotiation context
- It's been on market 17 days — a 2% lower offer ($179k) is reasonable based on typical stale-listing flexibility.
- 2 sale attempts since 3y ago with the ask held roughly flat each time — persistent listings suggest the price (not the market) is what's stuck; bring a comps-based counter.
- Current owner paid $142k; 28% above their basis — modest negotiation headroom, anchor on the comps not their cost.
Risks & watch-outs
- Climate carrying-cost: major wind risk, 76% chance of damaging wind over 30y; extreme-heat days projected 7→17/yr by 2055 (HVAC capex compounding) — expect insurance premiums to compound above CPI over the hold.
Questions for the listing agent
- Built in 1965 — when were the roof, HVAC, electrical panel, plumbing, and water heater last replaced?
- Is there a deadline driving the sale (1031 exchange, divorce, estate, relocation)? That informs how much negotiation room exists.
- Schools are F-rated, which usually means shorter tenancies and higher turnover. Who's the typical renter profile here, and what's been the actual vacancy rate?
- Crime grade is D in this area — have there been break-ins, vandalism, or insurance claims at this property in the last 3 years? What carrier currently insures it and at what premium?
- The area grade is low — what's the realistic commute time and amenity access for the typical tenant pool here? Any planned neighborhood developments (good or bad) we should know about?
- What's the average days-on-market for RENTAL listings here right now (not sales)? A rising rental-DOM trend means longer vacancies and softer asking-rent achievability than the comps imply.
- What's the recent tenant-quality profile in this submarket — average credit score on applications, eviction rate, late-payment / NSF rate, and stable-employment percentage? A property-management company in the area should have these aggregated.
- How much new for-sale + rental construction is in the pipeline within 1–3 miles? Heavy new supply typically softens prices + rents 12–24 months out; constrained supply supports both.
Investment metrics
- 1% rule
- 0.94% ✗
- Cap rate
- 6.91%
- Cash-on-cash
- 2.20%
- DSCR
- 1.10
- GRM
- 8.9
CMA / ARV
- ARV (on-the-fly)
- $221,500
- Comps found
- 12
Show comp detail 12 sales within ~0.75 mi
| Address | Dist | Beds/Ba | Sqft | Sold | Price | $/sf | Match |
|---|---|---|---|---|---|---|---|
| 504 Briarcliff Rd | 0.23mi | 3/2.0 | 1,905 (+8%) | 3mo | $106,000 | $56 | 72 |
| 501 Brookdale Dr | 0.15mi | 4/2.0 (+1) | 1,646 (-7%) | 10mo | $185,000 | $112 | 66 |
| 305 Lassiter Dr | 0.58mi | 4/2.0 (+1) | 1,800 (+2%) | 7mo | $225,000 | $125 | 58 |
| 113 Camelot Dr | 0.60mi | 3/2.0 | 1,644 (-7%) | 2mo | $229,000 | $139 | 57 |
| 142 Pinehurst Ct | 0.71mi | 4/3.0 (+1) | 1,774 (+0%) | 4mo | $204,888 | $115 | 56 |
| 148 Pinehurst Ct | 0.68mi | 4/3.0 (+1) | 1,774 (+0%) | 7mo | $225,990 | $127 | 55 |
| 144 Pinehurst Ct | 0.70mi | 4/3.0 (+1) | 1,774 (+0%) | 7mo | $239,990 | $135 | 54 |
| 307 Lancelot Ln | 0.44mi | 3/2.0 | 2,004 (+13%) | 6mo | $235,000 | $117 | 50 |
| 158 Pinehurst Ct | 0.67mi | 3/2.0 | 1,684 (-5%) | 10mo | $231,990 | $138 | 50 |
| 150 Pinehurst Ct | 0.67mi | 3/2.5 | 1,566 (-12%) | 6mo | $192,000 | $123 | 45 |
| 140 Pinehurst Ct | 0.72mi | 3/2.5 | 1,566 (-12%) | 4mo | $189,888 | $121 | 44 |
| 131 Pinehurst Ct | 0.71mi | 4/2.0 (+1) | 1,684 (-5%) | 10mo | $225,990 | $134 | 44 |
Match score weights: distance 35% · size 25% · config 20% · recency 20%. Top-matched comps best support the ARV.
Projected returns pro-forma
-3.0% appreciation · 1.45% rent growth · sell at horizon
- IRR
- -14.5%
- Equity multiple
- 0.49×
- Total profit
- $-26,118
- Equity at exit
- $27,122
- IRR
- -8.6%
- Equity multiple
- 0.50×
- Total profit
- $-25,411
- Equity at exit
- $15,727
Cash invested: $50,932 (down + closing). Projections, not guarantees.
Landlord ↔ Tenant lean methodology
- Overall (STATE)
- 90 Strongly Landlord-Friendly
- State Georgia
- 90 Strongly Landlord-Friendly · R+3
- County
- — inherits STATE
- City
- — inherits STATE
ZIP-level market 31021
- Home prices YoY
- -18.7%
- Rents YoY
- 1.4%
- Active inventory
- 224
- Price-to-rent
- 8.9×
Monthly cashflow live
- Estimated rent
- $1,710 medium interval (Pro) →
- Mortgage (P&I)
- −$954
- Tax est. 1.5%
- −$227 /mo · $2,728/yr
- Insurance
- −$76
- HOA
- −$0
- Vacancy / Maint / Mgmt
- −$359
- Net cashflow
- $94
Break-even live
Sensitivity live
| Price | -10% $219 | -5% $156 | +0% $94 | +5% $31 | +10% $-32 |
|---|---|---|---|---|---|
| Rent | -10% $-42 | -5% $26 | +0% $94 | +5% $161 | +10% $229 |
| Rate | -1.0pp $185 | -0.5pp $140 | base $94 | +0.5pp $46 | +1.0pp $-2 |
UW: 25.0% down · 7.5% · 30yr · 1.5% tax · 5.0% vac · 8.0% maint · 8.0% mgmt
Financing live
Cash to close
- Down payment
- $45,475
- Closing costs
- $5,457
- Reserves months
- —
- Total cash needed
- —
Loan-product check · same deal, 3 products live
Conventional
25% down · 7.5% · 30yr
- Down + closing
- —
- Monthly P&I
- —
- Monthly cashflow
- —
- DSCR
- —
- Eligible?
- —
Personal DTI + credit; lowest rate.
DSCR
20% down · 8.5% · 30yr
- Down + closing
- —
- Monthly P&I
- —
- Monthly cashflow
- —
- DSCR
- —
- Eligible?
- —
No personal income docs; deal must DSCR.
Hard money
10% down · 12.0% · 12mo
- Down + closing
- —
- Monthly P&I
- —
- Monthly cashflow
- —
- DSCR
- —
- Eligible?
- —
Short-term bridge; refi at stabilization.
Rent comps 2 comps
| Address | Beds | Baths | Sqft | Rent | $/sqft | DOM | Units | Dist |
|---|---|---|---|---|---|---|---|---|
| 113 Ramsey St Dublin, GA | 3.0 | 2.0 | 1500 | $1,500 | $1.00 | 45d | 1 | 1.36mi |
| 412 Roberson St Dublin, GA | 4.0 | 3.0 | 2152 | $2,500 | $1.16 | 45d | 1 | 1.41mi |
Listing history 13 events
-
2026-06-22days on market $181,900 Active 17 DOM
-
2026-06-19statusdays on market $181,900 Active 14 DOM
-
2026-06-18days on market $181,900 New 13 DOM
-
2026-06-17days on market $181,900 New 12 DOM
-
2026-06-16days on market $181,900 New 11 DOM
-
2026-06-15days on market $181,900 New 10 DOM
-
2026-06-14days on market $181,900 New 8 DOM
-
2026-06-12days on market $181,900 New 7 DOM
-
2026-06-09days on market $181,900 New 4 DOM
-
2026-06-08days on market $181,900 New 3 DOM
-
2026-06-07days on market $181,900 New 2 DOM
-
2026-06-07remarks 699-char remark
-
2026-06-07$181,900 New 1 DOM
ⓘ Source: listings_history table (triggers on properties + properties_extension) + one-shot
backfill from property_details.listing_events for pre-trigger history.
Climate risk First Street
- Flood 1/10 Low FEMA zone X (unshaded) · 0% chance over 30 yrs
- Wildfire 3/10 Moderate
- Heat 7/10 Severe 7 d/yr ≥109°F today · 17 d/yr by 30 yrs out
- Wind 6/10 Major 76% chance of damaging wind over 30 yrs
- Air quality 1/10 Low 0 unhealthy d/yr today · 0 by 30 yrs out
Nearby sold comps map
Loading sold comps map…
Walkable amenities ~0.75 mi
Loading nearby amenities…
Taxation est. · year 1
- Rental income
- $20,516
- − Mortgage interest
- −$10,189
- − Property taxes
- −$2,728
- − Insurance
- −$910
- − Repairs & maintenance
- −$1,641
- − Management
- −$1,641
- − Depreciation
- −$5,292
- Taxable loss
- −$1,886
- Est. tax savings @ 24.0%
- +$453
- After-tax cash flow
- $1,575/yr
For passive investors: Depreciation is non-cash, so a rental often shows a tax loss while cash-flowing — sheltering income. Rental losses are passive: they offset passive income freely, and up to $25,000/yr can offset ordinary (W-2) income if you actively participate and your MAGI is under $100k (phasing out to $0 by $150k); unused losses carry forward. On sale, claimed depreciation is recaptured at up to 25%, and gains may owe capital-gains tax (a 1031 exchange can defer both). Figures are a year-1 estimate at your 24.0% rate — not tax advice; consult a CPA.
Schools (NCES district)
- District
- Dublin City
- NCES district ID
- 1301870
- Math proficiency
- 10% ▼ -15.00%
- Reading proficiency
- 16% ▼ -6.00%
- Median HH income
- $29,841
- Composite
- 10.16/100
- National rank
- #9796
- State rank
- #165 of 174 in GA
Livability — Dublin
- Score
- 62/100
- State rank
- #322
- US rank
- #17202
Category grades
Schools grade is shown separately in the Schools card above.
Census & demographics
- Census place
- Dublin, GA
- County
- Laurens County · 28,190 people
- City population
- 28,190
- Metro
- Dublin, GA
- Population (ZIP)
- 28,190
- Household income
- $55,697
- Rent vs Own
- Severe rent burden
- 1279.0
Population outlook (Laurens County) Hauer SSP2
- Today (2025)
- 45,685 people
- By 2030
- 44,056 · -3.6%
- By 2040
- 40,270 · -11.9%
- By 2050
- 36,094 · -21.0%
- By 2075
- 26,275 · -42.5%
- By 2100
- 17,160 · -62.4%
Race, ethnicity, and origin ACS 2023
- Neighborhood character
- Majority White (51%)
- Race & ethnicity
- White 51% Black 45% Asian 1%
- Common ancestry
- Italian 1% Serbian 1%
- Foreign-born
- 2% · Canada
- Languages at home
- 98% English-only · Other Indo-European 1% Spanish 1%
Political lean MEDSL · Laurens
- 2024 margin
- Solid R (+32.7) · D 33.5% · R 66.2%
- 2008→2024 swing
- -11.2pp toward R · 2008: -21.5pp · 2024: -32.7pp
- All cycles
- 2024: R+32.7 2020: R+28.2 2016: R+29.1 2012: R+22.7 2008: R+21.5
Not yet ingested
- Civics
- —
Market trends
- HPI YoY
- ▼ -42.86%
- Current HPI
- 186.3422
- Rent YoY
- ▲ 1.45%
- Metro
- Dublin, GA
- State GDP YoY
- ▲ 2.66%
- F500 in state
- 28
Industry mix (Fortune 500 HQ in GA)
| Industry | F500 HQs | Revenue |
|---|---|---|
| Paper / Packaging | 2 | $29B |
|
||
| Retail | 1 | $160B |
|
||
| Transportation / Logistics | 1 | $91B |
|
||
| Airlines | 1 | $62B |
|
||
| Consumer Goods | 1 | $47B |
|
||
| Utilities | 1 | $25B |
|
||
Price history
-8.6% since first listed10 events — show timeline
- 2026-06-05 Listed $181,900 GAMLS
- 2024-05-24 Sold (Public Records) $142,000 Public Records
- 2024-05-23 Sold (MLS) $142,000 GAMLS
- 2024-04-25 Pending — GAMLS
- 2024-04-08 Price Changed $149,000 GAMLS
- 2024-03-12 Price Changed $159,000 GAMLS
- 2024-02-12 Price Changed $169,000 GAMLS
- 2024-01-29 Price Changed $175,000 GAMLS
- 2024-01-05 Price Changed $189,000 GAMLS
- 2023-10-31 Listed $199,000 GAMLS
Property tax history
+5.8%/yrLatest (2025): $311 · +0.3% YoY. Source: county tax records.
Cash-flow waterfall
monthlySold comps — $/sqft
last 12 mo · ≤1 miLoading sold comps…