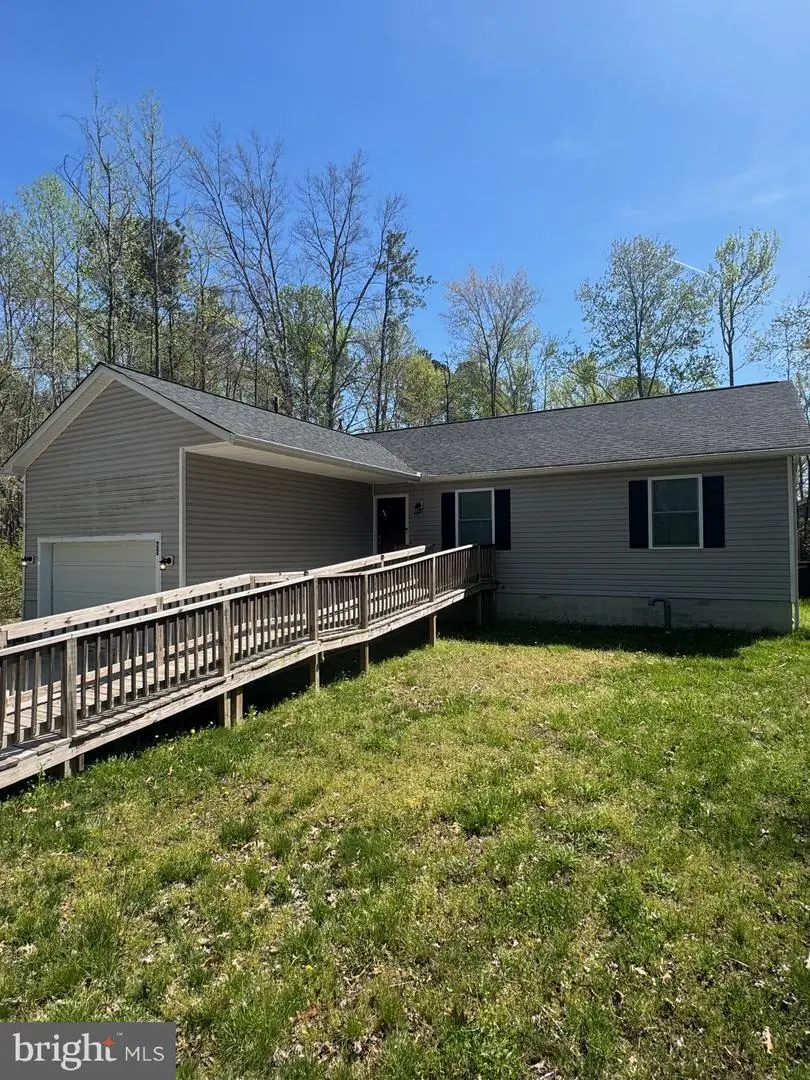
22 Pinewood Ln · Colonial Beach, VA
Flood risk 1/10 · Minimal
- FEMA flood zone
- X (unshaded)
- Chance of flooding over 30 yrs
- 0.0%
- Est. flood insurance / yr
- $507 – $1,088
Fire risk 4/10 · Minor
- Est. fire insurance / yr
- $666 – $1,236
Heat risk 8/10 · Major
- Hot days now (above 108°F)
- 7 days/yr
- Hot days in 30 yrs
- 16 days/yr
Wind risk 6/10 · Moderate
- Chance of severe wind over 30 yrs
- 27.0%
Air-quality risk 2/10 · Minimal
- Unhealthy air days now
- 2 days/yr
- Unhealthy air days in 30 yrs
- 2 days/yr
Risk factors via First Street. Map © Google.
Why this score? — see what drove the D grade
The composite is a weighted blend of 9 inputs, each scored 0–100. Each bar is that input's sub-score; the figure is the points it added to the 100-point composite (weight × sub-score).
- Cash flow +12.8/30.0
- ARV discount +9.5/15.0
- Schools +4.0/10.0
- DSCR +3.8/10.0
- Livability +3.0/5.0
- 1% rule +2.7/10.0
- Rent growth +2.5/5.0
- Condition / age +2.5/5.0
- Appreciation +0.0/10.0
$309,000
🖨 Deal sheet (PDF) 📄 Offer letter ✓ Due diligence
Listing remarks MLS
Beautifully maintained 3-bedroom, 2 full bathroom single-family home built in 2021, offering modern finishes, an ideal location, and low-maintenance living just minutes from North Beach and the Colonial Beach Boardwalk, restaurants, shops, and waterfront attractions. This move-in ready home features an oversized 1.5-car garage, concrete driveway, and inviting covered front porch, perfect for relaxing outdoors. Inside, you’ll find an open and stylish kitchen with white shaker cabinetry, modern countertops, and stainless steel appliances. The spacious primary suite includes a private attached bath, while both full bathrooms showcase beautiful tile finishes. Built in 2021, this home offers the peace of mind of newer construction with updated systems, efficient living, and great curb appeal. Enjoy the charm of a beach-town lifestyle with convenient access to the water, downtown amenities, marinas, and local entertainment.
Key facts
- 8,712 sq ft lot
- Garage
- Built 2021
Neighborhood map
What this means for you Summary
Snapshot
- This is a 3-bed/2.0-bath single-family listed at $309k.
Deal economics
- At list price, monthly cash flow is $-27 ($-318/yr) — negative.
- To cash-flow at today's rent, offer at most $304k (1.5% below list).
- To meet the 1% rule (rent ≥ 1% of price), the offer needs to be $239k (22.7% below list).
- Recommended offer: $239k (22.7% below list) — sets the bar for 1% rule.
- Cap rate 6.2% vs local median 4.5% in Colonial Beach — top-decile yield for the area; either an underpriced asset or a hidden risk that comps aren't pricing in. Stress-test before assuming the spread holds.
Location & tenants
- Location reads 59/100 on livability (#460 in VA) — a working-class tenant base; expect higher turnover. Strengths: crime B, cost of living B; Watch: amenities F, commute F, health & safety F.
- Westmoreland County Public School District (rural): math 34% / reading 59% proficiency, ranked #105 of 131 in VA (top 80%) — families likely to look elsewhere, expect single-tenant / working-renter base with shorter leases; 64% free/reduced lunch — lower-income household profile, screen leases tightly.
- Zoned schools: Washington District Elementary (math 32% / reading 52%, grade F, #866 of 1,108 statewide, top 80%, 385 students, 100% FRL); Montross Middle (math 38% / reading 58%, grade C-, #247 of 342 statewide, top 74%, 309 students, 101% FRL); Westmoreland High (math 32% / reading 82%, grade C, #263 of 319 statewide, top 84%, 486 students, 100% FRL) — zoned schools average 100% FRL vs 64% district-wide (36 pts higher); higher-poverty schools than district average — tighter screening recommended.
- Market conditions: 195 active listings in the ZIP; 5 comparable units currently listed for rent nearby; rentals at typical pace (median 16d on market — plan ~3-4 weeks tenant-placement turnaround); 40% of comp listings sitting > 30 days — soft ceiling on asking rent; 220 units permitted in Westmoreland County in 2024 (0 in 5+ unit buildings).
- This rent runs 44% of the median local income ($65k/yr) — at the standard rent-burdened threshold; future hikes will face affordability resistance.
Forward outlook
- Local home prices are declining (-3.0%/yr); year-one equity from $2k of loan paydown is wiped out by about $9k of value loss. Plan a longer hold.
- Westmoreland County population projected to shrink 7% by 2050 — rents likely to lag national; underwrite the cash flow, not the appreciation.
Negotiation context
- It's been on market 32 days — a 3% lower offer ($300k) is reasonable based on typical stale-listing flexibility.
Risks & watch-outs
- Climate carrying-cost: major wind risk, 27% chance of damaging wind over 30y; extreme-heat days projected 7→16/yr by 2055 (HVAC capex compounding) — expect insurance premiums to compound above CPI over the hold.
Questions for the listing agent
- What do current leases actually rent for vs. the listed asking? Can we see a recent rent roll and the last 12 months of T-12 income?
- It's been on market 32 days. Have you received any prior offers? Is the seller open to a 23% concession, seller financing, or rate buy-down credit?
- What does the HOA fee cover, when was the last increase, and are there any pending special assessments or reserve-fund shortfalls?
- Is there a deadline driving the sale (1031 exchange, divorce, estate, relocation)? That informs how much negotiation room exists.
- Schools are B-rated — typically a magnet for longer-tenancy family renters. What's the average tenant stay here, and is there a school-zone premium baked into asking?
- The area grade is low — what's the realistic commute time and amenity access for the typical tenant pool here? Any planned neighborhood developments (good or bad) we should know about?
- What's the average days-on-market for RENTAL listings here right now (not sales)? A rising rental-DOM trend means longer vacancies and softer asking-rent achievability than the comps imply.
- What's the recent tenant-quality profile in this submarket — average credit score on applications, eviction rate, late-payment / NSF rate, and stable-employment percentage? A property-management company in the area should have these aggregated.
- How much new for-sale + rental construction is in the pipeline within 1–3 miles? Heavy new supply typically softens prices + rents 12–24 months out; constrained supply supports both.
Investment metrics
- 1% rule
- 0.77% ✗
- Cap rate
- 6.19%
- Cash-on-cash
- -0.37%
- DSCR
- 0.98
- GRM
- 10.8
CMA / ARV
- ARV (median comp)
- $323,633
- List price
- $309,000
- Delta
- -4.52%
- Verdict
- FAIR
- Comps
- 20 within 1.0 mi
Show comp detail 12 sales within ~0.75 mi
| Address | Dist | Beds/Ba | Sqft | Sold | Price | $/sf | Match |
|---|---|---|---|---|---|---|---|
| 84 Pinewood Ln | 0.05mi | 3/2.0 | 1,300 (+1%) | 1mo | $324,900 | $250 | 95 |
| 261 Azure Dr | 0.15mi | 3/2.0 | 1,288 (0%) | 2mo | $311,000 | $241 | 92 |
| 339 Azure Dr | 0.14mi | 3/2.0 | 1,288 (0%) | 3mo | $310,000 | $241 | 91 |
| 228 Dale Dr | 0.14mi | 3/2.0 | 1,334 (+4%) | 1mo | $335,000 | $251 | 87 |
| 236 Forest Grove Rd | 0.09mi | 3/2.0 | 1,224 (-5%) | 3mo | $314,900 | $257 | 85 |
| 784 Lakeview Dr | 0.25mi | 3/2.0 | 1,334 (+4%) | 4mo | $330,000 | $247 | 79 |
| 249 Wildwood Rd | 0.44mi | 3/2.0 | 1,296 (+1%) | 1mo | $359,000 | $277 | 78 |
| 85 Wildwood Rd | 0.27mi | 3/2.0 | 1,224 (-5%) | 2mo | $309,900 | $253 | 78 |
| 218 Shorewood Dr | 0.32mi | 3/2.0 | 1,224 (-5%) | 2mo | $290,000 | $237 | 75 |
| 204 Woodmount Dr | 0.14mi | 3/2.5 | 1,416 (+10%) | 3mo | $365,900 | $258 | 73 |
| 633 Shorewood Dr | 0.59mi | 3/2.0 | 1,420 (+10%) | 2mo | $367,000 | $258 | 54 |
| 184 Poplar Ln | 0.68mi | 3/2.0 | 1,408 (+9%) | 3mo | $314,000 | $223 | 50 |
Match score weights: distance 35% · size 25% · config 20% · recency 20%. Top-matched comps best support the ARV.
Projected returns pro-forma
-3.0% appreciation · 3.0% rent growth · sell at horizon
- IRR
- -17.0%
- Equity multiple
- 0.40×
- Total profit
- $-51,861
- Equity at exit
- $46,073
- IRR
- -8.9%
- Equity multiple
- 0.45×
- Total profit
- $-47,740
- Equity at exit
- $26,717
Cash invested: $86,520 (down + closing). Projections, not guarantees.
Landlord ↔ Tenant lean methodology
- Overall (STATE)
- 55 Moderately Landlord-Leaning
- State Virginia
- 55 Moderately Landlord-Leaning · D+2
- County
- — inherits STATE
- City
- — inherits STATE
ZIP-level market 22443
- Active inventory
- 195
- Price-to-rent
- 10.8×
Monthly cashflow live
- Estimated rent
- $2,390 high interval (Pro) →
- Mortgage (P&I)
- −$1,620
- Tax from tax record
- −$148 /mo · $1,781/yr
- Insurance
- −$129
- HOA
- −$17
- Vacancy / Maint / Mgmt
- −$502
- Net cashflow
- $-27
Break-even live
Sensitivity live
| Price | -10% $148 | -5% $61 | +0% $-27 | +5% $-114 | +10% $-201 |
|---|---|---|---|---|---|
| Rent | -10% $-215 | -5% $-121 | +0% $-27 | +5% $68 | +10% $162 |
| Rate | -1.0pp $129 | -0.5pp $52 | base $-27 | +0.5pp $-107 | +1.0pp $-188 |
UW: 25.0% down · 7.5% · 30yr · 1.5% tax · 5.0% vac · 8.0% maint · 8.0% mgmt
Financing live
Cash to close
- Down payment
- $77,250
- Closing costs
- $9,270
- Reserves months
- —
- Total cash needed
- —
Loan-product check · same deal, 3 products live
Conventional
25% down · 7.5% · 30yr
- Down + closing
- —
- Monthly P&I
- —
- Monthly cashflow
- —
- DSCR
- —
- Eligible?
- —
Personal DTI + credit; lowest rate.
DSCR
20% down · 8.5% · 30yr
- Down + closing
- —
- Monthly P&I
- —
- Monthly cashflow
- —
- DSCR
- —
- Eligible?
- —
No personal income docs; deal must DSCR.
Hard money
10% down · 12.0% · 12mo
- Down + closing
- —
- Monthly P&I
- —
- Monthly cashflow
- —
- DSCR
- —
- Eligible?
- —
Short-term bridge; refi at stabilization.
Rent comps 5 comps
| Address | Beds | Baths | Sqft | Rent | $/sqft | DOM | Units | Dist |
|---|---|---|---|---|---|---|---|---|
| 47 Birch Ln Colonial Beach, VA | 3.0 | 2.0 | 1300 | $2,545 | $1.96 | 16d | 1 | 0.04mi |
| 236 Meadow View Ln Colonial Beach, VA | 3.0 | 2.5 | 1600 | $2,100 | $1.31 | 16d | 1 | 0.08mi |
| 314 Lake Dr Colonial Beach, VA | 4.0 | 2.0 | 1850 | $2,350 | $1.27 | 16d | 1 | 0.47mi |
| 14 Azalea Way Colonial Beach, VA | 3.0 | 2.0 | 1311 | $2,250 | $1.72 | 45d | 1 | 0.51mi |
| 990 Ebb Tide Dr Colonial Beach, VA | 3.0 | 2.5 | 1632 | $2,445 | $1.50 | 45d | 1 | 1.42mi |
HOA detail
- Monthly dues
- $17 · $204/yr
- Likely covers
- water
Listing history 18 events
-
2026-06-21days on market $309,000 Active 32 DOM
-
2026-06-18days on market $309,000 Active 29 DOM
-
2026-06-17days on market $309,000 Active 28 DOM
-
2026-06-16days on market $309,000 Active 27 DOM
-
2026-06-15days on market $309,000 Active 26 DOM
-
2026-06-14days on market $309,000 Active 24 DOM
-
2026-06-13days on market $309,000 Active 23 DOM
-
2026-06-10days on market $309,000 Active 21 DOM
-
2026-06-09days on market $309,000 Active 20 DOM
-
2026-06-08days on market $309,000 Active 19 DOM
-
2026-06-07days on market $309,000 Active 18 DOM
-
2026-06-03days on market $309,000 Active 14 DOM
-
2026-06-02days on market $309,000 Active 13 DOM
-
2026-06-01days on market $309,000 Active 12 DOM
-
2026-05-31days on market $309,000 Active 11 DOM
-
2026-05-31days on market $309,000 Active 10 DOM
-
2026-04-14historical $309,000 937-char remark
Show marketing remark (937 chars)
Beautifully maintained 3-bedroom, 2 full bathroom single-family home built in 2021, offering modern finishes, an ideal location, and low-maintenance living just minutes from North Beach and the Colonial Beach Boardwalk, restaurants, shops, and waterfront attractions. This move-in ready home features an oversized 1.5-car garage, concrete driveway, and inviting covered front porch, perfect for relaxing outdoors. Inside, you’ll find an open and stylish kitchen with white shaker cabinetry, modern countertops, and stainless steel appliances. The spacious primary suite includes a private attached bath, while both full bathrooms showcase beautiful tile finishes. Built in 2021, this home offers the peace of mind of newer construction with updated systems, efficient living, and great curb appeal. Enjoy the charm of a beach-town lifestyle with convenient access to the water, downtown amenities, marinas, and local entertainment.
-
2022-01-11soldstatus $280,000
ⓘ Source: listings_history table (triggers on properties + properties_extension) + one-shot
backfill from property_details.listing_events for pre-trigger history.
Tax reassessment forecast VA · Resets to sale price
- Current annual tax
- $1,781 · $148/mo
- Projected year-2 tax
- $2,534 · $211/mo
- Expected delta
- +$753/yr (+$63/mo · 42.3%)
ⓘ Screening estimate from a state-policy table — verify with the county assessor before closing.
Climate risk First Street
- Flood 1/10 Low FEMA zone X (unshaded) · 0% chance over 30 yrs
- Wildfire 4/10 Moderate
- Heat 8/10 Severe 7 d/yr ≥108°F today · 16 d/yr by 30 yrs out
- Wind 6/10 Major 27% chance of damaging wind over 30 yrs
- Air quality 2/10 Low 2 unhealthy d/yr today · 2 by 30 yrs out
Nearby sold comps map
Loading sold comps map…
Walkable amenities ~0.75 mi
Loading nearby amenities…
Taxation est. · year 1
- Rental income
- $28,679
- − Mortgage interest
- −$17,309
- − Property taxes
- −$1,781
- − Insurance
- −$1,545
- − Repairs & maintenance
- −$2,294
- − Management
- −$2,294
- − HOA
- −$204
- − Depreciation
- −$8,989
- Taxable loss
- −$5,737
- Est. tax savings @ 24.0%
- +$1,377
- After-tax cash flow
- $1,059/yr
For passive investors: Depreciation is non-cash, so a rental often shows a tax loss while cash-flowing — sheltering income. Rental losses are passive: they offset passive income freely, and up to $25,000/yr can offset ordinary (W-2) income if you actively participate and your MAGI is under $100k (phasing out to $0 by $150k); unused losses carry forward. On sale, claimed depreciation is recaptured at up to 25%, and gains may owe capital-gains tax (a 1031 exchange can defer both). Figures are a year-1 estimate at your 24.0% rate — not tax advice; consult a CPA.
Schools (NCES district)
- District
- Westmoreland County Public School District
- NCES district ID
- 5103980
- Math proficiency
- 34% ▼ -47.00%
- Reading proficiency
- 59% ▼ -11.00%
- Median HH income
- $51,665
- Composite
- 39.94/100
- National rank
- #3845
- State rank
- #105 of 131 in VA
Livability — Colonial Beach
- Score
- 59/100
- State rank
- #460
- US rank
- #19615
Category grades
Schools grade is shown separately in the Schools card above.
Census & demographics
- County
- Westmoreland County · 10,011 people
- City population
- 10,011
- Metro
- nan
- Population (ZIP)
- 10,011
- Household income
- $64,810
- Rent vs Own
- Severe rent burden
- 126.0
Population outlook (Westmoreland County) Hauer SSP2
- Today (2025)
- 17,643 people
- By 2030
- 17,520 · -0.7%
- By 2040
- 17,041 · -3.4%
- By 2050
- 16,397 · -7.1%
- By 2075
- 15,012 · -14.9%
- By 2100
- 12,917 · -26.8%
Race, ethnicity, and origin ACS 2023
- Neighborhood character
- Predominantly White (71%)
- Race & ethnicity
- White 71% Black 15% Two or more races 7% Hispanic / Latino 6% Asian 2%
- Hispanic origin (detail)
- Mexican 5%
- Common ancestry
- Slovak 2% Italian 2% Scotch-Irish 1%
- Foreign-born
- 3% · Canada
- Languages at home
- 96% English-only · Spanish 3%
Political lean MEDSL · Westmoreland
- 2024 margin
- R (+14.3) · D 42.4% · R 56.7%
- 2008→2024 swing
- -24.5pp toward R · 2008: 10.2pp · 2024: -14.3pp
- All cycles
- 2024: R+14.3 2020: R+8.2 2016: R+7.3 2012: D+0.5 2008: D+10.2
Not yet ingested
- Civics
- —
Market trends
- HPI YoY
- ▼ -127.23%
- Current HPI
- 152.1518
- Rent YoY
- —
- Metro
- nan
- State GDP YoY
- ▲ 2.40%
- F500 in state
- 50
Industry mix (Fortune 500 HQ in VA)
| Industry | F500 HQs | Revenue |
|---|---|---|
| Aerospace / Defense | 4 | $236B |
|
||
| Technology / Defense | 3 | $32B |
|
||
| Financial Services | 2 | $176B |
|
||
| Utilities | 2 | $27B |
|
||
| Insurance | 2 | $25B |
|
||
| Technology | 2 | $15B |
|
||
Price history
+10.4% since first listed2 events — show timeline
- 2026-04-14 Coming Soon $309,000 BRIGHT MLS
- 2022-01-11 Sold (Public Records) $280,000 Public Records
Property tax history
+37.9%/yrLatest (2025): $1,781 · +0.0% YoY. Source: county tax records.
Cash-flow waterfall
monthlySold comps — $/sqft
last 12 mo · ≤1 miLoading sold comps…