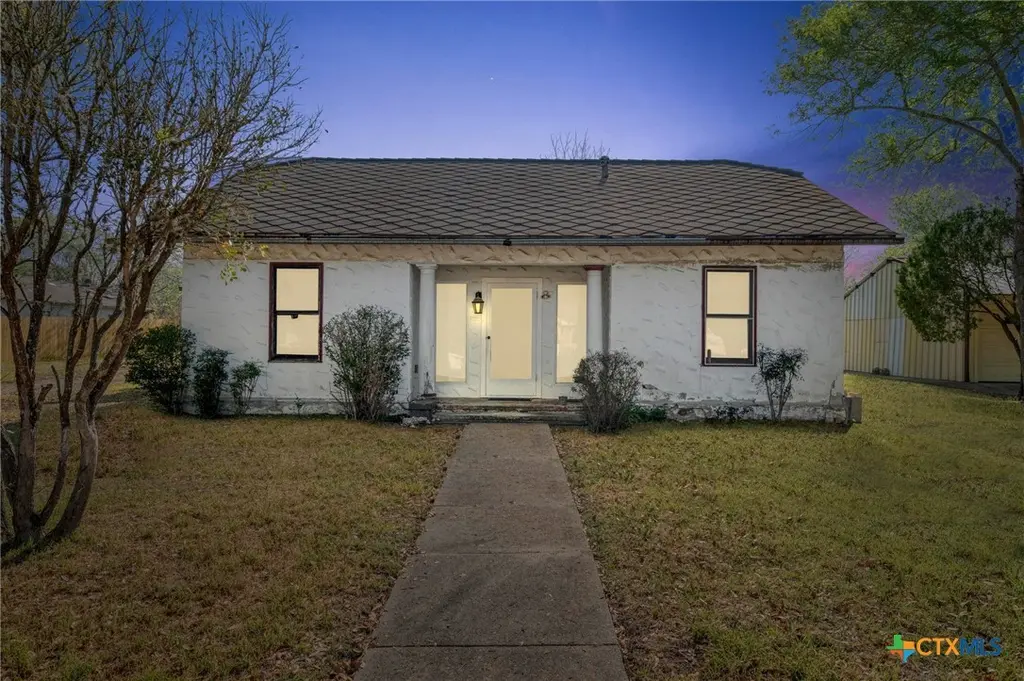
809 S Pecan Ave · Luling, TX
Flood risk 1/10 · Minimal
- FEMA flood zone
- X (unshaded)
- Chance of flooding over 30 yrs
- 0.0%
- Est. flood insurance / yr
- $507 – $1,088
Fire risk 4/10 · Minor
- Est. fire insurance / yr
- $1,222 – $2,270
Heat risk 8/10 · Major
- Hot days now (above 109°F)
- 7 days/yr
- Hot days in 30 yrs
- 22 days/yr
Wind risk 8/10 · Major
- Chance of severe wind over 30 yrs
- 80.0%
Air-quality risk 1/10 · Minimal
- Unhealthy air days now
- 0 days/yr
- Unhealthy air days in 30 yrs
- 0 days/yr
Risk factors via First Street. Map © Google.
Why this score? — see what drove the D grade
The composite is a weighted blend of 9 inputs, each scored 0–100. Each bar is that input's sub-score; the figure is the points it added to the 100-point composite (weight × sub-score).
- ARV discount +15.0/15.0
- Cash flow +11.6/30.0
- Livability +3.6/5.0
- 1% rule +3.4/10.0
- DSCR +3.4/10.0
- Rent growth +2.5/5.0
- Condition / age +2.5/5.0
- Schools +2.1/10.0
- Appreciation +0.0/10.0
$199,000
🖨 Deal sheet (PDF) 📄 Offer letter ✓ Due diligence
Listing remarks MLS
MOTIVATED SELLER! Charming Home on a Spacious Lot! Nestled in a peaceful and conveniently located neighborhood, this delightful home offers comfortable living with plenty of character. Featuring 3 well-sized bedrooms and 2 full baths, this home provides ample space for everyday living. The kitchen is inviting, with a cozy dining area perfect for family meals and gatherings. A thoughtfully designed utility room adds convenience to your daily routine. The home exudes charm with its unique personality and thoughtful touches throughout. The expansive backyard backs up to an alley, offering plenty of room for outdoor activities and potential for future projects. Whether you're entertaining or simply relaxing, this home provides the perfect blend of space, comfort, and potential.
Key facts
- Cozy dining area
- Spacious lot
- Expansive backyard
Tags
Neighborhood map
What this means for you Summary
Snapshot
- This is a 3-bed/2.0-bath single-family listed at $199k.
Deal economics
- At list price, monthly cash flow is $-64 ($-764/yr) — negative.
- To cash-flow at today's rent, offer at most $188k (5.6% below list).
- To meet the 1% rule (rent ≥ 1% of price), the offer needs to be $167k (16.1% below list).
- Recommended offer: $167k (16.1% below list) — sets the bar for 1% rule.
- Cap rate 5.9% vs local median 3.7% in Luling — top-decile yield for the area; either an underpriced asset or a hidden risk that comps aren't pricing in. Stress-test before assuming the spread holds.
Location & tenants
- Location reads 71/100 on livability (#303 in TX) — a middle-class / working-renter tenant base. Strengths: cost of living A+, housing A+; Watch: amenities F, commute F.
- Luling ISD (town): math 23% / reading 27% proficiency, ranked #718 of 826 in TX (top 87%) — low school quality limits family demand, transient renter base, plan for 1-2y turnover; 68% free/reduced lunch — lower-income household profile, screen leases tightly.
- Zoned schools: Leonard Shanklin El (math 32% / reading 27%, grade F, #2,525 of 4,322 statewide, top 62%, 699 students, 80% FRL); Gilbert Gerdes J H (math 17% / reading 24%, grade F, #1,407 of 1,662 statewide, top 86%, 310 students, 86% FRL); Luling H S (math 17% / reading 32%, grade F, #1,264 of 1,632 statewide, top 82%, 407 students, 73% FRL).
- Market conditions: 162 active listings in the ZIP; 6 comparable units currently listed for rent nearby; rentals at typical pace (median 18d on market — plan ~3-4 weeks tenant-placement turnaround); 529 units permitted in Caldwell County in 2024 (6 in 5+ unit buildings).
Forward outlook
- Local home prices are declining (-3.0%/yr); year-one equity from $1k of loan paydown is wiped out by about $6k of value loss. Plan a longer hold.
- Caldwell County population projected at +33% by 2050 — long-run rental-demand tailwind backs the buy-and-hold thesis.
Negotiation context
- It's been on market 234 days — a 12% lower offer ($175k) is reasonable based on typical stale-listing flexibility.
- 2 sale attempts with the ask held roughly flat each time — persistent listings suggest the price (not the market) is what's stuck; bring a comps-based counter.
Risks & watch-outs
- Watch-outs: built in 1940 — expect roof / HVAC / electrical / plumbing capex.
- Climate carrying-cost: severe wind risk, 80% chance of damaging wind over 30y; extreme-heat days projected 7→22/yr by 2055 (HVAC capex compounding) — expect insurance premiums to compound above CPI over the hold.
Questions for the listing agent
- What do current leases actually rent for vs. the listed asking? Can we see a recent rent roll and the last 12 months of T-12 income?
- It's been on market 234 days. Have you received any prior offers? Is the seller open to a 16% concession, seller financing, or rate buy-down credit?
- Built in 1940 — when were the roof, HVAC, electrical panel, plumbing, and water heater last replaced?
- Why hasn't it sold? Are there any deal-killer items the seller is aware of (foundation, flood, title, zoning, code violations)?
- Is there a deadline driving the sale (1031 exchange, divorce, estate, relocation)? That informs how much negotiation room exists.
- Schools are F-rated, which usually means shorter tenancies and higher turnover. Who's the typical renter profile here, and what's been the actual vacancy rate?
- The area grade is low — what's the realistic commute time and amenity access for the typical tenant pool here? Any planned neighborhood developments (good or bad) we should know about?
- What's the average days-on-market for RENTAL listings here right now (not sales)? A rising rental-DOM trend means longer vacancies and softer asking-rent achievability than the comps imply.
- What's the recent tenant-quality profile in this submarket — average credit score on applications, eviction rate, late-payment / NSF rate, and stable-employment percentage? A property-management company in the area should have these aggregated.
- How much new for-sale + rental construction is in the pipeline within 1–3 miles? Heavy new supply typically softens prices + rents 12–24 months out; constrained supply supports both.
Investment metrics
- 1% rule
- 0.84% ✗
- Cap rate
- 5.91%
- Cash-on-cash
- -1.37%
- DSCR
- 0.94
- GRM
- 9.9
CMA / ARV
- ARV (median comp)
- $246,101
- List price
- $199,000
- Delta
- -19.14%
- Verdict
- UNDERPRICED
- Comps
- 20 within 1.0 mi
Show comp detail 6 sales within ~0.75 mi
| Address | Dist | Beds/Ba | Sqft | Sold | Price | $/sf | Match |
|---|---|---|---|---|---|---|---|
| 409 E Bowie St | 0.41mi | 3/2.0 | 1,964 (+7%) | 3mo | $160,000 | $81 | 67 |
| 121 Hillcrest Dr | 0.40mi | 4/2.0 (+1) | 1,738 (-5%) | 4mo | $234,000 | $135 | 63 |
| 119 W Crockett St | 0.60mi | 3/2.0 | 1,826 (-1%) | 10mo | $315,000 | $173 | 62 |
| 208 S Mulberry Ave | 0.62mi | 3/2.0 | 1,910 (+4%) | 7mo | $305,000 | $160 | 59 |
| 312 Holly Ave | 0.53mi | 3/3.0 | 1,760 (-4%) | 10mo | $310,000 | $176 | 56 |
| 101 Parkview Dr | 0.32mi | 3/2.0 | 1,578 (-14%) | 11mo | $310,000 | $196 | 52 |
Match score weights: distance 35% · size 25% · config 20% · recency 20%. Top-matched comps best support the ARV.
Projected returns pro-forma
-3.0% appreciation · 3.0% rent growth · sell at horizon
- IRR
- -18.5%
- Equity multiple
- 0.35×
- Total profit
- $-36,270
- Equity at exit
- $29,672
- IRR
- -10.9%
- Equity multiple
- 0.34×
- Total profit
- $-36,680
- Equity at exit
- $17,206
Cash invested: $55,720 (down + closing). Projections, not guarantees.
Landlord ↔ Tenant lean methodology
- Overall (STATE)
- 87 Strongly Landlord-Friendly
- State Texas
- 87 Strongly Landlord-Friendly · R+5
- County
- — inherits STATE
- City
- — inherits STATE
ZIP-level market 78648
- Home prices YoY
- -13.3%
- Active inventory
- 162
- Price-to-rent
- 9.9×
Monthly cashflow live
- Estimated rent
- $1,670 high interval (Pro) →
- Mortgage (P&I)
- −$1,044
- Tax from tax record
- −$257 /mo · $3,081/yr
- Insurance
- −$83
- HOA
- −$0
- Vacancy / Maint / Mgmt
- −$351
- Net cashflow
- $-64
Break-even live
Sensitivity live
| Price | -10% $49 | -5% $-7 | +0% $-64 | +5% $-120 | +10% $-176 |
|---|---|---|---|---|---|
| Rent | -10% $-196 | -5% $-130 | +0% $-64 | +5% $2 | +10% $68 |
| Rate | -1.0pp $37 | -0.5pp $-13 | base $-64 | +0.5pp $-115 | +1.0pp $-168 |
UW: 25.0% down · 7.5% · 30yr · 1.5% tax · 5.0% vac · 8.0% maint · 8.0% mgmt
Financing live
Cash to close
- Down payment
- $49,750
- Closing costs
- $5,970
- Reserves months
- —
- Total cash needed
- —
Loan-product check · same deal, 3 products live
Conventional
25% down · 7.5% · 30yr
- Down + closing
- —
- Monthly P&I
- —
- Monthly cashflow
- —
- DSCR
- —
- Eligible?
- —
Personal DTI + credit; lowest rate.
DSCR
20% down · 8.5% · 30yr
- Down + closing
- —
- Monthly P&I
- —
- Monthly cashflow
- —
- DSCR
- —
- Eligible?
- —
No personal income docs; deal must DSCR.
Hard money
10% down · 12.0% · 12mo
- Down + closing
- —
- Monthly P&I
- —
- Monthly cashflow
- —
- DSCR
- —
- Eligible?
- —
Short-term bridge; refi at stabilization.
Rent comps 6 comps
| Address | Beds | Baths | Sqft | Rent | $/sqft | DOM | Units | Dist |
|---|---|---|---|---|---|---|---|---|
| 609 S Pecan Ave Luling, TX | 2.0 | 2.0 | 1368 | $1,600 | $1.17 | 0d | 1 | 0.15mi |
| 600 S Pecan Ave Luling, TX | 3.0 | 2.0 | 1754 | $1,900 | $1.08 | 0d | 1 | 0.17mi |
| 521 S Oak Ave Luling, TX | 3.0 | 2.0 | 1263 | $1,650 | $1.31 | 45d | 1 | 0.31mi |
| 127 Hillcrest Dr Luling, TX | 3.0 | 2.0 | 1383 | $1,550 | $1.12 | 18d | 1 | 0.40mi |
| 306 E Bowie St Luling, TX | 2.0 | 2.0 | 1243 | $1,299 | $1.05 | 12d | 1 | 0.42mi |
| 106 Huff St Luling, TX | 3.0 | 1.5 | 1273 | $1,600 | $1.26 | 45d | 1 | 0.57mi |
Listing history 18 events
-
2026-06-21days on market $199,000 Active 234 DOM
-
2026-06-18days on market $199,000 Active 231 DOM
-
2026-06-17days on market $199,000 Active 230 DOM
-
2026-06-16days on market $199,000 Active 229 DOM
-
2026-06-15days on market $199,000 Active 228 DOM
-
2026-06-13days on market $199,000 Active 226 DOM
-
2026-06-09days on market $199,000 Active 222 DOM
-
2026-06-08days on market $199,000 Active 221 DOM
-
2026-06-07days on market $199,000 Active 220 DOM
-
2026-06-04days on market $199,000 Active 217 DOM
-
2026-06-03days on market $199,000 Active 216 DOM
-
2026-06-02days on market $199,000 Active 215 DOM
-
2026-06-01days on market $199,000 Active 214 DOM
-
2026-05-31days on market $199,000 Active 213 DOM
-
2025-10-30$199,000 Active 784-char remark
Show marketing remark (784 chars)
MOTIVATED SELLER! Charming Home on a Spacious Lot! Nestled in a peaceful and conveniently located neighborhood, this delightful home offers comfortable living with plenty of character. Featuring 3 well-sized bedrooms and 2 full baths, this home provides ample space for everyday living. The kitchen is inviting, with a cozy dining area perfect for family meals and gatherings. A thoughtfully designed utility room adds convenience to your daily routine. The home exudes charm with its unique personality and thoughtful touches throughout. The expansive backyard backs up to an alley, offering plenty of room for outdoor activities and potential for future projects. Whether you're entertaining or simply relaxing, this home provides the perfect blend of space, comfort, and potential.
-
2025-09-30historical
-
2025-03-30$225,000 Active
-
2004-11-18soldstatus
ⓘ Source: listings_history table (triggers on properties + properties_extension) + one-shot
backfill from property_details.listing_events for pre-trigger history.
Tax reassessment forecast TX · Resets to sale price
- Current annual tax
- $3,081 · $257/mo
- Projected year-2 tax
- $3,642 · $303/mo
- Expected delta
- +$560/yr (+$47/mo · 18.2%)
ⓘ Screening estimate from a state-policy table — verify with the county assessor before closing.
Climate risk First Street
- Flood 1/10 Low FEMA zone X (unshaded) · 0% chance over 30 yrs
- Wildfire 4/10 Moderate
- Heat 8/10 Severe 7 d/yr ≥109°F today · 22 d/yr by 30 yrs out
- Wind 8/10 Severe 80% chance of damaging wind over 30 yrs
- Air quality 1/10 Low 0 unhealthy d/yr today · 0 by 30 yrs out
Nearby sold comps map
Loading sold comps map…
Walkable amenities ~0.75 mi
Loading nearby amenities…
Taxation est. · year 1
- Rental income
- $20,045
- − Mortgage interest
- −$11,147
- − Property taxes
- −$3,081
- − Insurance
- −$995
- − Repairs & maintenance
- −$1,604
- − Management
- −$1,604
- − Depreciation
- −$5,789
- Taxable loss
- −$4,175
- Est. tax savings @ 24.0%
- +$1,002
- After-tax cash flow
- $238/yr
For passive investors: Depreciation is non-cash, so a rental often shows a tax loss while cash-flowing — sheltering income. Rental losses are passive: they offset passive income freely, and up to $25,000/yr can offset ordinary (W-2) income if you actively participate and your MAGI is under $100k (phasing out to $0 by $150k); unused losses carry forward. On sale, claimed depreciation is recaptured at up to 25%, and gains may owe capital-gains tax (a 1031 exchange can defer both). Figures are a year-1 estimate at your 24.0% rate — not tax advice; consult a CPA.
Schools (NCES district)
- District
- Luling ISD
- NCES district ID
- 4828590
- Math proficiency
- 23% ▼ -9.00%
- Reading proficiency
- 27% ▼ -2.00%
- Median HH income
- $41,233
- Composite
- 21.21/100
- National rank
- #8411
- State rank
- #718 of 826 in TX
Livability — Luling
- Score
- 71/100
- State rank
- #303
- US rank
- #6859
Category grades
Schools grade is shown separately in the Schools card above.
Census & demographics
- Census place
- Luling, TX
- Population (ZIP)
- 8,022
Population outlook (Caldwell County) Hauer SSP2
- Today (2025)
- 46,557 people
- By 2030
- 49,673 · +6.7%
- By 2040
- 55,827 · +19.9%
- By 2050
- 61,832 · +32.8%
- By 2075
- 77,212 · +65.8%
- By 2100
- 89,225 · +91.6%
Race, ethnicity, and origin ACS 2023
- Neighborhood character
- Diverse neighborhood (Simpson 0.57)
- Race & ethnicity
- Hispanic / Latino 48% White 45% Two or more races 26% Black 6%
- Hispanic origin (detail)
- Mexican 46%
- Common ancestry
- Serbian 5% Lithuanian 2% Russian 1%
- Foreign-born
- 12% · Canada
- Languages at home
- 71% English-only · Spanish 28%
Political lean MEDSL · Caldwell
- 2024 margin
- R (+14.4) · D 42.2% · R 56.6% · Other 1.2%
- 2008→2024 swing
- -8.4pp toward R · 2008: -6.0pp · 2024: -14.4pp
- All cycles
- 2024: R+14.4 2020: R+9.1 2016: R+15.8 2012: R+11.1 2008: R+6.0
Not yet ingested
- Civics
- —
Market trends
- HPI YoY
- ▼ -34.32%
- Current HPI
- 224.4365
- Rent YoY
- —
- Metro
- —
- State GDP YoY
- ▲ 3.95%
- F500 in state
- 110
Industry mix (Fortune 500 HQ in TX)
| Industry | F500 HQs | Revenue |
|---|---|---|
| Energy | 16 | $1,198B |
|
||
| Technology | 5 | $198B |
|
||
| Engineering / Construction | 4 | $72B |
|
||
| Energy Services | 3 | $60B |
|
||
| Utilities | 3 | $41B |
|
||
| Healthcare | 2 | $330B |
|
||
Price history
-11.6% since first listed4 events — show timeline
- 2025-10-30 Listed $199,000 CTXMLS
- 2025-09-30 Listing Removed — CTXMLS
- 2025-03-30 Listed $225,000 CTXMLS
- 2004-11-18 Sold (Public Records) — Public Records
Property tax history
+12.4%/yrLatest (2025): $3,081 · -3.2% YoY. Source: county tax records.
Cash-flow waterfall
monthlySold comps — $/sqft
last 12 mo · ≤1 miLoading sold comps…