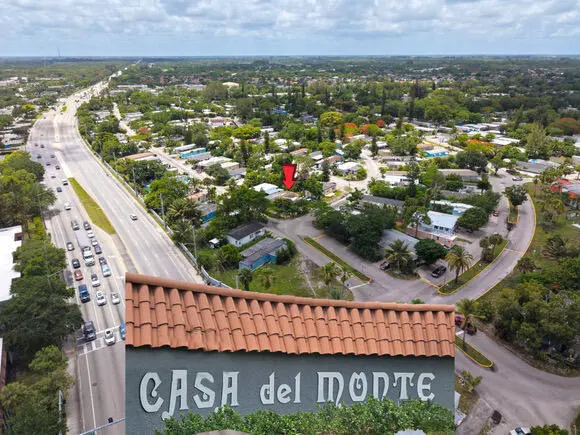
6201 18th St S · Greenacres, FL
Flood risk 4/10 · Minor
- FEMA flood zone
- X (unshaded)
- Chance of flooding over 30 yrs
- 0.21%
- Est. flood insurance / yr
- $507 – $1,088
Fire risk 1/10 · Minimal
- Est. fire insurance / yr
- $947 – $1,759
Heat risk 10/10 · Severe
- Hot days now (above 105°F)
- 7 days/yr
- Hot days in 30 yrs
- 25 days/yr
Wind risk 10/10 · Severe
- Chance of severe wind over 30 yrs
- 99.0%
Air-quality risk 2/10 · Minimal
- Unhealthy air days now
- 1 days/yr
- Unhealthy air days in 30 yrs
- 1 days/yr
Risk factors via First Street. Map © Google.
Why this score? — see what drove the D grade
The composite is a weighted blend of 9 inputs, each scored 0–100. Each bar is that input's sub-score; the figure is the points it added to the 100-point composite (weight × sub-score).
- 1% rule +10.0/10.0
- Cash flow +8.7/30.0
- ARV discount +7.5/15.0
- Schools +4.3/10.0
- Condition / age +3.8/5.0
- Livability +3.5/5.0
- DSCR +2.4/10.0
- Rent growth +2.1/5.0
- Appreciation +0.0/10.0
$140,000
🖨 Deal sheet 📄 Offer letter ✓ Due diligence
Key facts
- 7 parking spots
- Community pool
- Built 1987
Property features AI
Finance
- Other: Pets allowed (pet restrictions possible); Annual taxes listed separately
- Financial info: Land lease of $1,000 monthly (lease expires 2028-01-31)
- HOA & community: La Casa Del Monte association; Monthly association fee; Association amenities: clubhouse, pool, playground, recreation facilities; Association fee covers trash, common areas, and pool service
Exterior
- Parking: Covered carport (attached) with 1 carport space; Detached carport; Driveway; Total parking for 7 vehicles; Seven open parking spaces
- Security: Closed-circuit camera system; Smoke detectors
- Utilities: Public water; Public sewer; Sewer and water available; Other utilities available
- Home design: Manufactured home (double wide); One-story; Resale property; Faces south; Mobile home remains on site
- Construction: Aluminum and vinyl siding with metal frame; Metal and shingle roof; No skirting
- Exterior features: Partial fencing; Workshop; Mobile home on property; Fruit trees; Oversized lot; Asphalt road access; Entry at Foresthill and Jog Road
Interior
- Kitchen: Electric range; Microwave; Refrigerator; Electric water heater
- Bedrooms: One main-level bedroom
- Flooring: Vinyl; Wood
- Bathrooms: Three full bathrooms (one on main level)
- Heating & cooling: Window/wall heating; Wall/window cooling units; Ceiling fans
- Interior features: Walk-in closets; Smoke detectors; Closed-circuit cameras
- Laundry & utility: Inside laundry
Neighborhood map
What this means for you Summary
Snapshot
- This is a 3-bed/3.0-bath manufactured listed at $140k. Condition is rated good.
Deal economics
- At list price, monthly cash flow is $-119 ($-1k/yr) — negative.
- To cash-flow at today's rent, offer at most $123k (12.3% below list).
- Meets the 1% rule at list price ($2k rent vs $140k).
- Recommended offer: $123k (12.3% below list) — sets the bar for cash-flow.
Location & tenants
- Location reads 69/100 on livability (#490 in FL) — a middle-class / working-renter tenant base. Strengths: cost of living A+, housing A+, health & safety A; Watch: employment D, amenities F, commute F.
- Palm Beach (suburban): math 46% / reading 53% proficiency, ranked #34 of 73 in FL (top 47%) — families likely to look elsewhere, expect single-tenant / working-renter base with shorter leases.
- Zoned schools: Cholee Lake Elementary School (math 35% / reading 34%, grade F, #1,709 of 2,144 statewide, top 81%, 936 students, 72% FRL); Okeeheelee Middle School (math 34% / reading 40%, grade F, #399 of 571 statewide, top 71%, 1,377 students, 68% FRL); Palm Beach Central High School (math 42% / reading 55%, grade D, #198 of 667 statewide, top 30%, 2,980 students, 40% FRL).
- Market conditions: Rents soft (-1.6%/yr); 314 active listings in the ZIP; 3,974 units permitted in Palm Beach County in 2024 (1,012 in 5+ unit buildings).
- At $2,340/mo this rent would consume 46% of the median local household income ($61k/yr) (locally 2254% of renters already pay >50% of income on rent) — very limited rent-growth headroom before tenants either downsize or default.
Forward outlook
- Local home prices are declining (-3.0%/yr); year-one equity from $968 of loan paydown is wiped out by about $4k of value loss. Plan a longer hold.
- Palm Beach County population projected at +30% by 2050 — long-run rental-demand tailwind backs the buy-and-hold thesis.
Negotiation context
- It's been on market 16 days — a 2% lower offer ($138k) is reasonable based on typical stale-listing flexibility.
Risks & watch-outs
- Watch-outs: HOA is 43% of rent.
- Climate carrying-cost: severe wind risk, 99% chance of damaging wind over 30y; extreme-heat days projected 7→25/yr by 2055 (HVAC capex compounding) — expect insurance premiums to compound above CPI over the hold.
Questions for the listing agent
- What do current leases actually rent for vs. the listed asking? Can we see a recent rent roll and the last 12 months of T-12 income?
- What does the HOA fee cover, when was the last increase, and are there any pending special assessments or reserve-fund shortfalls?
- Is there a deadline driving the sale (1031 exchange, divorce, estate, relocation)? That informs how much negotiation room exists.
- Schools are D-rated, which usually means shorter tenancies and higher turnover. Who's the typical renter profile here, and what's been the actual vacancy rate?
- The area grade is low — what's the realistic commute time and amenity access for the typical tenant pool here? Any planned neighborhood developments (good or bad) we should know about?
- What's the average days-on-market for RENTAL listings here right now (not sales)? A rising rental-DOM trend means longer vacancies and softer asking-rent achievability than the comps imply.
- What's the recent tenant-quality profile in this submarket — average credit score on applications, eviction rate, late-payment / NSF rate, and stable-employment percentage? A property-management company in the area should have these aggregated.
- How much new for-sale + rental construction is in the pipeline within 1–3 miles? Heavy new supply typically softens prices + rents 12–24 months out; constrained supply supports both.
Investment metrics
- 1% rule
- 1.67% ✓
- Cap rate
- 5.27%
- Cash-on-cash
- -3.64%
- DSCR
- 0.84
- GRM
- 5.0
CMA / ARV
No comps found within radius.
Projected returns pro-forma
-3.0% appreciation · 0.0% rent growth · sell at horizon
- IRR
- -29.5%
- Equity multiple
- 0.07×
- Total profit
- $-36,460
- Equity at exit
- $20,874
- IRR
- -85.1%
- Equity multiple
- -0.67×
- Total profit
- $-65,354
- Equity at exit
- $12,105
Cash invested: $39,200 (down + closing). Projections, not guarantees.
Landlord ↔ Tenant lean methodology
- Overall (STATE)
- 87 Strongly Landlord-Friendly
- State Florida
- 87 Strongly Landlord-Friendly · R+3
- County
- — inherits STATE
- City
- — inherits STATE
ZIP-level market 33415
- Rents YoY
- -1.6%
- Active inventory
- 314
- Price-to-rent
- 5.0×
Monthly cashflow live
- Estimated rent
- $2,340 medium interval (Pro) →
- Mortgage (P&I)
- −$734
- Tax est. 1.5%
- −$175 /mo · $2,100/yr
- Insurance
- −$58
- HOA
- −$1,000
- Vacancy / Maint / Mgmt
- −$491
- Net cashflow
- $-119
Break-even live
UW: 25.0% down · 7.5% · 30yr · 1.5% tax · 5.0% vac · 8.0% maint · 8.0% mgmt
Financing live
Cash to close
- Down payment
- $35,000
- Closing costs
- $4,200
- Reserves months
- —
- Total cash needed
- —
Loan-product check · same deal, 3 products live
Conventional
25% down · 7.5% · 30yr
- Down + closing
- —
- Monthly P&I
- —
- Monthly cashflow
- —
- DSCR
- —
- Eligible?
- —
Personal DTI + credit; lowest rate.
DSCR
20% down · 8.5% · 30yr
- Down + closing
- —
- Monthly P&I
- —
- Monthly cashflow
- —
- DSCR
- —
- Eligible?
- —
No personal income docs; deal must DSCR.
Hard money
10% down · 12.0% · 12mo
- Down + closing
- —
- Monthly P&I
- —
- Monthly cashflow
- —
- DSCR
- —
- Eligible?
- —
Short-term bridge; refi at stabilization.
HOA detail
- Monthly dues
- $1,000 · $12,000/yr
Listing history 10 events
-
2026-06-18days on market $140,000 Active 16 DOM
-
2026-06-17days on market $140,000 Active 15 DOM
-
2026-06-16days on market $140,000 Active 14 DOM
-
2026-06-15days on market $140,000 Active 13 DOM
-
2026-06-13days on market $140,000 Active 11 DOM
-
2026-06-09days on market $140,000 Active 7 DOM
-
2026-06-08days on market $140,000 Active 6 DOM
-
2026-06-07days on market $140,000 Active 5 DOM
-
2026-06-04days on market $140,000 Active 2 DOM
-
2026-06-02$140,000 Active 1 DOM
ⓘ Source: listings_history table (triggers on properties + properties_extension) + one-shot
backfill from property_details.listing_events for pre-trigger history.
Climate risk First Street
- Flood 4/10 Moderate FEMA zone X (unshaded) · 21% chance over 30 yrs
- Wildfire 1/10 Low
- Heat 10/10 Extreme 7 d/yr ≥105°F today · 25 d/yr by 30 yrs out
- Wind 10/10 Extreme 99% chance of damaging wind over 30 yrs
- Air quality 2/10 Low 1 unhealthy d/yr today · 1 by 30 yrs out
Nearby sold comps map
Loading sold comps map…
Walkable amenities ~0.75 mi
Loading nearby amenities…
Taxation est. · year 1
- Rental income
- $28,082
- − Mortgage interest
- −$7,842
- − Property taxes
- −$2,100
- − Insurance
- −$700
- − Repairs & maintenance
- −$2,247
- − Management
- −$2,247
- − HOA
- −$12,000
- − Depreciation
- −$4,073
- Taxable loss
- −$3,126
- Est. tax savings @ 24.0%
- +$750
- After-tax cash flow
- $-675/yr
For passive investors: Depreciation is non-cash, so a rental often shows a tax loss while cash-flowing — sheltering income. Rental losses are passive: they offset passive income freely, and up to $25,000/yr can offset ordinary (W-2) income if you actively participate and your MAGI is under $100k (phasing out to $0 by $150k); unused losses carry forward. On sale, claimed depreciation is recaptured at up to 25%, and gains may owe capital-gains tax (a 1031 exchange can defer both). Figures are a year-1 estimate at your 24.0% rate — not tax advice; consult a CPA.
Condition & rehab AI · 14 photos
The home is in good condition with minor repairs needed to the exterior wall and landscaping. Painting the exterior wall and trimming the landscaping can significantly increase its resale and rental value.
Repairs flagged
- Minor Landscaping — The landscaping is overgrown and needs trimming.
Value-add opportunities
- Resale Painting the exterior wall — Painting the exterior wall can improve the curb appeal and make the home look more inviting to potential buyers.
- Rental Trimming the landscaping — Trimming the landscaping can improve the curb appeal and make the home more attractive to potential renters.
Renovation cost estimate screening
| Repair item | Severity | Est. cost |
|---|---|---|
| Landscaping · The landscaping is overgrown and needs trimming. | Minor | $500–3,000 |
| Total estimated repair cost · 1 items | $500–3,000 |
Value-add ROI direction
- Resale Painting the exterior wall — Painting the exterior wall can improve the curb appeal and make the home look more inviting to potential buyers. ↑
- Rental Trimming the landscaping — Trimming the landscaping can improve the curb appeal and make the home more attractive to potential renters. ↑
ⓘ Cost ranges are severity-bucket heuristics (US national rule-of-thumb). Get contractor quotes + a written scope before underwriting a rehab budget.
Schools (NCES district)
- District
- Palm Beach
- NCES district ID
- 1201500
- Math proficiency
- 46% ▼ -16.00%
- Reading proficiency
- 53% ▼ -4.00%
- Median HH income
- $53,943
- Composite
- 42.72/100
- National rank
- #3160
- State rank
- #34 of 73 in FL
Livability — Greenacres
- Score
- 69/100
- State rank
- #490
- US rank
- #9008
Category grades
Schools grade is shown separately in the Schools card above.
Census & demographics
- County
- Palm Beach County · 1,438,312 people
- City population
- 65,478
- Metro
- Miami-Fort Lauderdale-Pompano Beach, FL
- Population (ZIP)
- 54,581
- Household income
- $61,274
- Rent vs Own
- Severe rent burden
- 2254.0
Population outlook (Palm Beach County) Hauer SSP2
- Today (2025)
- 1,637,487 people
- By 2030
- 1,743,255 · +6.5%
- By 2040
- 1,948,712 · +19.0%
- By 2050
- 2,132,979 · +30.3%
- By 2075
- 2,530,027 · +54.5%
- By 2100
- 2,706,979 · +65.3%
Race, ethnicity, and origin ACS 2023
- Neighborhood character
- Diverse neighborhood (Simpson 0.63)
- Race & ethnicity
- Hispanic / Latino 53% Two or more races 26% White 21% Black 21% Asian 2%
- Hispanic origin (detail)
- Mexican 7% Puerto Rican 6% Cuban 14% Dominican 2% Salvadoran 1%
- Common ancestry
- Hispanic 9% Romanian 1% Lithuanian 1%
- Foreign-born
- 44% · Canada, Jamaica, Dominican Republic
- Languages at home
- 40% English-only · Spanish 49% French/Haitian/Cajun 8% Other Indo-European 1%
Political lean MEDSL · Palm Beach
- 2024 margin
- Toss-up / Even · D 50.0% · R 49.2%
- 2008→2024 swing
- -22.1pp toward R · 2008: 22.9pp · 2024: 0.8pp
- All cycles
- 2024: D+0.8 2020: D+12.8 2016: D+15.3 2012: D+17.0 2008: D+22.9
Not yet ingested
- Civics
- —
Market trends
- HPI YoY
- ▼ -400.29%
- Current HPI
- 413.9695
- Rent YoY
- ▼ -1.64%
- Metro
- Miami-Fort Lauderdale-Pompano Beach, FL
- State GDP YoY
- ▲ 3.28%
- F500 in state
- 36
Industry mix (Fortune 500 HQ in FL)
| Industry | F500 HQs | Revenue |
|---|---|---|
| Industrial Technology | 2 | $29B |
|
||
| Insurance | 2 | $17B |
|
||
| Retail | 1 | $60B |
|
||
| Technology Distribution | 1 | $58B |
|
||
| Homebuilding | 1 | $35B |
|
||
| Technology Manufacturing | 1 | $35B |
|
||
Price history
1 event — show timeline
- 2026-06-02 Listed $140,000 Beaches MLS
Cash-flow waterfall
monthlySold comps — $/sqft
last 12 mo · ≤1 miLoading sold comps…