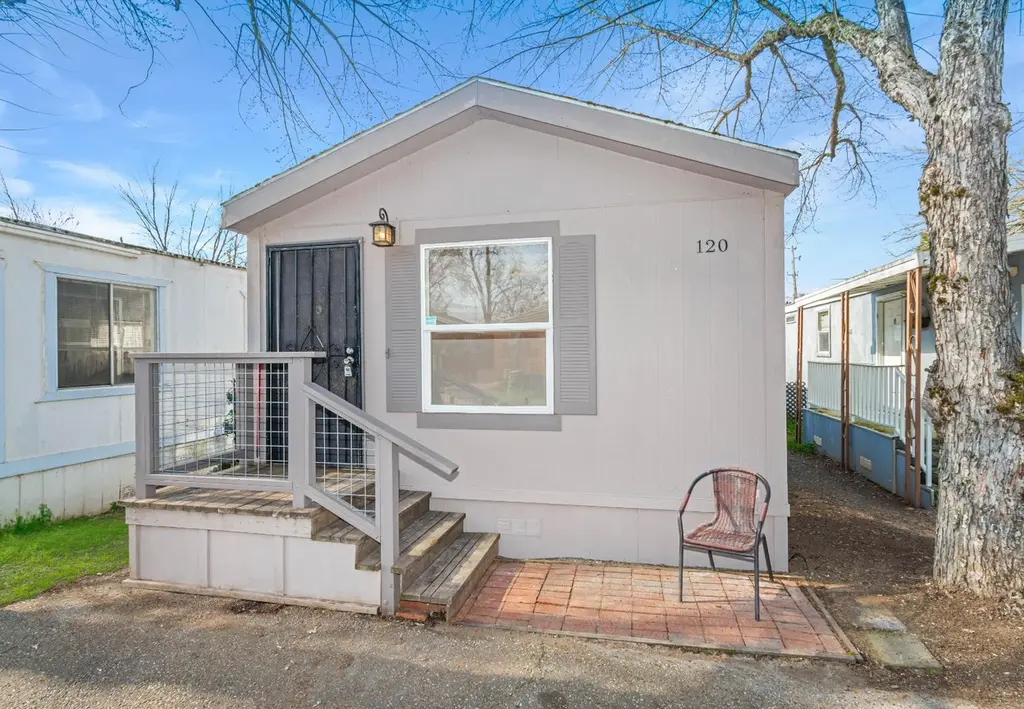
120 Lark St · Penn Valley, CA
Flood risk 1/10 · Minimal
- FEMA flood zone
- X (unshaded)
- Chance of flooding over 30 yrs
- 0.0%
- Est. flood insurance / yr
- $507 – $1,088
Fire risk 10/10 · Severe
- Est. fire insurance / yr
- $659 – $1,223
Heat risk 6/10 · Moderate
- Hot days now (above 98°F)
- 7 days/yr
- Hot days in 30 yrs
- 16 days/yr
Wind risk 1/10 · Minimal
- Chance of severe wind over 30 yrs
- —
Air-quality risk 10/10 · Severe
- Unhealthy air days now
- 31 days/yr
- Unhealthy air days in 30 yrs
- 38 days/yr
Risk factors via First Street. Map © Google.
Why this score? — see what drove the B+ grade
The composite is a weighted blend of 9 inputs, each scored 0–100. Each bar is that input's sub-score; the figure is the points it added to the 100-point composite (weight × sub-score).
- Cash flow +30.0/30.0
- ARV discount +14.9/15.0
- 1% rule +10.0/10.0
- DSCR +10.0/10.0
- Schools +3.2/10.0
- Rent growth +2.5/5.0
- Livability +2.5/5.0
- Condition / age +2.5/5.0
- Appreciation +0.0/10.0
$54,950
🖨 Deal sheet (PDF) 📄 Offer letter ✓ Due diligence
Listing remarks
Move-in ready and priced to sell! Recent improvements include fresh interior paint, brand new carpet in both bedrooms, updated bathroom finishes, and updated lighting throughout. The home also features both forced heat & air plus an energy-efficient mini-split system for year-round comfort. Refrigerator, washer, and dryer are included, making this a true move-in ready option! Convenient Penn Valley location near shopping, services, and Hwy 20 access. Ideal opportunity for buyers seeking affordability and a comfortable foothill lifestyle. If you've been waiting for the right opportunity, don't wait. Call today, schedule your showing. Homes that feel this welcoming, fresh, comfortable
Key facts
- Dishwasher
- Natural light
- Gas stove
Tags
Property features AI
Finance
- Other: Property is a land-lease site: listed land lease amount (not included in other sections)
- HOA & community: No homeowners association; Not a senior community
Exterior
- Parking: Assigned parking; no garage
- Utilities: Individual electric meter; Individual gas meter; Internet available; Public sewer; Water: private/shared well/other
- Home design: Manufactured in park (single wide); Built in 2001; Updated/remodeled condition
- Construction: Skirting: wood/other/unknown; Manufacturer: Fleetwood Homes; Make/Model: Westfield
- Exterior features: Shingle/composition roof; Landscaped lot, close to clubhouse
Interior
- Kitchen: Free-standing gas range and oven; Free-standing refrigerator; Hood over range; Dishwasher; Pantry cabinet; Synthetic countertops
- Bedrooms: 2 bedrooms
- Flooring: Carpet; Simulated wood/laminate; Linoleum; Other flooring types
- Bathrooms: 1 full bathroom with tub/shower combo
- Heating & cooling: Central heating; Electric heating; Ductless/Multi-zone heating; Wall units and room air conditioning (ductless, multi-unit/multi-zone)
- Interior features: Updated/remodeled interior; Porch steps and covered, enclosed porch/deck; Cathedral/vaulted living room ceiling with attached deck; Pantry cabinet and synthetic countertops in the kitchen; Dual-pane full windows; Pets allowed with limits
- Laundry & utility: Washer and dryer included; Laundry located inside
Neighborhood map
What this means for you Summary
Snapshot
- This is a 2-bed/1.0-bath manufactured listed at $55k.
Deal economics
- At list price, monthly cash flow is $1k ($14k/yr) — positive.
- The deal already cash-flows at list — no discount required.
- Meets the 1% rule at list price ($2k rent vs $55k).
- Recommended offer: $50k (9.0% below list) — sets the bar for market timing.
Location & tenants
- Location reads 50/100 on livability (#1,129 in CA) — a working-class tenant base; expect higher turnover. Strengths: crime A; Watch: employment C-, schools D+, amenities F.
- Penn Valley Union Elementary (town): math 31% / reading 42% proficiency, ranked #253 of 517 in CA (top 49%) — families likely to look elsewhere, expect single-tenant / working-renter base with shorter leases.
- Market conditions: 149 active listings in the ZIP; 215 units permitted in Nevada County in 2024 (0 in 5+ unit buildings).
Forward outlook
- Local home prices are declining (-3.0%/yr); year-one equity from $380 of loan paydown is wiped out by about $2k of value loss. Plan a longer hold.
- Nevada County population projected at -14% by 2050 — secular population decline; favor cash flow + early exit over multi-decade hold.
- At projected returns (-3.0% appreciation + 3.0% rent growth), your $15k cash investment doubles in ~2 years — after that, you're playing with house money.
Negotiation context
- It's been on market 95 days — a 9% lower offer ($50k) is reasonable based on typical stale-listing flexibility.
Risks & watch-outs
- Climate carrying-cost: severe wildfire risk; extreme-heat days projected 7→16/yr by 2055 (HVAC capex compounding) — expect insurance premiums to compound above CPI over the hold.
Questions for the listing agent
- It's been on market 95 days. Have you received any prior offers? Is the seller open to a 9% concession, seller financing, or rate buy-down credit?
- Why hasn't it sold? Are there any deal-killer items the seller is aware of (foundation, flood, title, zoning, code violations)?
- Is there a deadline driving the sale (1031 exchange, divorce, estate, relocation)? That informs how much negotiation room exists.
- Schools are D-rated, which usually means shorter tenancies and higher turnover. Who's the typical renter profile here, and what's been the actual vacancy rate?
- What's the average days-on-market for RENTAL listings here right now (not sales)? A rising rental-DOM trend means longer vacancies and softer asking-rent achievability than the comps imply.
- What's the recent tenant-quality profile in this submarket — average credit score on applications, eviction rate, late-payment / NSF rate, and stable-employment percentage? A property-management company in the area should have these aggregated.
- How much new for-sale + rental construction is in the pipeline within 1–3 miles? Heavy new supply typically softens prices + rents 12–24 months out; constrained supply supports both.
Investment metrics
- 1% rule
- 3.48% ✓
- Cap rate
- 32.18%
- Cash-on-cash
- 92.47%
- DSCR
- 5.11
- GRM
- 2.4
CMA / ARV
- ARV (on-the-fly)
- $65,824
- Comps found
- 2
Show comp detail 2 sales within ~0.75 mi
| Address | Dist | Beds/Ba | Sqft | Sold | Price | $/sf | Match |
|---|---|---|---|---|---|---|---|
| 205 Robin St | 0.06mi | 2/1.0 | 728 (-3%) | 8mo | $64,000 | $88 | 86 |
| 152 Lark St | 0.15mi | 3/2.0 (+1) | 800 (+7%) | 17mo | $58,900 | $74 | 59 |
Match score weights: distance 35% · size 25% · config 20% · recency 20%. Top-matched comps best support the ARV.
Projected returns pro-forma
-3.0% appreciation · 3.0% rent growth · sell at horizon
- IRR
- 93.2%
- Equity multiple
- 5.33×
- Total profit
- $66,600
- Equity at exit
- $8,193
- IRR
- 96.0%
- Equity multiple
- 11.09×
- Total profit
- $155,207
- Equity at exit
- $4,751
Cash invested: $15,386 (down + closing). Projections, not guarantees.
Landlord ↔ Tenant lean methodology
- Overall (STATE)
- 18 Strongly Tenant-Friendly
- State California
- 18 Strongly Tenant-Friendly · D+13
- County
- — inherits STATE
- City
- — inherits STATE
ZIP-level market 95946
- Home prices YoY
- -33.5%
- Active inventory
- 149
- Price-to-rent
- 2.4×
Monthly cashflow live
- Estimated rent
- $1,913 medium interval (Pro) →
- Mortgage (P&I)
- −$288
- Tax from tax record
- −$15 /mo · $176/yr
- Insurance
- −$23
- HOA
- −$0
- Vacancy / Maint / Mgmt
- −$402
- Net cashflow
- $1,186
Break-even live
Sensitivity live
| Price | -10% $1,217 | -5% $1,201 | +0% $1,186 | +5% $1,170 | +10% $1,154 |
|---|---|---|---|---|---|
| Rent | -10% $1,034 | -5% $1,110 | +0% $1,186 | +5% $1,261 | +10% $1,337 |
| Rate | -1.0pp $1,213 | -0.5pp $1,200 | base $1,186 | +0.5pp $1,171 | +1.0pp $1,157 |
UW: 25.0% down · 7.5% · 30yr · 1.5% tax · 5.0% vac · 8.0% maint · 8.0% mgmt
Financing live
Cash to close
- Down payment
- $13,738
- Closing costs
- $1,648
- Reserves months
- —
- Total cash needed
- —
Loan-product check · same deal, 3 products live
Conventional
25% down · 7.5% · 30yr
- Down + closing
- —
- Monthly P&I
- —
- Monthly cashflow
- —
- DSCR
- —
- Eligible?
- —
Personal DTI + credit; lowest rate.
DSCR
20% down · 8.5% · 30yr
- Down + closing
- —
- Monthly P&I
- —
- Monthly cashflow
- —
- DSCR
- —
- Eligible?
- —
No personal income docs; deal must DSCR.
Hard money
10% down · 12.0% · 12mo
- Down + closing
- —
- Monthly P&I
- —
- Monthly cashflow
- —
- DSCR
- —
- Eligible?
- —
Short-term bridge; refi at stabilization.
Listing history 18 events
-
2026-06-21days on market $54,950 Active 95 DOM
-
2026-06-19days on market $54,950 Active 93 DOM
-
2026-06-18days on market $54,950 Active 92 DOM
-
2026-06-17days on market $54,950 Active 91 DOM
-
2026-06-16days on market $54,950 Active 90 DOM
-
2026-06-15days on market $54,950 Active 89 DOM
-
2026-06-14days on market $54,950 Active 87 DOM
-
2026-06-13days on market $54,950 Active 86 DOM
-
2026-06-10days on market $54,950 Active 84 DOM
-
2026-06-09days on market $54,950 Active 83 DOM
-
2026-06-08days on market $54,950 Active 82 DOM
-
2026-06-07days on market $54,950 Active 81 DOM
-
2026-06-05days on market $54,950 Active 78 DOM
-
2026-06-03days on market $54,950 Active 77 DOM
-
2026-06-02days on market $54,950 Active 76 DOM
-
2026-06-01days on market $54,950 Active 75 DOM
-
2026-05-31days on market $54,950 Active 74 DOM
-
2026-05-30days on market $54,950 Active 73 DOM
ⓘ Source: listings_history table (triggers on properties + properties_extension) + one-shot
backfill from property_details.listing_events for pre-trigger history.
Tax reassessment forecast CA · Resets to sale price
- Current annual tax
- $176 · $15/mo
- Projected year-2 tax
- $418 · $35/mo
- Expected delta
- +$241/yr (+$20/mo · 136.8%)
ⓘ Screening estimate from a state-policy table — verify with the county assessor before closing.
Climate risk First Street
- Flood 1/10 Low FEMA zone X (unshaded) · 0% chance over 30 yrs
- Wildfire 10/10 Extreme
- Heat 6/10 Major 7 d/yr ≥98°F today · 16 d/yr by 30 yrs out
- Wind 1/10 Low
- Air quality 10/10 Extreme 31 unhealthy d/yr today · 38 by 30 yrs out
Nearby sold comps map
Loading sold comps map…
Walkable amenities ~0.75 mi
Loading nearby amenities…
Taxation est. · year 1
- Rental income
- $22,957
- − Mortgage interest
- −$3,078
- − Property taxes
- −$176
- − Insurance
- −$275
- − Repairs & maintenance
- −$1,837
- − Management
- −$1,837
- − Depreciation
- −$1,599
- Taxable income
- $14,156
- Est. tax owed @ 24.0%
- −$3,397
- After-tax cash flow
- $10,829/yr
For passive investors: Depreciation is non-cash, so a rental often shows a tax loss while cash-flowing — sheltering income. Rental losses are passive: they offset passive income freely, and up to $25,000/yr can offset ordinary (W-2) income if you actively participate and your MAGI is under $100k (phasing out to $0 by $150k); unused losses carry forward. On sale, claimed depreciation is recaptured at up to 25%, and gains may owe capital-gains tax (a 1031 exchange can defer both). Figures are a year-1 estimate at your 24.0% rate — not tax advice; consult a CPA.
Schools (NCES district)
- District
- Penn Valley Union Elementary
- NCES district ID
- 0601427
- Math proficiency
- 31% ▼ -9.00%
- Reading proficiency
- 42% ▼ -11.00%
- Median HH income
- $58,786
- Composite
- 32.4/100
- National rank
- #5728
- State rank
- #253 of 517 in CA
Livability — Penn Valley
- Score
- 50/100
- State rank
- #1129
- US rank
- #25672
Category grades
Schools grade is shown separately in the Schools card above.
Census & demographics
- Census place
- Penn Valley, CA
- Population (ZIP)
- 9,448
Population outlook (Nevada County) Hauer SSP2
- Today (2025)
- 98,490 people
- By 2030
- 97,295 · -1.2%
- By 2040
- 92,041 · -6.5%
- By 2050
- 85,164 · -13.5%
- By 2075
- 68,436 · -30.5%
- By 2100
- 49,536 · -49.7%
Race, ethnicity, and origin ACS 2023
- Neighborhood character
- Predominantly White (79%)
- Race & ethnicity
- White 79% Hispanic / Latino 14% Two or more races 13%
- Hispanic origin (detail)
- Mexican 7% Puerto Rican 4%
- Common ancestry
- Italian 5% Portuguese 3% Lithuanian 2%
- Foreign-born
- 2% · Canada, South Korea
- Languages at home
- 95% English-only · Spanish 4% French/Haitian/Cajun 1%
Political lean MEDSL · Nevada
- 2024 margin
- D (+12.2) · D 54.4% · R 42.1% · Other 3.5%
- 2008→2024 swing
- +6.9pp toward D · 2008: 5.3pp · 2024: 12.2pp
- All cycles
- 2024: D+12.2 2020: D+14.8 2016: D+4.5 2012: R+4.7 2008: D+5.3
Not yet ingested
- Civics
- —
Market trends
- HPI YoY
- ▼ -114.27%
- Current HPI
- 226.5683
- Rent YoY
- —
- Metro
- —
- State GDP YoY
- ▲ 3.21%
- F500 in state
- 116
Industry mix (Fortune 500 HQ in CA)
| Industry | F500 HQs | Revenue |
|---|---|---|
| Technology | 27 | $1,492B |
|
||
| Financial Services | 3 | $174B |
|
||
| Retail | 3 | $44B |
|
||
| Insurance | 3 | $26B |
|
||
| Media / Entertainment | 2 | $115B |
|
||
| Pharmaceuticals / Biotech | 2 | $62B |
|
||
Property tax history
+3.0%/yrLatest (2025): $176 · +2.9% YoY. Source: county tax records.
Cash-flow waterfall
monthlySold comps — $/sqft
last 12 mo · ≤1 miLoading sold comps…