 🏗️ New Construction
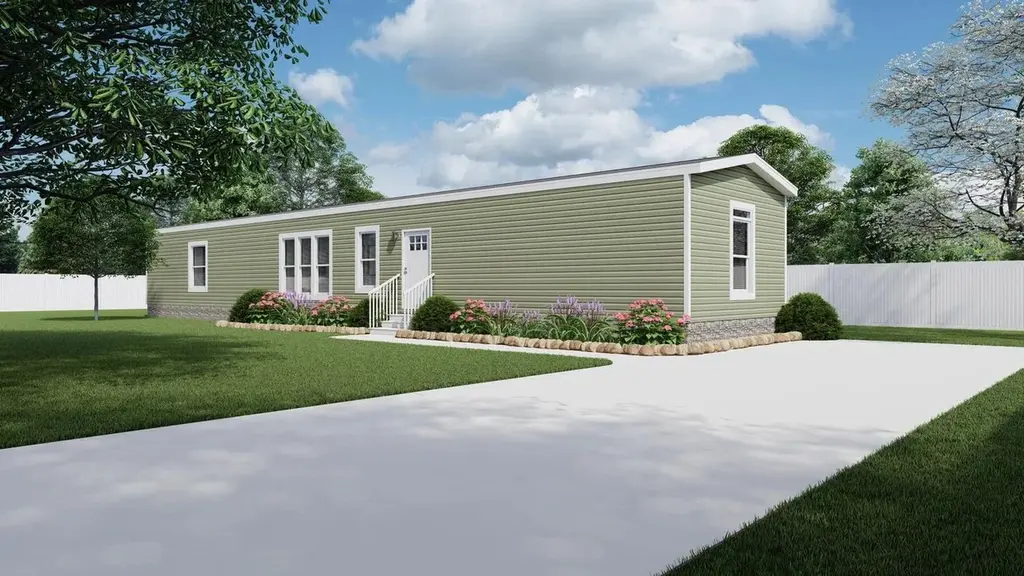
Resolution X Plan · Amarillo, TX
Flood risk 1/10 · Minimal
- FEMA flood zone
- X (unshaded)
- Chance of flooding over 30 yrs
- 0.0%
- Est. flood insurance / yr
- $507 – $1,088
Fire risk 8/10 · Major
- Est. fire insurance / yr
- $1,222 – $2,270
Heat risk 4/10 · Minor
- Hot days now (above 98°F)
- 7 days/yr
- Hot days in 30 yrs
- 20 days/yr
Wind risk 2/10 · Minimal
- Chance of severe wind over 30 yrs
- —
Air-quality risk 2/10 · Minimal
- Unhealthy air days now
- 2 days/yr
- Unhealthy air days in 30 yrs
- 2 days/yr
Risk factors via First Street. Map © Google.
Why this score? — see what drove the B grade
The composite is a weighted blend of 9 inputs, each scored 0–100. Each bar is that input's sub-score; the figure is the points it added to the 100-point composite (weight × sub-score).
- Cash flow +30.0/30.0
- DSCR +10.0/10.0
- 1% rule +9.1/10.0
- ARV discount +7.5/15.0
- Schools +5.0/10.0
- Rent growth +4.1/5.0
- Condition / age +4.0/5.0
- Livability +3.3/5.0
- Appreciation +0.0/10.0
$129,995
🖨 Deal sheet 📄 Offer letter ✓ Due diligence
Listing remarks MLS
Resolution X: Peaceful Retirement Living at Country Estates Discover the perfect retirement haven in the Resolution X. This thoughtfully designed home offers a serene and comfortable living space, ideal for enjoying your golden years. Relax in the spacious living area, surrounded by the tranquility of Country Estates. Resolution X Features: Spacious open floor plan for comfortable living Eco-friendly construction with Clayton's eBuilt system Ideal for retirees seeking a peaceful lifestyle 10×10 storage shed for extra space 2-car carport for convenient parking Low-maintenance living at Country Estates Built with Clayton's innovative eBuilt system, the Resolution X incorporates over 25 eco-friendly features without compromising on comfort or style. Experience the benefits of reduced energy consumption and a smaller environmental footprint while enjoying your well-deserved retirement. Built with Clayton's innovative eBuilt system, the Resolution X incorporates over 25 eco-friendly features without compromising on comfort or style. Experience the benefits of reduced energy consumption and a smaller environmental footprint.
Key facts
- Listed 71 days
Neighborhood map
What this means for you Summary
Snapshot
- This is a 3-bed/2.0-bath manufactured listed at $130k. Condition is rated good.
Deal economics
- At list price, monthly cash flow is $548 ($7k/yr) — positive.
- The deal already cash-flows at list — no discount required.
- Meets the 1% rule at list price ($2k rent vs $130k).
- Recommended offer: $122k (6.0% below list) — sets the bar for market timing.
Location & tenants
- Location reads 66/100 on livability (#624 in TX) — a middle-class / working-renter tenant base. Strengths: cost of living A+, housing A+; Watch: amenities C-, schools D, crime F.
- Canyon ISD (town): math 60% / reading 54% proficiency, ranked #78 of 826 in TX (top 9%) — acceptable for families but not a draw, mixed tenant base, ~2y average lease.
- Market conditions: Rents rising fast (+6.2%/yr); 477 active listings in the ZIP; 5 comparable units currently listed for rent nearby; rentals at typical pace (median 21d on market — plan ~3-4 weeks tenant-placement turnaround); 40% of comp listings sitting > 30 days — soft ceiling on asking rent; high-income renter base; 45 units permitted in Randall County in 2024 (0 in 5+ unit buildings).
Forward outlook
- Local home prices are declining (-3.0%/yr); year-one equity from $899 of loan paydown is wiped out by about $4k of value loss. Plan a longer hold.
- Randall County population projected at +36% by 2050 — long-run rental-demand tailwind backs the buy-and-hold thesis.
- At projected returns (-3.0% appreciation + 6.2% rent growth), your $36k cash investment doubles in ~6 years — after that, you're playing with house money.
Negotiation context
- It's been on market 71 days — a 6% lower offer ($122k) is reasonable based on typical stale-listing flexibility.
Risks & watch-outs
- Climate carrying-cost: severe wildfire risk — expect insurance premiums to compound above CPI over the hold.
Questions for the listing agent
- It's been on market 71 days. Have you received any prior offers? Is the seller open to a 6% concession, seller financing, or rate buy-down credit?
- Why hasn't it sold? Are there any deal-killer items the seller is aware of (foundation, flood, title, zoning, code violations)?
- Is there a deadline driving the sale (1031 exchange, divorce, estate, relocation)? That informs how much negotiation room exists.
- Schools are D-rated, which usually means shorter tenancies and higher turnover. Who's the typical renter profile here, and what's been the actual vacancy rate?
- Crime grade is F in this area — have there been break-ins, vandalism, or insurance claims at this property in the last 3 years? What carrier currently insures it and at what premium?
- What's the average days-on-market for RENTAL listings here right now (not sales)? A rising rental-DOM trend means longer vacancies and softer asking-rent achievability than the comps imply.
- What's the recent tenant-quality profile in this submarket — average credit score on applications, eviction rate, late-payment / NSF rate, and stable-employment percentage? A property-management company in the area should have these aggregated.
- How much new for-sale + rental construction is in the pipeline within 1–3 miles? Heavy new supply typically softens prices + rents 12–24 months out; constrained supply supports both.
Investment metrics
- 1% rule
- 1.41% ✓
- Cap rate
- 11.35%
- Cash-on-cash
- 18.06%
- DSCR
- 1.80
- GRM
- 5.9
CMA / ARV
No comps found within radius.
Projected returns pro-forma
-3.0% appreciation · 6.21% rent growth · sell at horizon
- IRR
- 13.2%
- Equity multiple
- 1.55×
- Total profit
- $19,950
- Equity at exit
- $19,383
- IRR
- 24.5%
- Equity multiple
- 3.45×
- Total profit
- $89,152
- Equity at exit
- $11,240
Cash invested: $36,399 (down + closing). Projections, not guarantees.
Landlord ↔ Tenant lean methodology
- Overall (STATE)
- 87 Strongly Landlord-Friendly
- State Texas
- 87 Strongly Landlord-Friendly · R+5
- County
- — inherits STATE
- City
- — inherits STATE
ZIP-level market 79119
- Home prices YoY
- -19.1%
- Rents YoY
- 6.2%
- Active inventory
- 477
- Price-to-rent
- 5.9×
Monthly cashflow live
- Estimated rent
- $1,830 high interval (Pro) →
- Mortgage (P&I)
- −$682
- Tax est. 1.5%
- −$162 /mo · $1,950/yr
- Insurance
- −$54
- HOA
- −$0
- Vacancy / Maint / Mgmt
- −$384
- Net cashflow
- $548
Break-even live
UW: 25.0% down · 7.5% · 30yr · 1.5% tax · 5.0% vac · 8.0% maint · 8.0% mgmt
Financing live
Cash to close
- Down payment
- $32,499
- Closing costs
- $3,900
- Reserves months
- —
- Total cash needed
- —
Loan-product check · same deal, 3 products live
Conventional
25% down · 7.5% · 30yr
- Down + closing
- —
- Monthly P&I
- —
- Monthly cashflow
- —
- DSCR
- —
- Eligible?
- —
Personal DTI + credit; lowest rate.
DSCR
20% down · 8.5% · 30yr
- Down + closing
- —
- Monthly P&I
- —
- Monthly cashflow
- —
- DSCR
- —
- Eligible?
- —
No personal income docs; deal must DSCR.
Hard money
10% down · 12.0% · 12mo
- Down + closing
- —
- Monthly P&I
- —
- Monthly cashflow
- —
- DSCR
- —
- Eligible?
- —
Short-term bridge; refi at stabilization.
Rent comps 5 comps
| Address | Beds | Baths | Sqft | Rent | $/sqft | DOM | Units | Dist |
|---|---|---|---|---|---|---|---|---|
| 7628 S Soncy Rd Amarillo, TX | 1.0–3.0 | 1.0–2.0 | 1105 | $1,750 | $1.58 | 13d | 3 | 0.76mi |
| 7628 S Soncy Rd Amarillo, TX | 2.0 | 2.0 | 1033 | $1,450 | $1.40 | 44d | 1 | 0.76mi |
| 7628 S Soncy Rd Amarillo, TX | 2.0 | 2.0 | 1033 | $1,500 | $1.45 | 21d | 1 | 0.76mi |
| 6801 Mosley St Amarillo, TX | 2.0 | 2.0 | 1497 | $1,725 | $1.15 | 44d | 1 | 1.02mi |
| 6300 Oakcrest Ln Amarillo, TX | 3.0 | 2.0 | 1400 | $1,825 | $1.30 | 13d | 2 | 1.32mi |
Listing history 17 events
-
2026-06-18days on market $129,995 Active 71 DOM
-
2026-06-17days on market $129,995 Active 70 DOM
-
2026-06-16days on market $129,995 Active 69 DOM
-
2026-06-15days on market $129,995 Active 68 DOM
-
2026-06-14days on market $129,995 Active 66 DOM
-
2026-06-13days on market $129,995 Active 65 DOM
-
2026-06-10days on market $129,995 Active 63 DOM
-
2026-06-09days on market $129,995 Active 62 DOM
-
2026-06-08days on market $129,995 Active 61 DOM
-
2026-06-07days on market $129,995 Active 60 DOM
-
2026-06-05pricedays on market $129,995 Active 57 DOM
-
2026-06-03days on market $123,995 Active 56 DOM
-
2026-06-02days on market $123,995 Active 55 DOM
-
2026-06-01days on market $123,995 Active 54 DOM
-
2026-05-31days on market $123,995 Active 53 DOM
-
2026-05-30days on market $123,995 Active 52 DOM
-
2026-04-08$123,995 Active 1143-char remark
Show marketing remark (1143 chars)
Resolution X: Peaceful Retirement Living at Country Estates Discover the perfect retirement haven in the Resolution X. This thoughtfully designed home offers a serene and comfortable living space, ideal for enjoying your golden years. Relax in the spacious living area, surrounded by the tranquility of Country Estates. Resolution X Features: Spacious open floor plan for comfortable living Eco-friendly construction with Clayton's eBuilt system Ideal for retirees seeking a peaceful lifestyle 10×10 storage shed for extra space 2-car carport for convenient parking Low-maintenance living at Country Estates Built with Clayton's innovative eBuilt system, the Resolution X incorporates over 25 eco-friendly features without compromising on comfort or style. Experience the benefits of reduced energy consumption and a smaller environmental footprint while enjoying your well-deserved retirement. Built with Clayton's innovative eBuilt system, the Resolution X incorporates over 25 eco-friendly features without compromising on comfort or style. Experience the benefits of reduced energy consumption and a smaller environmental footprint.
ⓘ Source: listings_history table (triggers on properties + properties_extension) + one-shot
backfill from property_details.listing_events for pre-trigger history.
Climate risk First Street
- Flood 1/10 Low FEMA zone X (unshaded) · 0% chance over 30 yrs
- Wildfire 8/10 Severe
- Heat 4/10 Moderate 7 d/yr ≥98°F today · 20 d/yr by 30 yrs out
- Wind 2/10 Low
- Air quality 2/10 Low 2 unhealthy d/yr today · 2 by 30 yrs out
Nearby sold comps map
Loading sold comps map…
Walkable amenities ~0.75 mi
Loading nearby amenities…
Taxation est. · year 1
- Rental income
- $21,966
- − Mortgage interest
- −$7,282
- − Property taxes
- −$1,950
- − Insurance
- −$650
- − Repairs & maintenance
- −$1,757
- − Management
- −$1,757
- − Depreciation
- −$3,782
- Taxable income
- $4,788
- Est. tax owed @ 24.0%
- −$1,149
- After-tax cash flow
- $5,424/yr
For passive investors: Depreciation is non-cash, so a rental often shows a tax loss while cash-flowing — sheltering income. Rental losses are passive: they offset passive income freely, and up to $25,000/yr can offset ordinary (W-2) income if you actively participate and your MAGI is under $100k (phasing out to $0 by $150k); unused losses carry forward. On sale, claimed depreciation is recaptured at up to 25%, and gains may owe capital-gains tax (a 1031 exchange can defer both). Figures are a year-1 estimate at your 24.0% rate — not tax advice; consult a CPA.
Condition & rehab AI · 12 photos
This manufactured home is in good condition with a modern and well-maintained interior and exterior. It is move-in ready and has the potential for minor improvements to further enhance its value.
Value-add opportunities
- Both Painting the exterior siding — Enhances curb appeal and can increase both resale and rental value.
- Both Landscaping improvements — Enhances curb appeal and can increase both resale and rental value.
- Both Adding a small outdoor seating area — Can increase both resale and rental value by adding more living space outdoors.
Renovation cost estimate screening
Value-add ROI direction
- Both Painting the exterior siding — Enhances curb appeal and can increase both resale and rental value. ↑
- Both Landscaping improvements — Enhances curb appeal and can increase both resale and rental value. ↑
- Both Adding a small outdoor seating area — Can increase both resale and rental value by adding more living space outdoors. ↑
ⓘ Cost ranges are severity-bucket heuristics (US national rule-of-thumb). Get contractor quotes + a written scope before underwriting a rehab budget.
Schools (NCES district)
- District
- Canyon ISD
- NCES district ID
- 4812810
- Math proficiency
- 60% ▼ -1.00%
- Reading proficiency
- 54% ▼ -1.00%
- Median HH income
- $65,177
- Composite
- 50.07/100
- National rank
- #1912
- State rank
- #78 of 826 in TX
Livability — Amarillo
- Score
- 66/100
- State rank
- #624
- US rank
- #11876
Category grades
Schools grade is shown separately in the Schools card above.
Census & demographics
- County
- Randall County · 137,351 people
- City population
- 185,802
- Metro
- Amarillo, TX
- Population (ZIP)
- 24,907
- Household income
- $114,432
- Rent vs Own
- Severe rent burden
- 272.0
Population outlook (Randall County) Hauer SSP2
- Today (2025)
- 152,140 people
- By 2030
- 163,107 · +7.2%
- By 2040
- 184,999 · +21.6%
- By 2050
- 206,948 · +36.0%
- By 2075
- 260,204 · +71.0%
- By 2100
- 294,980 · +93.9%
Race, ethnicity, and origin ACS 2023
- Neighborhood character
- Predominantly White (74%)
- Race & ethnicity
- White 74% Hispanic / Latino 17% Two or more races 8% Asian 4% Black 2%
- Hispanic origin (detail)
- Mexican 13%
- Common ancestry
- Italian 4% Slovak 2% Iranian 1%
- Foreign-born
- 6% · Canada, China, Vietnam
- Languages at home
- 90% English-only · Spanish 5% Chinese 1% Other Indo-European 1%
Political lean MEDSL · Randall
- 2024 margin
- Solid R (+60.4) · D 19.4% · R 79.8%
- 2008→2024 swing
- +2.3pp toward D · 2008: -62.7pp · 2024: -60.4pp
- All cycles
- 2024: R+60.4 2020: R+58.8 2016: R+65.1 2012: R+68.2 2008: R+62.7
Not yet ingested
- Civics
- —
Market trends
- HPI YoY
- ▼ -39.08%
- Current HPI
- 165.3226
- Rent YoY
- ▲ 6.21%
- Metro
- Amarillo, TX
- State GDP YoY
- ▲ 3.95%
- F500 in state
- 110
Industry mix (Fortune 500 HQ in TX)
| Industry | F500 HQs | Revenue |
|---|---|---|
| Energy | 16 | $1,198B |
|
||
| Technology | 5 | $198B |
|
||
| Engineering / Construction | 4 | $72B |
|
||
| Energy Services | 3 | $60B |
|
||
| Utilities | 3 | $41B |
|
||
| Healthcare | 2 | $330B |
|
||
Price history
1 event — show timeline
- 2026-04-08 Listed $123,995 Zillow
Cash-flow waterfall
monthlySold comps — $/sqft
last 12 mo · ≤1 miLoading sold comps…