 🌊 Lakefront
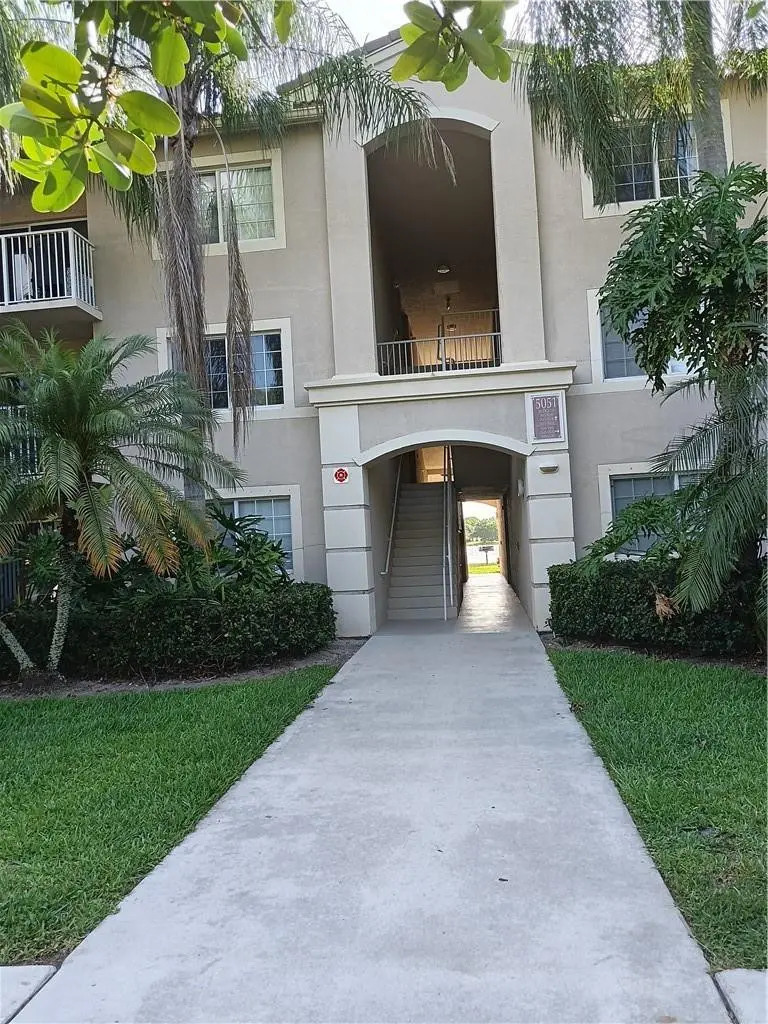
5051 Wiles Rd #202 · Coconut Creek, FL
Flood risk No data
- FEMA flood zone
- —
- Chance of flooding over 30 yrs
- —
- Est. flood insurance / yr
- —
Fire risk No data
- Est. fire insurance / yr
- —
Heat risk No data
- Hot days now (above threshold)
- —
- Hot days in 30 yrs
- —
Wind risk No data
- Chance of severe wind over 30 yrs
- —
Air-quality risk No data
- Unhealthy air days now
- —
- Unhealthy air days in 30 yrs
- —
Risk factors via First Street. Map © Google.
Why this score? — see what drove the D+ grade
The composite is a weighted blend of 9 inputs, each scored 0–100. Each bar is that input's sub-score; the figure is the points it added to the 100-point composite (weight × sub-score).
- Cash flow +13.0/30.0
- ARV discount +7.5/15.0
- 1% rule +6.1/10.0
- Appreciation +4.6/10.0
- Livability +4.2/5.0
- Schools +4.1/10.0
- DSCR +3.9/10.0
- Rent growth +2.9/5.0
- Condition / age +2.5/5.0
$229,000
🖨 Deal sheet 📄 Offer letter ✓ Due diligence
Listing remarks
This huge double master two bedroom two bath unit is located on the second floor in the Evergreen Lakes Condominiums. The unit has a walk in closets, full size washer and dryer and lake views. The community has a pool, tennis courts, exercise room and kids play area, assigned parking and many guest parking spots.
Key facts
- $400 HOA
- Garage
- Community pool
Neighborhood map
What this means for you Summary
Snapshot
- This is a 2-bed/2.0-bath condo listed at $229k.
Deal economics
- At list price, monthly cash flow is $-15 ($-175/yr) — negative.
- To cash-flow at today's rent, offer at most $226k (1.1% below list).
- Meets the 1% rule at list price ($3k rent vs $229k).
- Recommended offer: $226k (1.1% below list) — sets the bar for cash-flow.
- Cap rate 6.2% vs local median 3.7% in Coconut Creek — top-decile yield for the area; either an underpriced asset or a hidden risk that comps aren't pricing in. Stress-test before assuming the spread holds.
Location & tenants
- Location reads 85/100 on livability (#30 in FL, #617 nationally) — a professional / high-income tenant draw. Strengths: commute A+, housing A+, health & safety A+; Watch: amenities F.
- Broward (suburban): math 42% / reading 53% proficiency, ranked #46 of 73 in FL (top 63%) — families likely to look elsewhere, expect single-tenant / working-renter base with shorter leases.
- Zoned schools: Winston Park Elementary School (math 52% / reading 57%, grade C, #892 of 2,144 statewide, top 44%, 1,033 students, 55% FRL); Lyons Creek Middle School (math 49% / reading 53%, grade C, #237 of 571 statewide, top 43%, 1,757 students, 60% FRL); Monarch High School (math 26% / reading 50%, grade F, #328 of 667 statewide, top 50%, 2,344 students, 54% FRL).
- Market conditions: Rents rising (+1.6%/yr); 150 active listings in the ZIP; 40 comparable units currently listed for rent nearby; rentals at typical pace (median 24d on market — plan ~3-4 weeks tenant-placement turnaround); solid renter incomes; 2,111 units permitted in Broward County in 2024 (1,265 in 5+ unit buildings).
- This rent runs 31% of the median local income ($97k/yr) — at the standard rent-burdened threshold; future hikes will face affordability resistance.
Forward outlook
- Local home prices are declining (-0.8%/yr); year-one equity from $2k of loan paydown is wiped out by about $2k of value loss. Plan a longer hold.
- Broward County population projected at +34% by 2050 — long-run rental-demand tailwind backs the buy-and-hold thesis.
Negotiation context
- Only 0 days on market — expect competitive offers; lowballing is unlikely to land.
Questions for the listing agent
- What do current leases actually rent for vs. the listed asking? Can we see a recent rent roll and the last 12 months of T-12 income?
- What does the HOA fee cover, when was the last increase, and are there any pending special assessments or reserve-fund shortfalls?
- Any open or pending special assessments — roof, HVAC, plumbing, elevator, façade? What's the per-unit balance and payoff schedule, and is the seller paying it off at close or rolling it to the buyer?
- Is there a deadline driving the sale (1031 exchange, divorce, estate, relocation)? That informs how much negotiation room exists.
- Schools are B-rated — typically a magnet for longer-tenancy family renters. What's the average tenant stay here, and is there a school-zone premium baked into asking?
- The area grade is low — what's the realistic commute time and amenity access for the typical tenant pool here? Any planned neighborhood developments (good or bad) we should know about?
- This sits on a lake — are riparian / water-frontage rights deeded with the parcel? Any dock permits, shoreline easements, or HOA water-use restrictions?
- What's the documented flood / surge / shoreline-erosion history here (FEMA AND non-FEMA — e.g., storm surge, creek backup, septic-field saturation)?
- Any water-quality or seasonal algae-bloom issues that affect tenant satisfaction or short-term-rental demand?
- What's the average days-on-market for RENTAL listings here right now (not sales)? A rising rental-DOM trend means longer vacancies and softer asking-rent achievability than the comps imply.
- What's the recent tenant-quality profile in this submarket — average credit score on applications, eviction rate, late-payment / NSF rate, and stable-employment percentage? A property-management company in the area should have these aggregated.
- How much new apartment / multifamily construction is in the pipeline within 1–3 miles? Heavy new supply (>2% of stock underway) typically softens rents 12–24 months out; light construction supports rent growth.
Investment metrics
- 1% rule
- 1.11% ✓
- Cap rate
- 6.22%
- Cash-on-cash
- -0.27%
- DSCR
- 0.99
- GRM
- 7.5
CMA / ARV
No comps found within radius.
Projected returns pro-forma
-0.77% appreciation · 1.64% rent growth · sell at horizon
- IRR
- -6.7%
- Equity multiple
- 0.71×
- Total profit
- $-18,909
- Equity at exit
- $57,804
- IRR
- -1.5%
- Equity multiple
- 0.86×
- Total profit
- $-8,943
- Equity at exit
- $62,878
Cash invested: $64,120 (down + closing). Projections, not guarantees.
Landlord ↔ Tenant lean methodology
- Overall (STATE)
- 87 Strongly Landlord-Friendly
- State Florida
- 87 Strongly Landlord-Friendly · R+3
- County
- — inherits STATE
- City
- — inherits STATE
ZIP-level market 33073
- Home prices YoY
- -0.2%
- Rents YoY
- 1.6%
- Active inventory
- 150
- Price-to-rent
- 7.5×
Monthly cashflow live
- Estimated rent
- $2,531 high interval (Pro) →
- Mortgage (P&I)
- −$1,201
- Tax from tax record
- −$318 /mo · $3,812/yr
- Insurance
- −$95
- HOA
- −$400
- Vacancy / Maint / Mgmt
- −$531
- Net cashflow
- $-15
Break-even live
UW: 25.0% down · 7.5% · 30yr · 1.5% tax · 5.0% vac · 8.0% maint · 8.0% mgmt
Financing live
Cash to close
- Down payment
- $57,250
- Closing costs
- $6,870
- Reserves months
- —
- Total cash needed
- —
Loan-product check · same deal, 3 products live
Conventional
25% down · 7.5% · 30yr
- Down + closing
- —
- Monthly P&I
- —
- Monthly cashflow
- —
- DSCR
- —
- Eligible?
- —
Personal DTI + credit; lowest rate.
DSCR
20% down · 8.5% · 30yr
- Down + closing
- —
- Monthly P&I
- —
- Monthly cashflow
- —
- DSCR
- —
- Eligible?
- —
No personal income docs; deal must DSCR.
Hard money
10% down · 12.0% · 12mo
- Down + closing
- —
- Monthly P&I
- —
- Monthly cashflow
- —
- DSCR
- —
- Eligible?
- —
Short-term bridge; refi at stabilization.
Rent comps 40 comps
| Address | Beds | Baths | Sqft | Rent | $/sqft | DOM | Units | Dist |
|---|---|---|---|---|---|---|---|---|
| 5051 Wiles Rd #201 Coconut Creek, FL | 2.0 | 2.0 | 1246 | $2,300 | $1.85 | 24d | 1 | 0.01mi |
| 5045 Wiles Rd Coconut Creek, FL | 2.0 | 2.0 | 1246 | $2,225 | $1.79 | 10d | 2 | 0.05mi |
| 5045 Wiles Rd Coconut Creek, FL | 2.0 | 2.0 | 1246 | $2,312 | $1.86 | 24d | 2 | 0.05mi |
| 4720 Mimosa Pl #905 Coconut Creek, FL | 2.0 | 2.0 | 1188 | $3,800 | $3.20 | 24d | 1 | 0.05mi |
| 5061 Wiles Rd #102 Coconut Creek, FL | 2.0 | 2.0 | 1246 | $2,250 | $1.81 | 24d | 1 | 0.07mi |
| 5065 Wiles Rd Coconut Creek, FL | 3.0 | 2.0 | 1328 | $2,512 | $1.89 | 7d | 3 | 0.11mi |
| 4501 Mimosa Ter Coconut Creek, FL | 3.0 | 2.5 | 1434 | $3,250 | $2.27 | 24d | 2 | 0.12mi |
| 5001 Wiles Rd #105 Coconut Creek, FL | 1.0 | 1.0 | 778 | $1,800 | $2.31 | 18d | 1 | 0.19mi |
| 5025 Wiles Rd #105 Coconut Creek, FL | 3.0 | 2.0 | 1299 | $2,500 | $1.92 | 19d | 1 | 0.19mi |
| 5011 Wiles Rd Coconut Creek, FL | 2.0 | 2.0 | 1246 | $2,250 | $1.81 | 24d | 2 | 0.20mi |
| 5011 Wiles Rd Coconut Creek, FL | 2.0 | 2.0 | 1246 | $2,375 | $1.91 | 21d | 2 | 0.20mi |
| 5005 Wiles Rd #104 Coconut Creek, FL | 3.0 | 2.0 | 1299 | $2,750 | $2.12 | 24d | 1 | 0.22mi |
| 5005 Wiles Rd #108 Coconut Creek, FL | 3.0 | 2.0 | 1357 | $3,000 | $2.21 | 7d | 1 | 0.22mi |
| 4680 Mimosa Pl Coconut Creek, FL | 2.0 | 2.0 | 1240 | $2,800 | $2.26 | 24d | 1 | 0.23mi |
| 5401 Wiles Rd Coconut Creek, FL | 1.0–3.0 | 1.0–2.0 | 1078 | $2,930 | $2.72 | 2d | 1 | 0.46mi |
| 4840 N State Road 7 #6101 Coconut Creek, FL | 1.0 | 1.0 | 703 | $1,700 | $2.42 | 24d | 1 | 0.53mi |
| 4828 N State Road 7 #8205 Coconut Creek, FL | 2.0 | 2.0 | 967 | $2,250 | $2.33 | 24d | 1 | 0.54mi |
| 4828 N State Road 7 #8306 Coconut Creek, FL | 2.0 | 2.0 | 967 | $2,200 | $2.28 | 5d | 1 | 0.54mi |
| 4836 N State Road 7 #5207 Coconut Creek, FL | 1.0 | 1.0 | 703 | $1,800 | $2.56 | 24d | 1 | 0.58mi |
| 4812 N State Road 7 #12202 Coconut Creek, FL | 1.0 | 1.0 | 703 | $1,700 | $2.42 | 7d | 1 | 0.63mi |
| 4856 N State Road 7 #1207 Coconut Creek, FL | 2.0 | 2.0 | 967 | $2,350 | $2.43 | 24d | 1 | 0.63mi |
| 4856 N State Road 7 #1303 Coconut Creek, FL | 2.0 | 2.0 | 967 | $2,295 | $2.37 | 24d | 1 | 0.63mi |
| 4856 N State Road 7 Coconut Creek, FL | 2.0 | 2.5 | 967 | $2,250 | $2.33 | 24d | 1 | 0.68mi |
| 5400 Lyons Rd Coconut Creek, FL | 1.0–3.0 | 1.0–2.0 | 1072 | $2,384 | $2.22 | 2d | 47 | 0.76mi |
| 3848 Lyons Rd Unit 205-1 Coconut Creek, FL | 2.0 | 2.0 | 1112 | $2,175 | $1.96 | 24d | 1 | 0.77mi |
| 3854 Lyons Rd Unit 201-5 Coconut Creek, FL | 3.0 | 2.0 | 1258 | $2,600 | $2.07 | 24d | 1 | 0.79mi |
| 5400 NW 55th Blvd Coconut Creek, FL | 3.0 | 2.0 | 1425 | $2,586 | $1.81 | 7d | 1 | 0.82mi |
| 5400 NW 55th Blvd Coconut Creek, FL | 1.0 | 1.0 | 1057 | $2,102 | $1.99 | 21d | 1 | 0.82mi |
| 5400 NW 55th Blvd Coconut Creek, FL | 2.0 | 2.0 | 1424 | $2,545 | $1.79 | 24d | 1 | 0.82mi |
| 5400 NW 55th Blvd Coconut Creek, FL | 1.0 | 1.0 | 1057 | $2,120 | $2.01 | 3d | 1 | 0.82mi |
| 4901 W Sample Rd Coconut Creek, FL | 3.0 | 2.0 | 1352 | $3,227 | $2.39 | 7d | 1 | 0.82mi |
| 4901 W Sample Rd Coconut Creek, FL | 3.0 | 2.0 | 1352 | $3,263 | $2.41 | 15d | 1 | 0.82mi |
| 3830 Lyons Rd Unit 301-3 Coconut Creek, FL | 3.0 | 2.0 | 1258 | $2,395 | $1.90 | 24d | 1 | 0.84mi |
| 3830 Lyons Rd Unit 110-3 Coconut Creek, FL | 1.0 | 1.0 | 798 | $1,675 | $2.10 | 24d | 1 | 0.84mi |
| 3870 Lyons Rd Unit 209-8 Coconut Creek, FL | 2.0 | 2.0 | 1112 | $2,175 | $1.96 | 24d | 1 | 0.89mi |
| 4814 NW 58th Mnr Coconut Creek, FL | 2.0 | 2.5 | 1407 | $2,600 | $1.85 | 16d | 1 | 0.97mi |
| 4814 NW 58th Mnr Coconut Creek, FL | 2.0 | 2.5 | 1407 | $2,500 | $1.78 | 5d | 1 | 0.97mi |
| 5590 NW 61st St #832 Coconut Creek, FL | 1.0 | 1.0 | 846 | $1,700 | $2.01 | 20d | 1 | 0.99mi |
| 5580 NW 61st St #627 Coconut Creek, FL | 1.0 | 1.0 | 846 | $1,700 | $2.01 | 20d | 1 | 1.01mi |
| 4854 Fishermans Dr Coconut Creek, FL | 1.0–2.0 | 1.0–2.0 | 800 | $2,400 | $3.00 | 1d | 13 | 1.02mi |
HOA detail condo
- Monthly dues
- $400 · $4,800/yr
- Likely covers
- poolparking
- Assessments
- None detected in remarks — confirm with the listing agent.
Listing history 3 events
-
2021-07-28soldstatus $235,000
-
2021-06-22historical
-
2021-06-18$229,000
ⓘ Source: listings_history table (triggers on properties + properties_extension) + one-shot
backfill from property_details.listing_events for pre-trigger history.
Tax reassessment forecast FL · Resets to sale price
- Current annual tax
- $3,812 · $318/mo
- Projected year-2 tax
- $3,812 · $318/mo
- Expected delta
- $0/yr ($0/mo · 0.0%)
ⓘ Screening estimate from a state-policy table — verify with the county assessor before closing.
Nearby sold comps map
Loading sold comps map…
Walkable amenities ~0.75 mi
Loading nearby amenities…
Taxation est. · year 1
- Rental income
- $30,371
- − Mortgage interest
- −$12,828
- − Property taxes
- −$3,812
- − Insurance
- −$1,145
- − Repairs & maintenance
- −$2,430
- − Management
- −$2,430
- − HOA
- −$4,800
- − Depreciation
- −$6,662
- Taxable loss
- −$3,735
- Est. tax savings @ 24.0%
- +$896
- After-tax cash flow
- $722/yr
For passive investors: Depreciation is non-cash, so a rental often shows a tax loss while cash-flowing — sheltering income. Rental losses are passive: they offset passive income freely, and up to $25,000/yr can offset ordinary (W-2) income if you actively participate and your MAGI is under $100k (phasing out to $0 by $150k); unused losses carry forward. On sale, claimed depreciation is recaptured at up to 25%, and gains may owe capital-gains tax (a 1031 exchange can defer both). Figures are a year-1 estimate at your 24.0% rate — not tax advice; consult a CPA.
Schools (NCES district)
- District
- Broward
- NCES district ID
- 1200180
- Math proficiency
- 42% ▼ -18.00%
- Reading proficiency
- 53% ▼ -5.00%
- Median HH income
- $52,139
- Composite
- 40.88/100
- National rank
- #3621
- State rank
- #46 of 73 in FL
Livability — Coconut Creek
- Score
- 85/100
- State rank
- #30
- US rank
- #617
Category grades
Schools grade is shown separately in the Schools card above.
Census & demographics
- Census place
- Coconut Creek, FL
- County
- Broward County · 1,963,430 people
- City population
- 50,557
- Metro
- Miami-Fort Lauderdale-Pompano Beach, FL
- Population (ZIP)
- 33,838
- Household income
- $97,412
- Rent vs Own
- Severe rent burden
- 1109.0
Population outlook (Broward County) Hauer SSP2
- Today (2025)
- 2,207,033 people
- By 2030
- 2,360,704 · +7.0%
- By 2040
- 2,661,208 · +20.6%
- By 2050
- 2,946,698 · +33.5%
- By 2075
- 3,602,273 · +63.2%
- By 2100
- 3,970,984 · +79.9%
Race, ethnicity, and origin ACS 2023
- Neighborhood character
- Highly diverse neighborhood (Simpson 0.70)
- Race & ethnicity
- White 43% Hispanic / Latino 28% Two or more races 18% Black 17% Asian 3%
- Hispanic origin (detail)
- Mexican 2% Puerto Rican 4% Cuban 4% Dominican 2%
- Common ancestry
- Estonian 6% Hispanic 3% Romanian 2%
- Foreign-born
- 35% · Canada, Jamaica, China
- Languages at home
- 58% English-only · Spanish 23% Other Indo-European 11% French/Haitian/Cajun 4%
Political lean MEDSL · Broward
- 2024 margin
- D (+17.0) · D 58.0% · R 41.0%
- 2008→2024 swing
- -17.8pp toward R · 2008: 34.7pp · 2024: 17.0pp
- All cycles
- 2024: D+17.0 2020: D+29.8 2016: D+35.0 2012: D+34.9 2008: D+34.7
Not yet ingested
- Civics
- —
Market trends
- HPI YoY
- ▼ -0.77%
- Current HPI
- 337.0725
- Rent YoY
- ▲ 1.64%
- Metro
- Miami-Fort Lauderdale-Pompano Beach, FL
- State GDP YoY
- ▲ 3.28%
- F500 in state
- 36
Industry mix (Fortune 500 HQ in FL)
| Industry | F500 HQs | Revenue |
|---|---|---|
| Industrial Technology | 2 | $29B |
|
||
| Insurance | 2 | $17B |
|
||
| Retail | 1 | $60B |
|
||
| Technology Distribution | 1 | $58B |
|
||
| Homebuilding | 1 | $35B |
|
||
| Technology Manufacturing | 1 | $35B |
|
||
Price history
+2.6% since first listed3 events — show timeline
- 2021-07-28 Sold (Public Records) $235,000 Public Records
- 2021-06-22 Listing Removed — Beaches MLS
- 2021-06-18 Listed $229,000 Beaches MLS
Property tax history
+5.2%/yrLatest (2025): $3,812 · +3.6% YoY. Source: county tax records.
Cash-flow waterfall
monthlySold comps — $/sqft
last 12 mo · ≤1 miLoading sold comps…