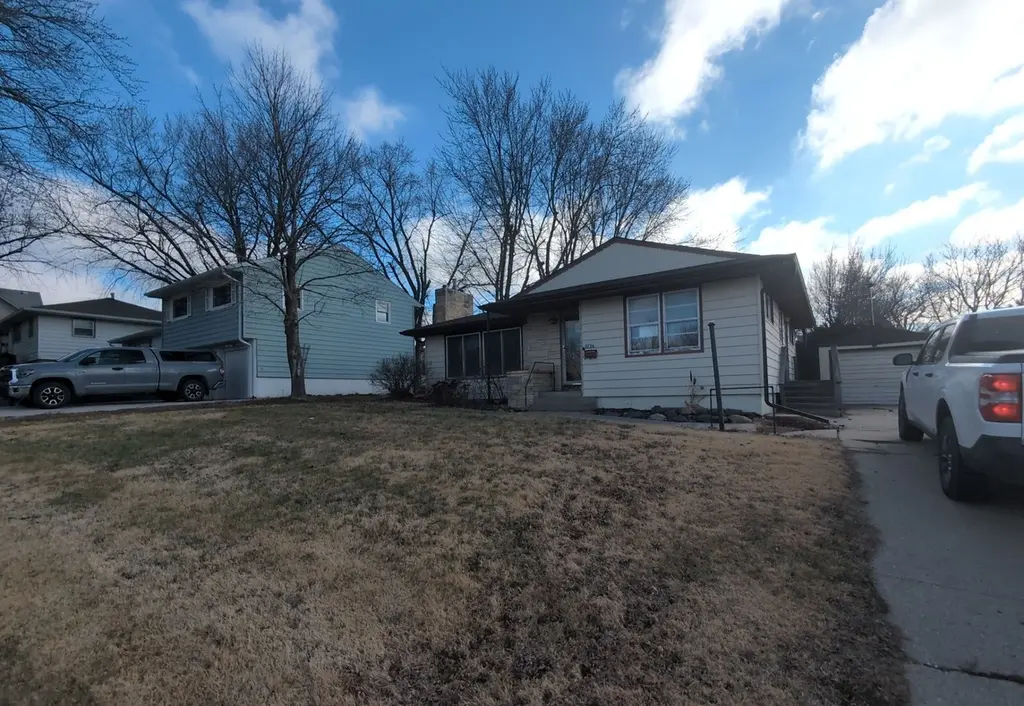
1726 Salinger Ave · Carroll, IA
Flood risk 1/10 · Minimal
- FEMA flood zone
- X (unshaded)
- Chance of flooding over 30 yrs
- 0.0%
- Est. flood insurance / yr
- $473 – $860
Fire risk 2/10 · Minimal
- Est. fire insurance / yr
- $902 – $1,676
Heat risk 2/10 · Minimal
- Hot days now (above 101°F)
- 7 days/yr
- Hot days in 30 yrs
- 15 days/yr
Wind risk 2/10 · Minimal
- Chance of severe wind over 30 yrs
- —
Air-quality risk 1/10 · Minimal
- Unhealthy air days now
- 0 days/yr
- Unhealthy air days in 30 yrs
- 0 days/yr
Risk factors via First Street. Map © Google.
Why this score? — see what drove the B grade
The composite is a weighted blend of 9 inputs, each scored 0–100. Each bar is that input's sub-score; the figure is the points it added to the 100-point composite (weight × sub-score).
- Cash flow +26.8/30.0
- ARV discount +15.0/15.0
- DSCR +9.2/10.0
- 1% rule +7.3/10.0
- Schools +6.1/10.0
- Livability +4.1/5.0
- Rent growth +2.5/5.0
- Condition / age +2.5/5.0
- Appreciation +0.0/10.0
$98,260
🖨 Deal sheet 📄 Offer letter ✓ Due diligence
Listing remarks MLS
Opportunity awaits with this ranch-style home ready for your personal touch. Featuring 3 bedrooms and 1 bathroom, this property offers separate living and dining areas, an unfinished basement with great potential, and a 1-car detached garage. Enjoy a spacious yard—perfect for outdoor living or future improvements. Ideal for investors or buyers looking to build equity! Carroll Community is the school district.
Key facts
- Spacious yard
- Unfinished basement
- Ranch-style home
Tags
Neighborhood map
What this means for you Summary
Snapshot
- This is a 3-bed/1.0-bath single-family listed at $98k.
Deal economics
- At list price, monthly cash flow is $270 ($3k/yr) — positive.
- The deal already cash-flows at list — no discount required.
- Meets the 1% rule at list price ($1k rent vs $98k).
- Recommended offer: $92k (6.0% below list) — sets the bar for market timing.
- Cap rate 9.6% vs local median 3.2% in Carroll — top-decile yield for the area; either an underpriced asset or a hidden risk that comps aren't pricing in. Stress-test before assuming the spread holds.
Location & tenants
- Location reads 82/100 on livability (#54 in IA, #1,282 nationally) — a professional / high-income tenant draw. Strengths: crime A+, cost of living A+, housing A+; Watch: amenities D+, commute F.
- Carroll Community School District (town): math 72% / reading 72% proficiency, ranked #113 of 289 in IA (top 39%) — strong family-tenant draw, lease renewals of 3-5y typical.
- Market conditions: 92 active listings in the ZIP; 32 units permitted in Carroll County in 2024 (0 in 5+ unit buildings).
Forward outlook
- Local home prices are declining (-3.0%/yr); year-one equity from $679 of loan paydown is wiped out by about $3k of value loss. Plan a longer hold.
- Carroll County population projected at -13% by 2050 — secular population decline; favor cash flow + early exit over multi-decade hold.
- At projected returns (-3.0% appreciation + 3.0% rent growth), your $28k cash investment doubles in ~10 years — after that, you're playing with house money.
Negotiation context
- It's been on market 64 days — a 6% lower offer ($92k) is reasonable based on typical stale-listing flexibility.
Risks & watch-outs
- Watch-outs: built in 1955 — expect roof / HVAC / electrical / plumbing capex.
Questions for the listing agent
- It's been on market 64 days. Have you received any prior offers? Is the seller open to a 6% concession, seller financing, or rate buy-down credit?
- Built in 1955 — when were the roof, HVAC, electrical panel, plumbing, and water heater last replaced?
- Why hasn't it sold? Are there any deal-killer items the seller is aware of (foundation, flood, title, zoning, code violations)?
- Is there a deadline driving the sale (1031 exchange, divorce, estate, relocation)? That informs how much negotiation room exists.
- Schools are A-rated — typically a magnet for longer-tenancy family renters. What's the average tenant stay here, and is there a school-zone premium baked into asking?
- What's the average days-on-market for RENTAL listings here right now (not sales)? A rising rental-DOM trend means longer vacancies and softer asking-rent achievability than the comps imply.
- What's the recent tenant-quality profile in this submarket — average credit score on applications, eviction rate, late-payment / NSF rate, and stable-employment percentage? A property-management company in the area should have these aggregated.
- How much new for-sale + rental construction is in the pipeline within 1–3 miles? Heavy new supply typically softens prices + rents 12–24 months out; constrained supply supports both.
Investment metrics
- 1% rule
- 1.23% ✓
- Cap rate
- 9.59%
- Cash-on-cash
- 11.77%
- DSCR
- 1.52
- GRM
- 6.8
CMA / ARV
- ARV (median comp)
- $177,034
- List price
- $98,260
- Delta
- -44.50%
- Verdict
- UNDERPRICED
- Comps
- 20 within 1.0 mi
Show comp detail 12 sales within ~0.75 mi
| Address | Dist | Beds/Ba | Sqft | Sold | Price | $/sf | Match |
|---|---|---|---|---|---|---|---|
| 1608 Salinger Ave | 0.10mi | 3/2.0 | 1,744 (+7%) | 2mo | $155,000 | $89 | 79 |
| 527 17th St | 0.19mi | 4/2.5 (+1) | 1,549 (-5%) | 1mo | $228,000 | $147 | 70 |
| 916 W 21st St | 0.32mi | 3/2.0 | 1,528 (-7%) | 3mo | $214,900 | $141 | 68 |
| 711 W 21st St | 0.28mi | 4/3.0 (+1) | 1,701 (+4%) | 2mo | $223,750 | $132 | 66 |
| 906 W 15th St | 0.19mi | 3/2.0 | 1,870 (+14%) | 8mo | $238,750 | $128 | 57 |
| 304 W Randall Rd | 0.51mi | 3/2.5 | 1,824 (+12%) | 1mo | $285,000 | $156 | 50 |
| 611 W 21st St | 0.29mi | 4/3.0 (+1) | 1,400 (-14%) | 3mo | $290,000 | $207 | 47 |
| 436 W 21st St | 0.38mi | 4/3.0 (+1) | 1,472 (-10%) | 8mo | $255,000 | $173 | 46 |
| 1408 N Adams St | 0.53mi | 4/1.0 (+1) | 1,430 (-13%) | 7mo | $150,000 | $105 | 43 |
| 219 Windwood Dr | 0.50mi | 4/2.5 (+1) | 1,851 (+13%) | 4mo | $305,000 | $165 | 40 |
| 1601 N Main St | 0.54mi | 4/2.0 (+1) | 1,872 (+14%) | 2mo | $220,000 | $118 | 40 |
| 2007 N Main St | 0.59mi | 4/2.0 (+1) | 1,392 (-15%) | 3mo | $279,000 | $200 | 36 |
Match score weights: distance 35% · size 25% · config 20% · recency 20%. Top-matched comps best support the ARV.
Projected returns pro-forma
-3.0% appreciation · 3.0% rent growth · sell at horizon
- IRR
- 1.2%
- Equity multiple
- 1.05×
- Total profit
- $1,284
- Equity at exit
- $14,651
- IRR
- 10.9%
- Equity multiple
- 1.85×
- Total profit
- $23,332
- Equity at exit
- $8,496
Cash invested: $27,513 (down + closing). Projections, not guarantees.
Landlord ↔ Tenant lean methodology
- Overall (STATE)
- 83 Strongly Landlord-Friendly
- State Iowa
- 83 Strongly Landlord-Friendly · R+6
- County
- — inherits STATE
- City
- — inherits STATE
ZIP-level market 51401
- Home prices YoY
- -22.3%
- Active inventory
- 92
- Price-to-rent
- 6.8×
Monthly cashflow live
- Estimated rent
- $1,207 medium interval (Pro) →
- Mortgage (P&I)
- −$515
- Tax from tax record
- −$128 /mo · $1,532/yr
- Insurance
- −$41
- HOA
- −$0
- Vacancy / Maint / Mgmt
- −$254
- Net cashflow
- $270
Break-even live
UW: 25.0% down · 7.5% · 30yr · 1.5% tax · 5.0% vac · 8.0% maint · 8.0% mgmt
Financing live
Cash to close
- Down payment
- $24,565
- Closing costs
- $2,948
- Reserves months
- —
- Total cash needed
- —
Loan-product check · same deal, 3 products live
Conventional
25% down · 7.5% · 30yr
- Down + closing
- —
- Monthly P&I
- —
- Monthly cashflow
- —
- DSCR
- —
- Eligible?
- —
Personal DTI + credit; lowest rate.
DSCR
20% down · 8.5% · 30yr
- Down + closing
- —
- Monthly P&I
- —
- Monthly cashflow
- —
- DSCR
- —
- Eligible?
- —
No personal income docs; deal must DSCR.
Hard money
10% down · 12.0% · 12mo
- Down + closing
- —
- Monthly P&I
- —
- Monthly cashflow
- —
- DSCR
- —
- Eligible?
- —
Short-term bridge; refi at stabilization.
Listing history 2 events
-
2026-05-08price $115,600 418-char remark
Show marketing remark (418 chars)
Opportunity awaits with this ranch-style home ready for your personal touch. Featuring 3 bedrooms and 1 bathroom, this property offers separate living and dining areas, an unfinished basement with great potential, and a 1-car detached garage. Enjoy a spacious yard—perfect for outdoor living or future improvements. Ideal for investors or buyers looking to build equity! Carroll Community is the school district.
-
2026-03-23$136,000 Active 418-char remark
Show marketing remark (418 chars)
Opportunity awaits with this ranch-style home ready for your personal touch. Featuring 3 bedrooms and 1 bathroom, this property offers separate living and dining areas, an unfinished basement with great potential, and a 1-car detached garage. Enjoy a spacious yard—perfect for outdoor living or future improvements. Ideal for investors or buyers looking to build equity! Carroll Community is the school district.
ⓘ Source: listings_history table (triggers on properties + properties_extension) + one-shot
backfill from property_details.listing_events for pre-trigger history.
Tax reassessment forecast IA · Partial reset (capped growth)
- Current annual tax
- $1,532 · $128/mo
- Projected year-2 tax
- $1,537 · $128/mo
- Expected delta
- +$5/yr ($0/mo · 0.3%)
ⓘ Screening estimate from a state-policy table — verify with the county assessor before closing.
Climate risk First Street
- Flood 1/10 Low FEMA zone X (unshaded) · 0% chance over 30 yrs
- Wildfire 2/10 Low
- Heat 2/10 Low 7 d/yr ≥101°F today · 15 d/yr by 30 yrs out
- Wind 2/10 Low
- Air quality 1/10 Low 0 unhealthy d/yr today · 0 by 30 yrs out
Nearby sold comps map
Loading sold comps map…
Walkable amenities ~0.75 mi
Loading nearby amenities…
Taxation est. · year 1
- Rental income
- $14,487
- − Mortgage interest
- −$5,504
- − Property taxes
- −$1,532
- − Insurance
- −$491
- − Repairs & maintenance
- −$1,159
- − Management
- −$1,159
- − Depreciation
- −$2,858
- Taxable income
- $1,783
- Est. tax owed @ 24.0%
- −$428
- After-tax cash flow
- $2,810/yr
For passive investors: Depreciation is non-cash, so a rental often shows a tax loss while cash-flowing — sheltering income. Rental losses are passive: they offset passive income freely, and up to $25,000/yr can offset ordinary (W-2) income if you actively participate and your MAGI is under $100k (phasing out to $0 by $150k); unused losses carry forward. On sale, claimed depreciation is recaptured at up to 25%, and gains may owe capital-gains tax (a 1031 exchange can defer both). Figures are a year-1 estimate at your 24.0% rate — not tax advice; consult a CPA.
Schools (NCES district)
- District
- Carroll Community School District
- NCES district ID
- 1906330
- Math proficiency
- 72% ▼ -6.00%
- Reading proficiency
- 72% ▲ 2.00%
- Median HH income
- $50,124
- Composite
- 61.04/100
- National rank
- #793
- State rank
- #113 of 289 in IA
Livability — Carroll
- Score
- 82/100
- State rank
- #54
- US rank
- #1282
Category grades
Schools grade is shown separately in the Schools card above.
Census & demographics
- Census place
- Carroll, IA
- City population
- 12,113
- Population (ZIP)
- 12,113
Population outlook (Carroll County) Hauer SSP2
- Today (2025)
- 19,745 people
- By 2030
- 19,244 · -2.5%
- By 2040
- 18,251 · -7.6%
- By 2050
- 17,223 · -12.8%
- By 2075
- 16,258 · -17.7%
- By 2100
- 15,591 · -21.0%
Race, ethnicity, and origin ACS 2023
- Neighborhood character
- Predominantly White (92%)
- Race & ethnicity
- White 92% Hispanic / Latino 4% Two or more races 3%
- Common ancestry
- Italian 2% Lithuanian 2% Iranian 1%
- Foreign-born
- 2% · Canada, South Korea
- Languages at home
- 98% English-only · Spanish 2%
Political lean MEDSL · Carroll
- 2024 margin
- Solid R (+41.9) · D 28.4% · R 70.3% · Other 1.4%
- 2008→2024 swing
- -45.6pp toward R · 2008: 3.6pp · 2024: -41.9pp
- All cycles
- 2024: R+41.9 2020: R+37.8 2016: R+31.8 2012: R+6.3 2008: D+3.6
Not yet ingested
- Civics
- —
Market trends
- HPI YoY
- ▼ -76.74%
- Current HPI
- 267.0068
- Rent YoY
- —
- Metro
- —
- State GDP YoY
- ▲ 2.48%
- F500 in state
- 4
Industry mix (Fortune 500 HQ in IA)
| Industry | F500 HQs | Revenue |
|---|---|---|
| Financial Services | 1 | $16B |
|
||
| Retail / Convenience | 1 | $15B |
|
||
Price history
-15.0% since first listed2 events — show timeline
- 2026-05-08 Price Changed $115,600 DMMLS
- 2026-03-23 Listed $136,000 DMMLS
Property tax history
+5.5%/yrLatest (2025): $1,532 · +10.9% YoY. Source: county tax records.
Cash-flow waterfall
monthlySold comps — $/sqft
last 12 mo · ≤1 miLoading sold comps…