 Duplex
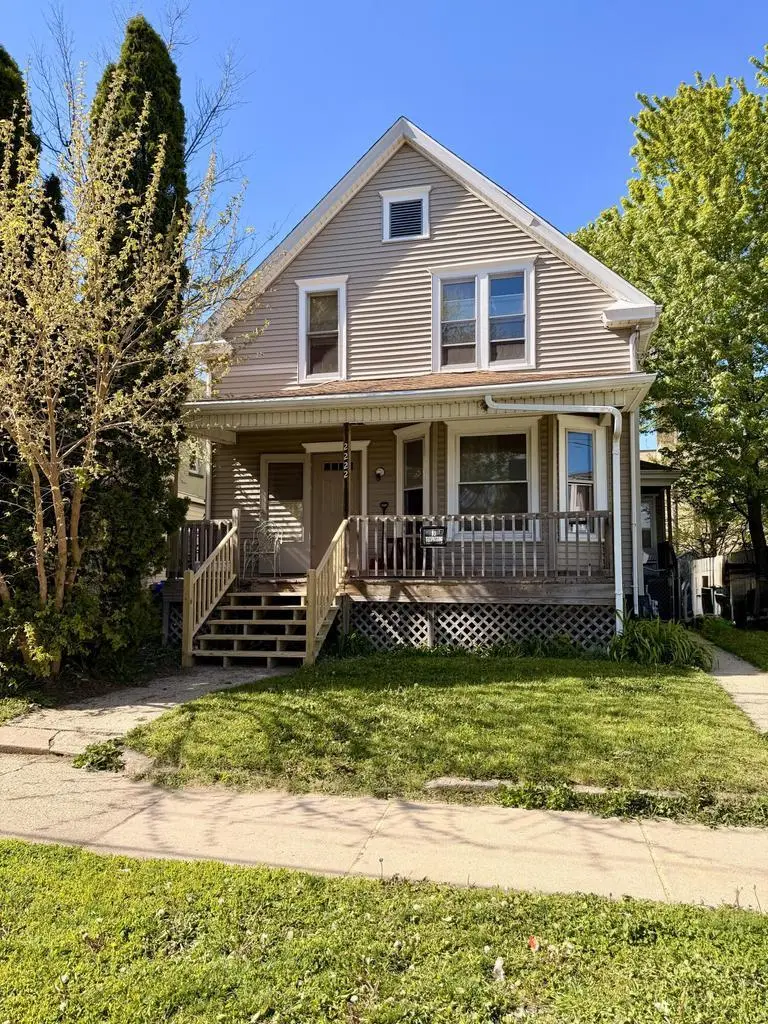
2222 53rd St · Kenosha, WI
Flood risk 1/10 · Minimal
- FEMA flood zone
- X (unshaded)
- Chance of flooding over 30 yrs
- 0.0%
- Est. flood insurance / yr
- $473 – $860
Fire risk 1/10 · Minimal
- Est. fire insurance / yr
- $636 – $1,182
Heat risk 2/10 · Minimal
- Hot days now (above 96°F)
- 7 days/yr
- Hot days in 30 yrs
- 14 days/yr
Wind risk 2/10 · Minimal
- Chance of severe wind over 30 yrs
- —
Air-quality risk 3/10 · Minor
- Unhealthy air days now
- 2 days/yr
- Unhealthy air days in 30 yrs
- 3 days/yr
Risk factors via First Street. Map © Google.
Why this score? — see what drove the C grade
The composite is a weighted blend of 9 inputs, each scored 0–100. Each bar is that input's sub-score; the figure is the points it added to the 100-point composite (weight × sub-score).
- Cash flow +27.5/30.0
- DSCR +9.6/10.0
- 1% rule +6.9/10.0
- Livability +4.2/5.0
- Rent growth +4.0/5.0
- Schools +2.5/10.0
- Condition / age +2.5/5.0
- ARV discount +0.0/15.0
- Appreciation +0.0/10.0
$225,000
🖨 Deal sheet 📄 Offer letter ✓ Due diligence
Multi-family units
County records classify this as Multi-Family (2-4 Unit). Listing-text estimate: 2 units. confirmed
Listing remarks MLS
This property could be your next investment and work for an owner/occupant or investor. Lots of perks with this property. New roof, newer windows, newer siding, new furnace, and detached garage for off street parking. Each unit is 2 bedrooms, 1 bathroom. Nice size kitchens and living areas. Also, each unit has it's own pantry for food. Also, nice size back yard that's fenced in. Could be great for family get togethers.
Key facts
- Fenced in backyard
- Full basement
- Roof replaced
Tags
Property features AI
Finance
- Other: Includes two oven/ranges and two refrigerators; tenants' personal property excluded
- Financial info: Property listed as a multi-family duplex with 2 units
Exterior
- Parking: Detached 1-car garage; Additional 1 parking space (total listed as 1 space)
- Utilities: Municipal water; Municipal sewer
- Home design: 2-story duplex; Multi-family property
- Construction: Assessor/public record year-built source (specific year not provided)
- Exterior features: Vinyl exterior; Lot less than 1/2 acre (approx. 0.11 acre); Zoned RES (residential)
Interior
- Kitchen: Unit 1: Kitchen included; Unit 2: Main level kitchen; Two oven/ranges and two refrigerators included
- Bedrooms: Unit 1: 2 bedrooms; Unit 2: 2 bedrooms (master on main level; second bedroom on main level)
- Bathrooms: Unit 1: 1 full bath; Unit 2: 1 full bath
- Interior features: Full basement; Vinyl exterior noted (referenced under exterior)
Neighborhood map
What this means for you Summary
Snapshot
- This is a 2 × 2-bed/1.0-bath units multifamily listed at $225k.
Deal economics
- At list price, monthly cash flow is $662 ($8k/yr) — positive. Per door: $331/mo.
- The deal already cash-flows at list — no discount required.
- Meets the 1% rule at list price ($3k rent vs $225k).
- Recommended offer: $218k (3.0% below list) — sets the bar for market timing.
- Cap rate 9.8% vs local median 4.0% in Kenosha — top-decile yield for the area; either an underpriced asset or a hidden risk that comps aren't pricing in. Stress-test before assuming the spread holds.
Location & tenants
- Location reads 84/100 on livability (#31 in WI, #680 nationally) — a professional / high-income tenant draw. Strengths: commute A+, cost of living A+, housing A+; Watch: employment C-, schools D+.
- Kenosha School District (suburban): math 26% / reading 31% proficiency, ranked #287 of 342 in WI (top 84%) — low school quality limits family demand, transient renter base, plan for 1-2y turnover.
- Market conditions: Rents rising fast (+6.0%/yr); 43 active listings in the ZIP; 7 comparable units currently listed for rent nearby; rentals at typical pace (median 22d on market — plan ~3-4 weeks tenant-placement turnaround); 43% of comp listings sitting > 30 days — soft ceiling on asking rent; 259 units permitted in Kenosha County in 2024 (8 in 5+ unit buildings).
- At $2,686/mo this rent would consume 56% of the median local household income ($58k/yr) (locally 1576% of renters already pay >50% of income on rent) — very limited rent-growth headroom before tenants either downsize or default.
Forward outlook
- Local home prices are declining (-3.0%/yr); year-one equity from $2k of loan paydown is wiped out by about $7k of value loss. Plan a longer hold.
- At projected returns (-3.0% appreciation + 6.0% rent growth), your $63k cash investment doubles in ~8 years — after that, you're playing with house money.
Negotiation context
- It's been on market 35 days — a 3% lower offer ($218k) is reasonable based on typical stale-listing flexibility.
- 2 sale attempts since 6y ago with the ask held roughly flat each time — persistent listings suggest the price (not the market) is what's stuck; bring a comps-based counter.
- Current owner paid $81k; list at $225k implies a 178% gain — meaningful room to come down on a strong offer.
Risks & watch-outs
- Watch-outs: built in 1908 — expect roof / HVAC / electrical / plumbing capex.
Questions for the listing agent
- It's been on market 35 days. Have you received any prior offers? Is the seller open to a 3% concession, seller financing, or rate buy-down credit?
- Can we see the unit-by-unit rent roll, current vacancy, and any below-market leases? What's the average tenancy length?
- What capital expenditures (roof, boiler, parking lot, exteriors) have been made in the last 5 years, and what's planned in the next 2?
- Built in 1908 — when were the roof, HVAC, electrical panel, plumbing, and water heater last replaced?
- Is there a deadline driving the sale (1031 exchange, divorce, estate, relocation)? That informs how much negotiation room exists.
- Schools are D-rated, which usually means shorter tenancies and higher turnover. Who's the typical renter profile here, and what's been the actual vacancy rate?
- What's the average days-on-market for RENTAL listings here right now (not sales)? A rising rental-DOM trend means longer vacancies and softer asking-rent achievability than the comps imply.
- What's the recent tenant-quality profile in this submarket — average credit score on applications, eviction rate, late-payment / NSF rate, and stable-employment percentage? A property-management company in the area should have these aggregated.
- How much new apartment / multifamily construction is in the pipeline within 1–3 miles? Heavy new supply (>2% of stock underway) typically softens rents 12–24 months out; light construction supports rent growth.
Investment metrics
- 1% rule
- 1.19% ✓
- Cap rate
- 9.82%
- Cash-on-cash
- 12.61%
- DSCR
- 1.56
- GRM
- 7.0
CMA / ARV
- ARV (median comp)
- $180,655
- List price
- $225,000
- Delta
- 24.55%
- Verdict
- OVERPRICED
- Comps
- 20 within 1.0 mi
Show comp detail 12 sales within ~0.75 mi
| Address | Dist | Beds/Ba | Sqft | Sold | Price | $/sf | Match |
|---|---|---|---|---|---|---|---|
| 5007 25th Ave | 0.26mi | 4/2.0 | 1,539 (-2%) | 2mo | $217,500 | $141 | 82 |
| 5428 25th Ave | 0.20mi | 4/2.0 | 1,668 (+6%) | 9mo | $150,000 | $90 | 73 |
| 4826 20th Ave | 0.36mi | 4/2.0 | 1,610 (+2%) | 8mo | $205,000 | $127 | 73 |
| 5011 22nd Ave | 0.23mi | 4/2.0 | 1,680 (+7%) | 12mo | $177,777 | $106 | 68 |
| 4413 19th Ave | 0.62mi | 3/2.0 (-1) | 1,628 (+4%) | 0mo | $178,000 | $109 | 60 |
| 5003 26th Ave #5005 | 0.30mi | 4/4.0 | 1,696 (+8%) | 8mo | $338,000 | $199 | 58 |
| 4508 25th Ave | 0.55mi | 4/2.0 | 1,459 (-7%) | 14mo | $175,000 | $120 | 50 |
| 1828 45th St | 0.59mi | 4/2.0 | 1,728 (+10%) | 7mo | $250,000 | $145 | 50 |
| 2014 45th St | 0.55mi | 4/2.0 | 1,728 (+10%) | 15mo | $235,500 | $136 | 45 |
| 5904 18th Ave | 0.49mi | 4/2.0 | 1,771 (+13%) | 13mo | $203,000 | $115 | 45 |
| 4202 21st Ave | 0.74mi | 3/2.0 (-1) | 1,412 (-10%) | 1mo | $219,900 | $156 | 43 |
| 1706 59th St | 0.50mi | 3/2.0 (-1) | 1,342 (-15%) | 18mo | $130,000 | $97 | 32 |
Match score weights: distance 35% · size 25% · config 20% · recency 20%. Top-matched comps best support the ARV.
Projected returns pro-forma
-3.0% appreciation · 5.98% rent growth · sell at horizon
- IRR
- 5.5%
- Equity multiple
- 1.22×
- Total profit
- $13,992
- Equity at exit
- $33,548
- IRR
- 17.4%
- Equity multiple
- 2.63×
- Total profit
- $102,600
- Equity at exit
- $19,454
Cash invested: $63,000 (down + closing). Projections, not guarantees.
Landlord ↔ Tenant lean methodology
- Overall (STATE)
- 73 Landlord-Friendly
- State Wisconsin
- 73 Landlord-Friendly · R+2
- County
- — inherits STATE
- City
- — inherits STATE
ZIP-level market 53140
- Rents YoY
- 6.0%
- Active inventory
- 43
- Price-to-rent
- 14.0×
Monthly cashflow live
- Estimated rent
- $2,686 high interval (Pro) →
- Mortgage (P&I)
- −$1,180
- Tax from tax record
- −$186 /mo · $2,233/yr
- Insurance
- −$94
- HOA
- −$0
- Vacancy / Maint / Mgmt
- −$564
- Net cashflow
- $662
Break-even live
2-unit breakdown (identical units grouped — click to expand)
| Units | Beds | Baths | Est. rent |
|---|---|---|---|
| 2× units | 2 | 1 | $2,686 |
| #1 | 2 | 1 | $1,343 |
| #2 | 2 | 1 | $1,343 |
| Total (2 units) | $2,686 | ||
UW: 25.0% down · 7.5% · 30yr · 1.5% tax · 5.0% vac · 8.0% maint · 8.0% mgmt
Financing live
Cash to close
- Down payment
- $56,250
- Closing costs
- $6,750
- Reserves months
- —
- Total cash needed
- —
Loan-product check · same deal, 3 products live
Conventional
25% down · 7.5% · 30yr
- Down + closing
- —
- Monthly P&I
- —
- Monthly cashflow
- —
- DSCR
- —
- Eligible?
- —
Personal DTI + credit; lowest rate.
DSCR
20% down · 8.5% · 30yr
- Down + closing
- —
- Monthly P&I
- —
- Monthly cashflow
- —
- DSCR
- —
- Eligible?
- —
No personal income docs; deal must DSCR.
Hard money
10% down · 12.0% · 12mo
- Down + closing
- —
- Monthly P&I
- —
- Monthly cashflow
- —
- DSCR
- —
- Eligible?
- —
Short-term bridge; refi at stabilization.
Rent comps 7 comps
| Address | Beds | Baths | Sqft | Rent | $/sqft | DOM | Units | Dist |
|---|---|---|---|---|---|---|---|---|
| 5432 23rd Ave Kenosha, WI | 4.0 | 2.0 | 1400 | $1,695 | $1.21 | 3d | 1 | 0.13mi |
| 5807 20th Ave Unit 2 Kenosha, WI | 3.0 | 1.0 | 1064 | $2,400 | $2.26 | 18d | 1 | 0.41mi |
| 2708 48th St Kenosha, WI | 4.0 | 2.0 | 1200 | $2,500 | $2.08 | 22d | 1 | 0.50mi |
| 1510 57th St Unit 2 Kenosha, WI | 4.0 | 2.0 | 1700 | $1,800 | $1.06 | 43d | 1 | 0.51mi |
| 1809 60th St Kenosha, WI | 3.0 | 1.0 | 1100 | $1,500 | $1.36 | 43d | 1 | 0.53mi |
| 3905 29th Ave Kenosha, WI | 3.0 | 2.0 | 1550 | $1,600 | $1.03 | 18d | 1 | 1.08mi |
| 2114 36th St Kenosha, WI | 3.0 | 2.0 | 1889 | $3,200 | $1.69 | 43d | 1 | 1.21mi |
Listing history 19 events
-
2026-06-18days on market $225,000 Active 35 DOM
-
2026-06-17days on market $225,000 Active 34 DOM
-
2026-06-16days on market $225,000 Active 33 DOM
-
2026-06-15days on market $225,000 Active 32 DOM
-
2026-06-13days on market $225,000 Active 30 DOM
-
2026-06-09days on market $225,000 Active 26 DOM
-
2026-06-08days on market $225,000 Active 25 DOM
-
2026-06-07days on market $225,000 Active 24 DOM
-
2026-06-04days on market $225,000 Active 21 DOM
-
2026-06-03days on market $225,000 Active 20 DOM
-
2026-06-02days on market $225,000 Active 19 DOM
-
2026-06-01days on market $225,000 Active 18 DOM
-
2026-05-31days on market $225,000 Active 17 DOM
-
2026-05-14$225,000 Active 568-char remark
-
2021-01-12soldstatus $81,000
-
2021-01-08soldstatus $81,000 Sold 422-char remark
Show marketing remark (422 chars)
This property could be your next investment and work for an owner/occupant or investor. Lots of perks with this property. New roof, newer windows, newer siding, new furnace, and detached garage for off street parking. Each unit is 2 bedrooms, 1 bathroom. Nice size kitchens and living areas. Also, each unit has it's own pantry for food. Also, nice size back yard that's fenced in. Could be great for family get togethers.
-
2020-12-06historical Contingent 422-char remark
Show marketing remark (422 chars)
This property could be your next investment and work for an owner/occupant or investor. Lots of perks with this property. New roof, newer windows, newer siding, new furnace, and detached garage for off street parking. Each unit is 2 bedrooms, 1 bathroom. Nice size kitchens and living areas. Also, each unit has it's own pantry for food. Also, nice size back yard that's fenced in. Could be great for family get togethers.
-
2020-12-02$84,900 Active 422-char remark
Show marketing remark (422 chars)
This property could be your next investment and work for an owner/occupant or investor. Lots of perks with this property. New roof, newer windows, newer siding, new furnace, and detached garage for off street parking. Each unit is 2 bedrooms, 1 bathroom. Nice size kitchens and living areas. Also, each unit has it's own pantry for food. Also, nice size back yard that's fenced in. Could be great for family get togethers.
-
1996-07-01soldstatus $69,000
ⓘ Source: listings_history table (triggers on properties + properties_extension) + one-shot
backfill from property_details.listing_events for pre-trigger history.
Tax reassessment forecast WI · Partial reset (capped growth)
- Current annual tax
- $2,233 · $186/mo
- Projected year-2 tax
- $3,198 · $266/mo
- Expected delta
- +$965/yr (+$80/mo · 43.2%)
ⓘ Screening estimate from a state-policy table — verify with the county assessor before closing.
Climate risk First Street
- Flood 1/10 Low FEMA zone X (unshaded) · 0% chance over 30 yrs
- Wildfire 1/10 Low
- Heat 2/10 Low 7 d/yr ≥96°F today · 14 d/yr by 30 yrs out
- Wind 2/10 Low
- Air quality 3/10 Moderate 2 unhealthy d/yr today · 3 by 30 yrs out
Nearby sold comps map
Loading sold comps map…
Walkable amenities ~0.75 mi
Loading nearby amenities…
Taxation est. · year 1
- Rental income
- $32,232
- − Mortgage interest
- −$12,603
- − Property taxes
- −$2,233
- − Insurance
- −$1,125
- − Repairs & maintenance
- −$2,579
- − Management
- −$2,579
- − Depreciation
- −$6,545
- Taxable income
- $4,568
- Est. tax owed @ 24.0%
- −$1,096
- After-tax cash flow
- $6,850/yr
For passive investors: Depreciation is non-cash, so a rental often shows a tax loss while cash-flowing — sheltering income. Rental losses are passive: they offset passive income freely, and up to $25,000/yr can offset ordinary (W-2) income if you actively participate and your MAGI is under $100k (phasing out to $0 by $150k); unused losses carry forward. On sale, claimed depreciation is recaptured at up to 25%, and gains may owe capital-gains tax (a 1031 exchange can defer both). Figures are a year-1 estimate at your 24.0% rate — not tax advice; consult a CPA.
Schools (NCES district)
- District
- Kenosha School District
- NCES district ID
- 5507320
- Math proficiency
- 26% ▼ -9.00%
- Reading proficiency
- 31% ▼ -6.00%
- Median HH income
- $52,407
- Composite
- 25.17/100
- National rank
- #7516
- State rank
- #287 of 342 in WI
Livability — Kenosha
- Score
- 84/100
- State rank
- #31
- US rank
- #680
Category grades
Schools grade is shown separately in the Schools card above.
Census & demographics
- Census place
- Kenosha, WI
- County
- Kenosha County · 130,343 people
- City population
- 85,271
- Metro
- Chicago-Naperville-Elgin, IL-IN-WI
- Population (ZIP)
- 30,238
- Household income
- $58,006
- Rent vs Own
- Severe rent burden
- 1576.0
Population outlook (Kenosha County) Hauer SSP2
- Today (2025)
- 174,032 people
- By 2030
- 174,923 · +0.5%
- By 2040
- 173,895 · -0.1%
- By 2050
- 170,102 · -2.3%
- By 2075
- 162,952 · -6.4%
- By 2100
- 154,781 · -11.1%
Race, ethnicity, and origin ACS 2023
- Neighborhood character
- Predominantly White (66%)
- Race & ethnicity
- White 66% Hispanic / Latino 19% Two or more races 14% Black 9% Asian 2%
- Hispanic origin (detail)
- Mexican 14% Puerto Rican 2%
- Common ancestry
- Romanian 7% Lithuanian 3% Portuguese 3%
- Foreign-born
- 10% · Canada
- Languages at home
- 83% English-only · Spanish 12% Other Indo-European 3% Other Asian/Pacific 1%
Political lean MEDSL · Kenosha
- 2024 margin
- Lean R (+6.2) · D 46.2% · R 52.5% · Other 1.3%
- 2008→2024 swing
- -24.3pp toward R · 2008: 18.1pp · 2024: -6.2pp
- All cycles
- 2024: R+6.2 2020: R+3.1 2016: R+0.3 2012: D+12.3 2008: D+18.1
Not yet ingested
- Civics
- —
Market trends
- HPI YoY
- ▼ -187.92%
- Current HPI
- 235.0929
- Rent YoY
- ▲ 5.98%
- Metro
- Chicago-Naperville-Elgin, IL-IN-WI
- State GDP YoY
- ▲ 2.10%
- F500 in state
- 20
Industry mix (Fortune 500 HQ in WI)
| Industry | F500 HQs | Revenue |
|---|---|---|
| Industrial Machinery | 4 | $23B |
|
||
| Industrial Technology | 2 | $36B |
|
||
| Insurance | 1 | $36B |
|
||
| Professional Services | 1 | $19B |
|
||
| Utilities | 1 | $9B |
|
||
| Consumer Goods | 1 | $3B |
|
||
Price history
+226.1% since first listed6 events — show timeline
- 2026-05-14 Listed $225,000 METROMLS
- 2021-01-12 Sold (Public Records) $81,000 Public Records
- 2021-01-08 Sold (MLS) $81,000 METROMLS
- 2020-12-06 Contingent — METROMLS
- 2020-12-02 Listed $84,900 METROMLS
- 1996-07-01 Sold (Public Records) $69,000 Public Records
Property tax history
+2.4%/yrLatest (2025): $2,233 · +5.6% YoY. Source: county tax records.
Cash-flow waterfall
monthlySold comps — $/sqft
last 12 mo · ≤1 miLoading sold comps…