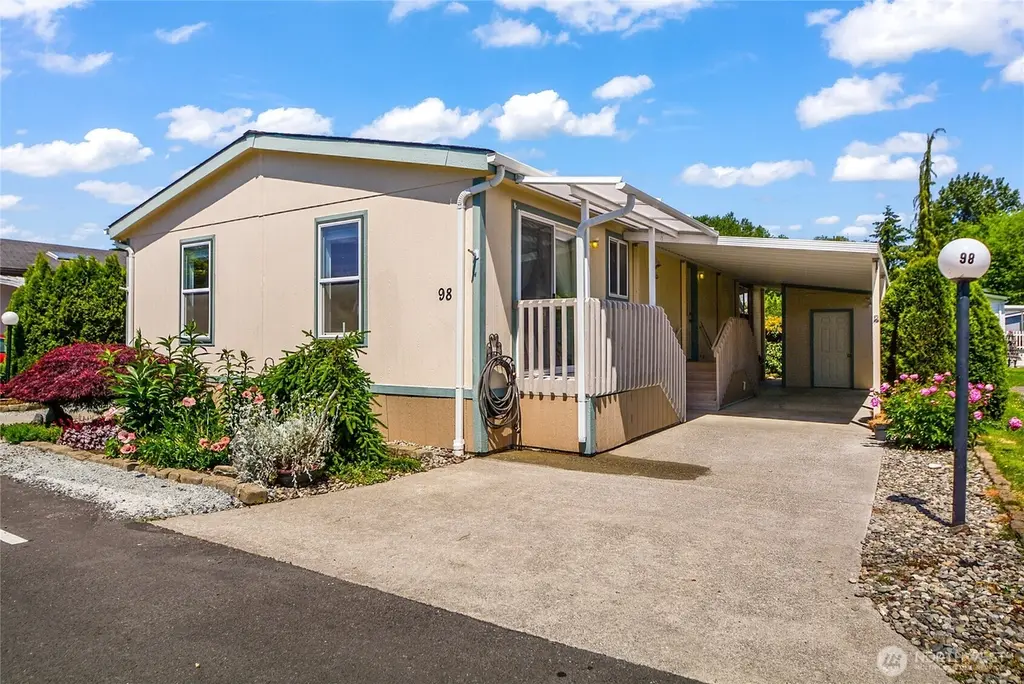
14727 43rd Ave NE #98 · Marysville, WA
Flood risk No data
- FEMA flood zone
- —
- Chance of flooding over 30 yrs
- —
- Est. flood insurance / yr
- —
Fire risk No data
- Est. fire insurance / yr
- —
Heat risk No data
- Hot days now (above threshold)
- —
- Hot days in 30 yrs
- —
Wind risk No data
- Chance of severe wind over 30 yrs
- —
Air-quality risk No data
- Unhealthy air days now
- —
- Unhealthy air days in 30 yrs
- —
Risk factors via First Street. Map © Google.
Why this score? — see what drove the C grade
The composite is a weighted blend of 9 inputs, each scored 0–100. Each bar is that input's sub-score; the figure is the points it added to the 100-point composite (weight × sub-score).
- Cash flow +26.9/30.0
- DSCR +9.3/10.0
- 1% rule +6.2/10.0
- Livability +4.2/5.0
- Schools +4.1/10.0
- Rent growth +3.1/5.0
- Condition / age +2.5/5.0
- ARV discount +1.3/15.0
- Appreciation +0.0/10.0
$230,000
🖨 Deal sheet 📄 Offer letter ✓ Due diligence
Listing remarks
Welcome to Emerald Hills Estates, a 55+ gated community! Designed with comfort and style! This light, bright and open floor plan is accented with generous windows, vaulted ceilings and skylights! Beautiful laminate flooring in main living area. Kitchen is featuring a large Island, white painted cabinets and the appliances all stay. Large primary bedroom and spacious bath with walk-in shower. Mature landscaping and gardens! No shortage of storage here, including not one but two storage sheds! This is a highly sought-after location due to the convenient access to medical facilities, dining, entertainment, Costco, Target, Walmart, Amazon, I-5, Highways, Freeway & Tulalip Casino/Resort,
Key facts
- Gated community
- Large island
- Walk-in shower
Tags
Property features AI
Finance
- Other: Calculated building area: 1296 square feet
- Financial info: Listing terms: Cash, Conventional; Land lease amount applies
- HOA & community: Located in a senior community (Emerald Hills Estate); Park amenities include BBQs, clubhouse, high-speed internet availability, RV parking, security gate, tennis courts; Approximately 146 homes in the park; Pets allowed (cats and dogs); Land lease applies
Exterior
- Parking: Carport
- Security: Security gate
- Utilities: Public water (City of Marysville); Public sewer (City of Marysville); Electric service (Snohomish County PUD); AT&T internet available
- Home design: Manufactured double-wide home (Fleetwood); One level; Manufactured house / Mobile home remains
- Construction: Wood construction; Composition roof; Pillar/post/pier foundation with tie downs
- Exterior features: Wood exterior products; Paved lot; Patio/porch/deck
Interior
- Kitchen: Dishwasher; Garbage disposal; Refrigerator; Stove/Range
- Bedrooms: 3 bedrooms
- Flooring: Laminate; Vinyl; Carpet
- Bathrooms: 1 full bath; 1 three-quarter bath; 1 bathtub; 2 showers
- Heating & cooling: Forced air heating; Heat pump (heating and cooling); Forced air cooling
- Interior features: Fireplace (electric); Water heater (electric, located in hallway); Vaulted ceilings; Skylights; Awnings; Drapes; Patio/porch/deck
- Laundry & utility: Washer; Dryer; Utility room
Neighborhood map
What this means for you Summary
Snapshot
- This is a 3-bed/2.0-bath manufactured listed at $230k.
Deal economics
- At list price, monthly cash flow is $639 ($8k/yr) — positive.
- The deal already cash-flows at list — no discount required.
- Meets the 1% rule at list price ($3k rent vs $230k).
- Recommended offer: $227k (1.5% below list) — sets the bar for market timing.
- Cap rate 9.6% vs local median 3.0% in Marysville — top-decile yield for the area; either an underpriced asset or a hidden risk that comps aren't pricing in. Stress-test before assuming the spread holds.
Location & tenants
- Location reads 84/100 on livability (#43 in WA, #768 nationally) — a professional / high-income tenant draw. Strengths: commute A+, employment A+, housing A+; Watch: cost of living F.
- Marysville School District (suburban): math 36% / reading 51% proficiency, ranked #177 of 291 in WA (top 61%) — families likely to look elsewhere, expect single-tenant / working-renter base with shorter leases.
- Market conditions: Rents rising (+2.3%/yr); 213 active listings in the ZIP; 9 comparable units currently listed for rent nearby; rentals leasing fast (median 2d on market — plan ~1-2 weeks tenant-placement turnaround); solid renter incomes; 3,982 units permitted in Snohomish County in 2024 (1,492 in 5+ unit buildings).
- This rent runs 32% of the median local income ($96k/yr) — at the standard rent-burdened threshold; future hikes will face affordability resistance.
Forward outlook
- Local home prices are declining (-3.0%/yr); year-one equity from $2k of loan paydown is wiped out by about $7k of value loss. Plan a longer hold.
- Snohomish County population projected at +30% by 2050 — long-run rental-demand tailwind backs the buy-and-hold thesis.
Negotiation context
- It's been on market 16 days — a 2% lower offer ($227k) is reasonable based on typical stale-listing flexibility.
- 3 sale attempts since 8y ago with the ask held roughly flat each time — persistent listings suggest the price (not the market) is what's stuck; bring a comps-based counter.
- Current owner paid $115k; list at $230k implies a 100% gain — meaningful room to come down on a strong offer.
Questions for the listing agent
- Is there a deadline driving the sale (1031 exchange, divorce, estate, relocation)? That informs how much negotiation room exists.
- Schools are B-rated — typically a magnet for longer-tenancy family renters. What's the average tenant stay here, and is there a school-zone premium baked into asking?
- What's the average days-on-market for RENTAL listings here right now (not sales)? A rising rental-DOM trend means longer vacancies and softer asking-rent achievability than the comps imply.
- What's the recent tenant-quality profile in this submarket — average credit score on applications, eviction rate, late-payment / NSF rate, and stable-employment percentage? A property-management company in the area should have these aggregated.
- How much new for-sale + rental construction is in the pipeline within 1–3 miles? Heavy new supply typically softens prices + rents 12–24 months out; constrained supply supports both.
Investment metrics
- 1% rule
- 1.12% ✓
- Cap rate
- 9.63%
- Cash-on-cash
- 11.92%
- DSCR
- 1.53
- GRM
- 7.4
CMA / ARV
- ARV (on-the-fly)
- $202,176
- Comps found
- 8
Show comp detail 8 sales within ~0.75 mi
| Address | Dist | Beds/Ba | Sqft | Sold | Price | $/sf | Match |
|---|---|---|---|---|---|---|---|
| 14727 43rd Ave NE #100 | 0.00mi | 3/2.0 | 1,296 (0%) | 7mo | $195,000 | $150 | 94 |
| 14727 43rd Ave NE #39 | 0.00mi | 3/2.0 | 1,286 (-1%) | 14mo | $225,000 | $175 | 87 |
| 14727 43rd Ave NE #95 | 0.00mi | 3/2.0 | 1,404 (+8%) | 5mo | $199,000 | $142 | 82 |
| 14727 43rd Ave NE #54 | 0.00mi | 3/2.0 | 1,383 (+7%) | 11mo | $215,500 | $156 | 80 |
| 14727 43rd Ave NE #34 | 0.00mi | 3/2.0 | 1,321 (+2%) | 22mo | $210,000 | $159 | 79 |
| 14727 43rd Ave NE #103 | 0.00mi | 2/2.0 (-1) | 1,290 (-0%) | 21mo | $219,000 | $170 | 77 |
| 14727 43rd Ave NE #92 | 0.00mi | 3/2.0 | 1,419 (+10%) | 11mo | $220,000 | $155 | 75 |
| 14727 43rd Ave NE #43 | 0.00mi | 3/2.0 | 1,458 (+12%) | 16mo | $215,000 | $147 | 66 |
Match score weights: distance 35% · size 25% · config 20% · recency 20%. Top-matched comps best support the ARV.
Projected returns pro-forma
-3.0% appreciation · 2.3% rent growth · sell at horizon
- IRR
- 0.6%
- Equity multiple
- 1.02×
- Total profit
- $1,574
- Equity at exit
- $34,294
- IRR
- 9.6%
- Equity multiple
- 1.72×
- Total profit
- $46,190
- Equity at exit
- $19,886
Cash invested: $64,400 (down + closing). Projections, not guarantees.
Landlord ↔ Tenant lean methodology
- Overall (STATE)
- 28 Tenant-Leaning
- State Washington
- 28 Tenant-Leaning · D+8
- County
- — inherits STATE
- City
- — inherits STATE
ZIP-level market 98271
- Rents YoY
- 2.3%
- Active inventory
- 213
- Price-to-rent
- 7.4×
Monthly cashflow live
- Estimated rent
- $2,587 high interval (Pro) →
- Mortgage (P&I)
- −$1,206
- Tax from tax record
- −$103 /mo · $1,231/yr
- Insurance
- −$96
- HOA
- −$0
- Vacancy / Maint / Mgmt
- −$543
- Net cashflow
- $639
Break-even live
UW: 25.0% down · 7.5% · 30yr · 1.5% tax · 5.0% vac · 8.0% maint · 8.0% mgmt
Financing live
Cash to close
- Down payment
- $57,500
- Closing costs
- $6,900
- Reserves months
- —
- Total cash needed
- —
Loan-product check · same deal, 3 products live
Conventional
25% down · 7.5% · 30yr
- Down + closing
- —
- Monthly P&I
- —
- Monthly cashflow
- —
- DSCR
- —
- Eligible?
- —
Personal DTI + credit; lowest rate.
DSCR
20% down · 8.5% · 30yr
- Down + closing
- —
- Monthly P&I
- —
- Monthly cashflow
- —
- DSCR
- —
- Eligible?
- —
No personal income docs; deal must DSCR.
Hard money
10% down · 12.0% · 12mo
- Down + closing
- —
- Monthly P&I
- —
- Monthly cashflow
- —
- DSCR
- —
- Eligible?
- —
Short-term bridge; refi at stabilization.
Rent comps 9 comps
| Address | Beds | Baths | Sqft | Rent | $/sqft | DOM | Units | Dist |
|---|---|---|---|---|---|---|---|---|
| 14629 46th Ave NE Marysville, WA | 3.0 | 2.5 | 1642 | $2,850 | $1.74 | 1d | 1 | 0.20mi |
| 14500 51st Ave NE Marysville, WA | 1.0–2.0 | 1.0–2.0 | 836 | $2,315 | $2.77 | 1d | 1 | 0.36mi |
| 5013 148th St NE Marysville, WA | 2.0 | 2.0 | 950 | $2,070 | $2.18 | 21d | 1 | 0.39mi |
| 14701 50th Dr NE Marysville, WA | 3.0 | 2.0 | 1118 | $2,450 | $2.19 | 1d | 1 | 0.41mi |
| 14725 50th Dr NE Marysville, WA | 2.0 | 2.0 | 950 | $2,070 | $2.18 | 43d | 1 | 0.42mi |
| 14725 50th Dr NE #201 Marysville, WA | 3.0 | 2.0 | 1118 | $2,450 | $2.19 | 1d | 1 | 0.42mi |
| 5429 132nd St NE Marysville, WA | 3.0 | 2.0 | 1246 | $2,500 | $2.01 | 4d | 1 | 1.01mi |
| 12705 48th Ave NE Unit 3 Marysville, WA | 2.0 | 1.5 | 1088 | $1,800 | $1.65 | 43d | 1 | 1.19mi |
| 4906 Longhouse Trail Ln NE Arlington, WA | 2.0 | 1.0–2.0 | 687 | $2,350 | $3.42 | 1d | 9 | 1.42mi |
Listing history 11 events
-
2026-06-18days on market $230,000 Active 16 DOM
-
2026-06-17days on market $230,000 Active 15 DOM
-
2026-06-16days on market $230,000 Active 14 DOM
-
2026-06-15days on market $230,000 Active 13 DOM
-
2026-06-13days on market $230,000 Active 11 DOM
-
2026-06-09days on market $230,000 Active 7 DOM
-
2026-06-08days on market $230,000 Active 6 DOM
-
2026-06-07days on market $230,000 Active 5 DOM
-
2026-06-04days on market $230,000 Active 2 DOM
-
2026-06-03remarks 695-char remark
-
2026-06-03$230,000 Active 1 DOM
ⓘ Source: listings_history table (triggers on properties + properties_extension) + one-shot
backfill from property_details.listing_events for pre-trigger history.
Tax reassessment forecast WA · Resets to sale price
- Current annual tax
- $1,231 · $103/mo
- Projected year-2 tax
- $2,254 · $188/mo
- Expected delta
- +$1,023/yr (+$85/mo · 83.1%)
ⓘ Screening estimate from a state-policy table — verify with the county assessor before closing.
Nearby sold comps map
Loading sold comps map…
Walkable amenities ~0.75 mi
Loading nearby amenities…
Taxation est. · year 1
- Rental income
- $31,048
- − Mortgage interest
- −$12,884
- − Property taxes
- −$1,231
- − Insurance
- −$1,150
- − Repairs & maintenance
- −$2,484
- − Management
- −$2,484
- − Depreciation
- −$6,691
- Taxable income
- $4,125
- Est. tax owed @ 24.0%
- −$990
- After-tax cash flow
- $6,684/yr
For passive investors: Depreciation is non-cash, so a rental often shows a tax loss while cash-flowing — sheltering income. Rental losses are passive: they offset passive income freely, and up to $25,000/yr can offset ordinary (W-2) income if you actively participate and your MAGI is under $100k (phasing out to $0 by $150k); unused losses carry forward. On sale, claimed depreciation is recaptured at up to 25%, and gains may owe capital-gains tax (a 1031 exchange can defer both). Figures are a year-1 estimate at your 24.0% rate — not tax advice; consult a CPA.
Schools (NCES district)
- District
- Marysville School District
- NCES district ID
- 5304860
- Math proficiency
- 36% ▼ -1.00%
- Reading proficiency
- 51% ▲ 2.00%
- Median HH income
- $67,461
- Composite
- 41.31/100
- National rank
- #7367
- State rank
- #177 of 291 in WA
Livability — Marysville
- Score
- 84/100
- State rank
- #43
- US rank
- #768
Category grades
Schools grade is shown separately in the Schools card above.
Census & demographics
- Census place
- Marysville, WA
- County
- Snohomish County · 786,756 people
- City population
- 85,887
- Metro
- Seattle-Tacoma-Bellevue, WA
- Population (ZIP)
- 30,838
- Household income
- $95,654
- Rent vs Own
- Severe rent burden
- 929.0
Population outlook (Snohomish County) Hauer SSP2
- Today (2025)
- 899,800 people
- By 2030
- 960,975 · +6.8%
- By 2040
- 1,074,447 · +19.4%
- By 2050
- 1,171,954 · +30.2%
- By 2075
- 1,384,849 · +53.9%
- By 2100
- 1,497,296 · +66.4%
Race, ethnicity, and origin ACS 2023
- Neighborhood character
- Predominantly White (66%)
- Race & ethnicity
- White 66% Two or more races 13% Hispanic / Latino 13% Native American 7% Asian 5% Black 1%
- Hispanic origin (detail)
- Mexican 9%
- Common ancestry
- Portuguese 6% Iranian 3% Lithuanian 2%
- Foreign-born
- 9% · Canada, China, South Korea
- Languages at home
- 86% English-only · Spanish 8% Russian/Polish/Slavic 1% Tagalog/Filipino 1%
Political lean MEDSL · Snohomish
- 2024 margin
- D (+19.0) · D 57.8% · R 38.9% · Other 3.3%
- 2008→2024 swing
- +0.1pp no change · 2008: 18.9pp · 2024: 19.0pp
- All cycles
- 2024: D+19.0 2020: D+20.6 2016: D+16.6 2012: D+16.2 2008: D+18.9
Not yet ingested
- Civics
- —
Market trends
- HPI YoY
- ▼ -666.16%
- Current HPI
- 305.285
- Rent YoY
- ▲ 2.30%
- Metro
- Seattle-Tacoma-Bellevue, WA
- State GDP YoY
- ▲ 4.65%
- F500 in state
- 22
Industry mix (Fortune 500 HQ in WA)
| Industry | F500 HQs | Revenue |
|---|---|---|
| Retail | 2 | $269B |
|
||
| Technology / Retail | 1 | $638B |
|
||
| Technology | 1 | $245B |
|
||
| Telecommunications | 1 | $38B |
|
||
| Food / Beverage | 1 | $36B |
|
||
| Automotive / Trucks | 1 | $34B |
|
||
Price history
+36.9% since first listed9 events — show timeline
- 2026-06-02 Listed $230,000 NWMLS as Distributed by MLS Grid
- 2019-10-21 Sold (MLS) $115,000 NWMLS as Distributed by MLS Grid
- 2019-10-05 Pending — NWMLS as Distributed by MLS Grid
- 2019-10-01 Listed $115,000 NWMLS as Distributed by MLS Grid
- 2018-10-07 Pending — NWMLS as Distributed by MLS Grid
- 2018-10-04 Sold (MLS) $135,000 NWMLS as Distributed by MLS Grid
- 2018-08-31 Contingent — NWMLS as Distributed by MLS Grid
- 2018-08-14 Price Changed $137,500 NWMLS as Distributed by MLS Grid
- 2018-05-31 Listed $168,000 NWMLS as Distributed by MLS Grid
Property tax history
+7.2%/yrLatest (2026): $1,231 · +2.6% YoY. Source: county tax records.
Cash-flow waterfall
monthlySold comps — $/sqft
last 12 mo · ≤1 miLoading sold comps…