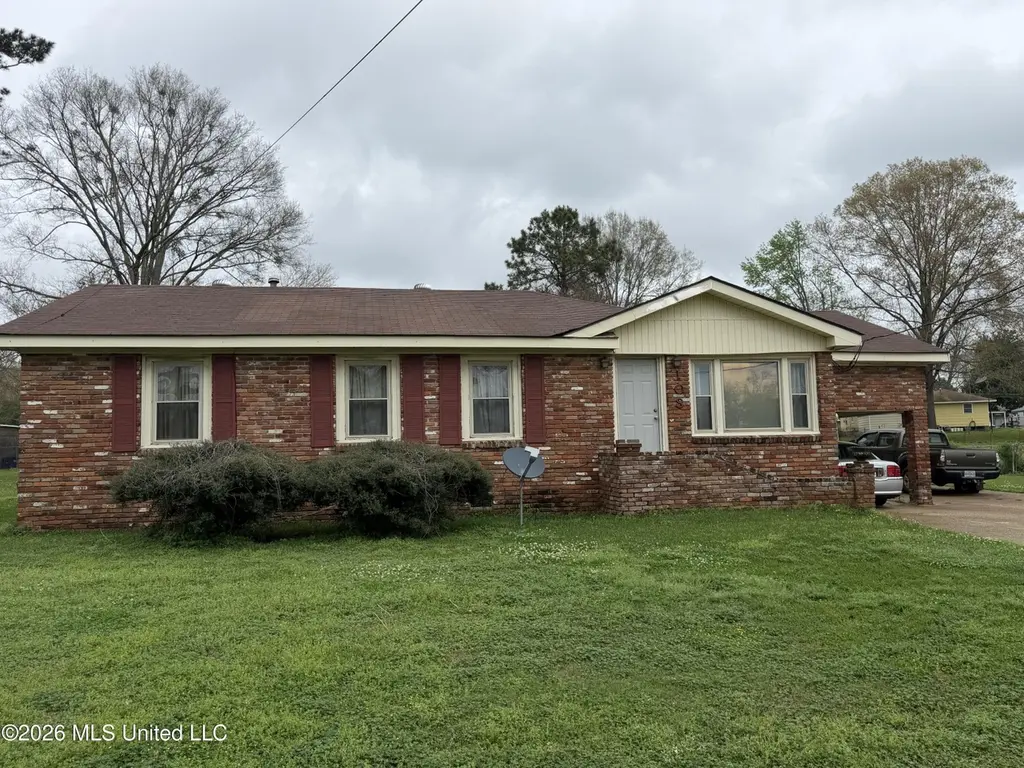
108 Dixie Dr · Morgantown, MS
Flood risk 1/10 · Minimal
- FEMA flood zone
- X (unshaded)
- Chance of flooding over 30 yrs
- 0.0%
- Est. flood insurance / yr
- $507 – $1,088
Fire risk 1/10 · Minimal
- Est. fire insurance / yr
- $1,241 – $2,305
Heat risk 7/10 · Major
- Hot days now (above 107°F)
- 7 days/yr
- Hot days in 30 yrs
- 19 days/yr
Wind risk 8/10 · Major
- Chance of severe wind over 30 yrs
- 94.0%
Air-quality risk 1/10 · Minimal
- Unhealthy air days now
- 0 days/yr
- Unhealthy air days in 30 yrs
- 0 days/yr
Risk factors via First Street. Map © Google.
Why this score? — see what drove the C- grade
The composite is a weighted blend of 9 inputs, each scored 0–100. Each bar is that input's sub-score; the figure is the points it added to the 100-point composite (weight × sub-score).
- Cash flow +26.1/30.0
- DSCR +8.8/10.0
- 1% rule +6.0/10.0
- Livability +3.2/5.0
- Rent growth +2.5/5.0
- Condition / age +2.5/5.0
- Schools +1.0/10.0
- ARV discount +0.0/15.0
- Appreciation +0.0/10.0
$129,000
🖨 Deal sheet (PDF) 📄 Offer letter ✓ Due diligence
Listing remarks MLS
Located in the Morgantown area is this three bedroom one and a half brick home. New flooring throughout. Hot water heater is approximately one year old. 36 x 36 shop with lots of storage.
Key facts
- New flooring
- Hot water heater
- Brick home
Tags
Neighborhood map
What this means for you Summary
Snapshot
- This is a 3-bed/1.0-bath single-family listed at $129k.
Deal economics
- At list price, monthly cash flow is $323 ($4k/yr) — positive.
- The deal already cash-flows at list — no discount required.
- Meets the 1% rule at list price ($1k rent vs $129k).
- Recommended offer: $117k (9.0% below list) — sets the bar for market timing.
Location & tenants
- Location reads 65/100 on livability (#106 in MS) — a middle-class / working-renter tenant base. Strengths: crime A+, cost of living A+, housing A-; Watch: health & safety C-, schools F, amenities F.
- Natchez-Adams School District (town): math 8% / reading 19% proficiency, ranked #114 of 130 in MS (top 88%) — low school quality limits family demand, transient renter base, plan for 1-2y turnover; 90% free/reduced lunch — lower-income household profile, screen leases tightly.
- Market conditions: 283 active listings in the ZIP; 6 units permitted in Adams County in 2024 (0 in 5+ unit buildings).
Forward outlook
- Local home prices are declining (-3.0%/yr); year-one equity from $892 of loan paydown is wiped out by about $4k of value loss. Plan a longer hold.
- Adams County population projected at -21% by 2050 — secular population decline; favor cash flow + early exit over multi-decade hold.
Negotiation context
- It's been on market 100 days — a 9% lower offer ($117k) is reasonable based on typical stale-listing flexibility.
Risks & watch-outs
- Climate carrying-cost: severe wind risk, 94% chance of damaging wind over 30y; extreme-heat days projected 7→19/yr by 2055 (HVAC capex compounding) — expect insurance premiums to compound above CPI over the hold.
Questions for the listing agent
- It's been on market 100 days. Have you received any prior offers? Is the seller open to a 9% concession, seller financing, or rate buy-down credit?
- Built in 1960 — when were the roof, HVAC, electrical panel, plumbing, and water heater last replaced?
- Why hasn't it sold? Are there any deal-killer items the seller is aware of (foundation, flood, title, zoning, code violations)?
- Is there a deadline driving the sale (1031 exchange, divorce, estate, relocation)? That informs how much negotiation room exists.
- Schools are F-rated, which usually means shorter tenancies and higher turnover. Who's the typical renter profile here, and what's been the actual vacancy rate?
- What's the average days-on-market for RENTAL listings here right now (not sales)? A rising rental-DOM trend means longer vacancies and softer asking-rent achievability than the comps imply.
- What's the recent tenant-quality profile in this submarket — average credit score on applications, eviction rate, late-payment / NSF rate, and stable-employment percentage? A property-management company in the area should have these aggregated.
- How much new for-sale + rental construction is in the pipeline within 1–3 miles? Heavy new supply typically softens prices + rents 12–24 months out; constrained supply supports both.
Investment metrics
- 1% rule
- 1.10% ✓
- Cap rate
- 9.30%
- Cash-on-cash
- 10.74%
- DSCR
- 1.48
- GRM
- 7.5
CMA / ARV
- ARV (median comp)
- $99,479
- List price
- $129,000
- Delta
- 29.68%
- Verdict
- OVERPRICED
- Comps
- 20 within 1.0 mi
Show comp detail 12 sales within ~0.75 mi
| Address | Dist | Beds/Ba | Sqft | Sold | Price | $/sf | Match |
|---|---|---|---|---|---|---|---|
| 2145 Second St | 0.06mi | 3/1.0 | 1,329 (-8%) | 10mo | $115,700 | $87 | 76 |
| 802 Morgan Ave | 0.28mi | 3/2.0 | 1,380 (-4%) | 2mo | $90,000 | $65 | 74 |
| 104 Brooklyn Dr | 0.31mi | 3/1.0 | 1,401 (-3%) | 9mo | $120,000 | $86 | 73 |
| 503 Brooklyn Dr | 0.38mi | 3/2.0 | 1,459 (+1%) | 7mo | $149,500 | $102 | 71 |
| 180 1/2 Booker | 0.44mi | 3/1.0 | 1,462 (+1%) | 15mo | $114,900 | $79 | 65 |
| 11 Myrtle Dr | 0.67mi | 3/1.0 | 1,456 (+1%) | 11mo | $54,900 | $38 | 58 |
| 108 Cross | 0.48mi | 3/2.0 | 1,519 (+5%) | 20mo | $179,900 | $118 | 48 |
| 109 Mimosa Dr | 0.59mi | 3/1.5 | 1,339 (-7%) | 14mo | $39,000 | $29 | 47 |
| 302 Brooklyn Dr | 0.28mi | 3/1.5 | 1,245 (-14%) | 19mo | $130,000 | $104 | 46 |
| 510 Brooklyn Dr | 0.43mi | 3/2.0 | 1,275 (-12%) | 15mo | $115,000 | $90 | 44 |
| 1208 Horseshoe | 0.52mi | 3/2.0 | 1,623 (+12%) | 18mo | $175,000 | $108 | 36 |
| 15 Dogwood Dr | 0.70mi | 3/2.0 | 1,239 (-14%) | 13mo | $78,000 | $63 | 29 |
Match score weights: distance 35% · size 25% · config 20% · recency 20%. Top-matched comps best support the ARV.
Projected returns pro-forma
-3.0% appreciation · 3.0% rent growth · sell at horizon
- IRR
- -0.3%
- Equity multiple
- 0.99×
- Total profit
- $-357
- Equity at exit
- $19,234
- IRR
- 9.4%
- Equity multiple
- 1.72×
- Total profit
- $26,053
- Equity at exit
- $11,154
Cash invested: $36,120 (down + closing). Projections, not guarantees.
Landlord ↔ Tenant lean methodology
- Overall (STATE)
- 90 Strongly Landlord-Friendly
- State Mississippi
- 90 Strongly Landlord-Friendly · R+11
- County
- — inherits STATE
- City
- — inherits STATE
ZIP-level market 39120
- Active inventory
- 283
- Price-to-rent
- 7.5×
Monthly cashflow live
- Estimated rent
- $1,424 medium interval (Pro) →
- Mortgage (P&I)
- −$676
- Tax from tax record
- −$72 /mo · $860/yr
- Insurance
- −$54
- HOA
- −$0
- Vacancy / Maint / Mgmt
- −$299
- Net cashflow
- $323
Break-even live
Sensitivity live
| Price | -10% $396 | -5% $360 | +0% $323 | +5% $287 | +10% $250 |
|---|---|---|---|---|---|
| Rent | -10% $211 | -5% $267 | +0% $323 | +5% $379 | +10% $436 |
| Rate | -1.0pp $388 | -0.5pp $356 | base $323 | +0.5pp $290 | +1.0pp $256 |
UW: 25.0% down · 7.5% · 30yr · 1.5% tax · 5.0% vac · 8.0% maint · 8.0% mgmt
Financing live
Cash to close
- Down payment
- $32,250
- Closing costs
- $3,870
- Reserves months
- —
- Total cash needed
- —
Loan-product check · same deal, 3 products live
Conventional
25% down · 7.5% · 30yr
- Down + closing
- —
- Monthly P&I
- —
- Monthly cashflow
- —
- DSCR
- —
- Eligible?
- —
Personal DTI + credit; lowest rate.
DSCR
20% down · 8.5% · 30yr
- Down + closing
- —
- Monthly P&I
- —
- Monthly cashflow
- —
- DSCR
- —
- Eligible?
- —
No personal income docs; deal must DSCR.
Hard money
10% down · 12.0% · 12mo
- Down + closing
- —
- Monthly P&I
- —
- Monthly cashflow
- —
- DSCR
- —
- Eligible?
- —
Short-term bridge; refi at stabilization.
Listing history 17 events
-
2026-06-21days on market $129,000 Active 100 DOM
-
2026-06-18days on market $129,000 Active 98 DOM
-
2026-06-17days on market $129,000 Active 97 DOM
-
2026-06-16days on market $129,000 Active 96 DOM
-
2026-06-16price $129,000 Active 95 DOM
-
2026-06-15days on market $135,000 Active 95 DOM
-
2026-06-13days on market $135,000 Active 93 DOM
-
2026-06-12days on market $135,000 Active 92 DOM
-
2026-06-09days on market $135,000 Active 89 DOM
-
2026-06-08days on market $135,000 Active 88 DOM
-
2026-06-07days on market $135,000 Active 87 DOM
-
2026-06-07days on market $135,000 Active 86 DOM
-
2026-06-04days on market $135,000 Active 83 DOM
-
2026-06-02days on market $135,000 Active 82 DOM
-
2026-06-01days on market $135,000 Active 81 DOM
-
2026-05-31days on market $135,000 Active 80 DOM
-
2026-03-10$135,000 Active 187-char remark
Show marketing remark (187 chars)
Located in the Morgantown area is this three bedroom one and a half brick home. New flooring throughout. Hot water heater is approximately one year old. 36 x 36 shop with lots of storage.
ⓘ Source: listings_history table (triggers on properties + properties_extension) + one-shot
backfill from property_details.listing_events for pre-trigger history.
Tax reassessment forecast MS · Resets to sale price
- Current annual tax
- $860 · $72/mo
- Projected year-2 tax
- $1,019 · $85/mo
- Expected delta
- +$159/yr (+$13/mo · 18.5%)
ⓘ Screening estimate from a state-policy table — verify with the county assessor before closing.
Climate risk First Street
- Flood 1/10 Low FEMA zone X (unshaded) · 0% chance over 30 yrs
- Wildfire 1/10 Low
- Heat 7/10 Severe 7 d/yr ≥107°F today · 19 d/yr by 30 yrs out
- Wind 8/10 Severe 94% chance of damaging wind over 30 yrs
- Air quality 1/10 Low 0 unhealthy d/yr today · 0 by 30 yrs out
Nearby sold comps map
Loading sold comps map…
Walkable amenities ~0.75 mi
Loading nearby amenities…
Taxation est. · year 1
- Rental income
- $17,089
- − Mortgage interest
- −$7,226
- − Property taxes
- −$860
- − Insurance
- −$645
- − Repairs & maintenance
- −$1,367
- − Management
- −$1,367
- − Depreciation
- −$3,753
- Taxable income
- $1,871
- Est. tax owed @ 24.0%
- −$449
- After-tax cash flow
- $3,428/yr
For passive investors: Depreciation is non-cash, so a rental often shows a tax loss while cash-flowing — sheltering income. Rental losses are passive: they offset passive income freely, and up to $25,000/yr can offset ordinary (W-2) income if you actively participate and your MAGI is under $100k (phasing out to $0 by $150k); unused losses carry forward. On sale, claimed depreciation is recaptured at up to 25%, and gains may owe capital-gains tax (a 1031 exchange can defer both). Figures are a year-1 estimate at your 24.0% rate — not tax advice; consult a CPA.
Schools (NCES district)
- District
- Natchez-Adams School District
- NCES district ID
- 2803030
- Math proficiency
- 8% ▼ -16.00%
- Reading proficiency
- 19% ▼ -5.00%
- Median HH income
- $28,288
- Composite
- 10.41/100
- National rank
- #9785
- State rank
- #114 of 130 in MS
Livability — Morgantown
- Score
- 65/100
- State rank
- #106
- US rank
- #12538
Category grades
Schools grade is shown separately in the Schools card above.
Census & demographics
- Census place
- Morgantown, MS
- Population (ZIP)
- 29,212
Population outlook (Adams County) Hauer SSP2
- Today (2025)
- 28,614 people
- By 2030
- 27,405 · -4.2%
- By 2040
- 24,914 · -12.9%
- By 2050
- 22,554 · -21.2%
- By 2075
- 17,096 · -40.3%
- By 2100
- 12,156 · -57.5%
Race, ethnicity, and origin ACS 2023
- Neighborhood character
- Diverse neighborhood (Simpson 0.55)
- Race & ethnicity
- Black 56% White 37% Hispanic / Latino 4% Two or more races 2%
- Common ancestry
- Lithuanian 2% Slovak 1% Serbian 1%
- Foreign-born
- 5% · Canada
- Languages at home
- 94% English-only · Spanish 4% Other Asian/Pacific 1%
Political lean MEDSL · Adams
- 2024 margin
- D (+13.9) · D 56.5% · R 42.6%
- 2008→2024 swing
- -1.7pp toward R · 2008: 15.6pp · 2024: 13.9pp
- All cycles
- 2024: D+13.9 2020: D+16.1 2016: D+14.7 2012: D+18.0 2008: D+15.6
Not yet ingested
- Civics
- —
Market trends
- HPI YoY
- ▼ -93.67%
- Current HPI
- 112.2371
- Rent YoY
- —
- Metro
- —
- State GDP YoY
- —
- F500 in state
- 0
Price history
1 event — show timeline
- 2026-03-10 Listed $135,000 MLSU
Property tax history
+2.3%/yrLatest (2025): $860 · +19.9% YoY. Source: county tax records.
Cash-flow waterfall
monthlySold comps — $/sqft
last 12 mo · ≤1 miLoading sold comps…