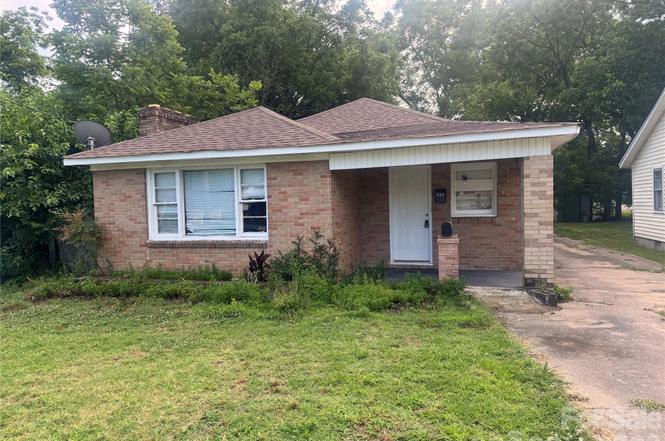
234 Lucky Ln · Rock Hill, SC
Flood risk 1/10 · Minimal
- FEMA flood zone
- X (unshaded)
- Chance of flooding over 30 yrs
- 0.0%
- Est. flood insurance / yr
- $507 – $1,088
Fire risk 3/10 · Minor
- Est. fire insurance / yr
- $783 – $1,453
Heat risk 6/10 · Moderate
- Hot days now (above 105°F)
- 7 days/yr
- Hot days in 30 yrs
- 16 days/yr
Wind risk 6/10 · Moderate
- Chance of severe wind over 30 yrs
- 27.0%
Air-quality risk 3/10 · Minor
- Unhealthy air days now
- 2 days/yr
- Unhealthy air days in 30 yrs
- 3 days/yr
Risk factors via First Street. Map © Google.
Why this score? — see what drove the C grade
The composite is a weighted blend of 9 inputs, each scored 0–100. Each bar is that input's sub-score; the figure is the points it added to the 100-point composite (weight × sub-score).
- Cash flow +19.4/30.0
- ARV discount +15.0/15.0
- DSCR +6.1/10.0
- 1% rule +4.9/10.0
- Rent growth +3.9/5.0
- Schools +3.5/10.0
- Livability +3.5/5.0
- Condition / age +2.5/5.0
- Appreciation +0.0/10.0
$172,000
🖨 Deal sheet (PDF) 📄 Offer letter ✓ Due diligence
Listing remarks MLS
Brick Ranch, Lg. Liv rm w/big picture window & beautiful brick fireplace. Full sized Din Rm w/small built-in corner hutch. Laminate flooring through out (2012). Big kitchen, dbl stainless sink, New Stove (2012). Laundry rm & glassed in Patio. Long lot runs from Lucky Ln. to Barber St. Lots of improvements done in 2012, new roof, elec wiring, Payne Ht. Pump. 2015 - New Kit faucets, Steel paneled back door.
Key facts
- 5,662 sq ft lot
- Built 1950
- Listed 7 days
Property features AI
Finance
- HOA & community: No HOA
Exterior
- Parking: Driveway
- Utilities: City water; Public sewer
- Home design: Single-family residence; Site-built construction; One story; Completed development; SF-4 zoning
- Construction: Brick exterior; Slab foundation
- Exterior features: Concrete and paved road access; Publicly maintained road
Interior
- Kitchen: No appliances specified
- Bedrooms: 2 bedrooms on the main level
- Bathrooms: 1 full bathroom; 1 half bathroom
- Heating & cooling: Central heating; Central air conditioning
- Interior features: Fireplace; Five total rooms
- Laundry & utility: No laundry facilities specified
Neighborhood map
What this means for you Summary
Snapshot
- This is a 2-bed/1.0-bath single-family listed at $172k.
Deal economics
- At list price, monthly cash flow is $191 ($2k/yr) — positive.
- The deal already cash-flows at list — no discount required.
- To meet the 1% rule (rent ≥ 1% of price), the offer needs to be $170k (1.0% below list).
- Recommended offer: $170k (1.0% below list) — sets the bar for 1% rule.
- Cap rate 7.6% vs local median 3.4% in Rock Hill — top-decile yield for the area; either an underpriced asset or a hidden risk that comps aren't pricing in. Stress-test before assuming the spread holds.
Location & tenants
- Location reads 70/100 on livability (#62 in SC) — a middle-class / working-renter tenant base. Strengths: cost of living A+, housing A+, health & safety A+; Watch: employment D+, crime D-, amenities D-.
- York 03 (urban): math 36% / reading 47% proficiency, ranked #32 of 80 in SC (top 40%) — families likely to look elsewhere, expect single-tenant / working-renter base with shorter leases.
- Zoned schools: Ebinport Elementary (math 22% / reading 32%, grade F, #421 of 597 statewide, top 73%, 459 students, 100% FRL); Rawlinson Road Middle (math 23% / reading 34%, grade F, #144 of 229 statewide, top 63%, 661 students, 100% FRL); South Pointe High (math 47% / reading 77%, grade B-, #99 of 196 statewide, top 53%, 1,196 students, 60% FRL) — zoned schools average 87% FRL vs 49% district-wide (37 pts higher); higher-poverty schools than district average — tighter screening recommended.
- Market conditions: Rents rising fast (+5.5%/yr); 355 active listings in the ZIP; 32 comparable units currently listed for rent nearby; rentals at typical pace (median 22d on market — plan ~3-4 weeks tenant-placement turnaround); 2,550 units permitted in York County in 2024 (350 in 5+ unit buildings).
Forward outlook
- Local home prices are declining (-3.0%/yr); year-one equity from $1k of loan paydown is wiped out by about $5k of value loss. Plan a longer hold.
- York County population projected at +44% by 2050 — long-run rental-demand tailwind backs the buy-and-hold thesis.
Negotiation context
- Only 8 days on market — expect competitive offers; lowballing is unlikely to land.
- 4 sale attempts since 11y ago with the ask held roughly flat each time — persistent listings suggest the price (not the market) is what's stuck; bring a comps-based counter.
- Current owner paid $48k; list at $172k implies a 255% gain — meaningful room to come down on a strong offer.
Risks & watch-outs
- Watch-outs: built in 1950 — expect roof / HVAC / electrical / plumbing capex.
- Climate carrying-cost: major wind risk, 27% chance of damaging wind over 30y; extreme-heat days projected 7→16/yr by 2055 (HVAC capex compounding) — expect insurance premiums to compound above CPI over the hold.
Questions for the listing agent
- Built in 1950 — when were the roof, HVAC, electrical panel, plumbing, and water heater last replaced?
- Is there a deadline driving the sale (1031 exchange, divorce, estate, relocation)? That informs how much negotiation room exists.
- Schools are D-rated, which usually means shorter tenancies and higher turnover. Who's the typical renter profile here, and what's been the actual vacancy rate?
- Crime grade is D in this area — have there been break-ins, vandalism, or insurance claims at this property in the last 3 years? What carrier currently insures it and at what premium?
- What's the average days-on-market for RENTAL listings here right now (not sales)? A rising rental-DOM trend means longer vacancies and softer asking-rent achievability than the comps imply.
- What's the recent tenant-quality profile in this submarket — average credit score on applications, eviction rate, late-payment / NSF rate, and stable-employment percentage? A property-management company in the area should have these aggregated.
- How much new for-sale + rental construction is in the pipeline within 1–3 miles? Heavy new supply typically softens prices + rents 12–24 months out; constrained supply supports both.
Investment metrics
- 1% rule
- 0.99% ✗
- Cap rate
- 7.63%
- Cash-on-cash
- 4.76%
- DSCR
- 1.21
- GRM
- 8.4
CMA / ARV
- ARV (on-the-fly)
- $285,565
- Comps found
- 12
Show comp detail 12 sales within ~0.75 mi
| Address | Dist | Beds/Ba | Sqft | Sold | Price | $/sf | Match |
|---|---|---|---|---|---|---|---|
| 546 Whitner St | 0.10mi | 3/2.0 (+1) | 1,416 (-1%) | 4mo | $285,000 | $201 | 81 |
| 238 Miller St | 0.15mi | 3/1.0 (+1) | 1,333 (-7%) | 6mo | $185,000 | $139 | 71 |
| 316 Scoggins St | 0.39mi | 3/2.0 (+1) | 1,473 (+3%) | 3mo | $294,900 | $200 | 66 |
| 338 Walnut St | 0.51mi | 3/2.0 (+1) | 1,456 (+2%) | 1mo | $285,000 | $196 | 64 |
| 545 Washington St | 0.12mi | 3/2.0 (+1) | 1,254 (-13%) | 2mo | $270,000 | $215 | 63 |
| 814 Jefferson Ave | 0.32mi | 3/1.0 (+1) | 1,258 (-12%) | 3mo | $210,500 | $167 | 57 |
| 467 Oates St | 0.64mi | 3/2.0 (+1) | 1,413 (-2%) | 4mo | $279,900 | $198 | 56 |
| 515 Oates St | 0.69mi | 3/2.0 (+1) | 1,456 (+2%) | 2mo | $289,900 | $199 | 54 |
| 711 Green St | 0.19mi | 3/2.0 (+1) | 1,231 (-14%) | 7mo | $270,000 | $219 | 53 |
| 420 Baker Street Ext | 0.59mi | 3/1.0 (+1) | 1,350 (-6%) | 8mo | $229,900 | $170 | 51 |
| 541 Oates St | 0.73mi | 3/2.0 (+1) | 1,331 (-7%) | 2mo | $280,000 | $210 | 44 |
| 115 Allen St | 0.74mi | 3/2.5 (+1) | 1,500 (+4%) | 6mo | $255,000 | $170 | 42 |
Match score weights: distance 35% · size 25% · config 20% · recency 20%. Top-matched comps best support the ARV.
Projected returns pro-forma
-3.0% appreciation · 5.53% rent growth · sell at horizon
- IRR
- -6.1%
- Equity multiple
- 0.77×
- Total profit
- $-11,256
- Equity at exit
- $25,646
- IRR
- 6.3%
- Equity multiple
- 1.52×
- Total profit
- $25,086
- Equity at exit
- $14,871
Cash invested: $48,160 (down + closing). Projections, not guarantees.
Landlord ↔ Tenant lean methodology
- Overall (STATE)
- 90 Strongly Landlord-Friendly
- State South Carolina
- 90 Strongly Landlord-Friendly · R+6
- County
- — inherits STATE
- City
- — inherits STATE
ZIP-level market 29730
- Rents YoY
- 5.5%
- Active inventory
- 355
- Price-to-rent
- 8.4×
Monthly cashflow live
- Estimated rent
- $1,702 high interval (Pro) →
- Mortgage (P&I)
- −$902
- Tax from tax record
- −$180 /mo · $2,162/yr
- Insurance
- −$72
- HOA
- −$0
- Vacancy / Maint / Mgmt
- −$358
- Net cashflow
- $191
Break-even live
Sensitivity live
| Price | -10% $288 | -5% $240 | +0% $191 | +5% $142 | +10% $94 |
|---|---|---|---|---|---|
| Rent | -10% $57 | -5% $124 | +0% $191 | +5% $258 | +10% $326 |
| Rate | -1.0pp $278 | -0.5pp $235 | base $191 | +0.5pp $146 | +1.0pp $101 |
UW: 25.0% down · 7.5% · 30yr · 1.5% tax · 5.0% vac · 8.0% maint · 8.0% mgmt
Financing live
Cash to close
- Down payment
- $43,000
- Closing costs
- $5,160
- Reserves months
- —
- Total cash needed
- —
Loan-product check · same deal, 3 products live
Conventional
25% down · 7.5% · 30yr
- Down + closing
- —
- Monthly P&I
- —
- Monthly cashflow
- —
- DSCR
- —
- Eligible?
- —
Personal DTI + credit; lowest rate.
DSCR
20% down · 8.5% · 30yr
- Down + closing
- —
- Monthly P&I
- —
- Monthly cashflow
- —
- DSCR
- —
- Eligible?
- —
No personal income docs; deal must DSCR.
Hard money
10% down · 12.0% · 12mo
- Down + closing
- —
- Monthly P&I
- —
- Monthly cashflow
- —
- DSCR
- —
- Eligible?
- —
Short-term bridge; refi at stabilization.
Rent comps 32 comps
| Address | Beds | Baths | Sqft | Rent | $/sqft | DOM | Units | Dist |
|---|---|---|---|---|---|---|---|---|
| 503 Lucky Ct Rock Hill, SC | 1.0 | 1.0 | 1532 | $795 | $0.52 | 23d | 1 | 0.08mi |
| 503 Lucky Ct Rock Hill, SC | 1.0 | 1.0 | 1532 | $700 | $0.46 | 16d | 1 | 0.08mi |
| 608 Crawford Rd Rock Hill, SC | 3.0 | 2.0 | 1400 | $2,150 | $1.54 | 23d | 1 | 0.12mi |
| 207 Friedheim Rd Rock Hill, SC | 3.0 | 1.0 | 1000 | $1,549 | $1.55 | 4d | 1 | 0.29mi |
| 241 Marion St Rock Hill, SC | 2.0 | 1.0 | 1580 | $1,500 | $0.95 | 6d | 1 | 0.34mi |
| 325 Walnut St Rock Hill, SC | 3.0 | 1.0 | 1602 | $1,495 | $0.93 | 23d | 1 | 0.48mi |
| 175 W Black St Unit 304 Rock Hill, SC | 2.0 | 2.0 | 1248 | $1,685 | $1.35 | 25d | 1 | 0.57mi |
| 175 W Black St Rock Hill, SC | 1.0–2.0 | 1.0–2.0 | 1021 | $1,685 | $1.65 | 21d | 11 | 0.57mi |
| 108 E Main St Rock Hill, SC | 1.0–2.0 | 1.0–2.0 | 779 | $1,893 | $2.43 | 3d | 7 | 0.59mi |
| 244 Rhea St Rock Hill, SC | 2.0 | 1.0 | 1200 | $1,225 | $1.02 | 21d | 1 | 0.60mi |
| 721 S Spruce St Rock Hill, SC | 3.0 | 2.0 | 1250 | $2,050 | $1.64 | 25d | 1 | 0.62mi |
| 309 S Confederate Ave Rock Hill, SC | 3.0 | 2.5 | 1430 | $5,990 | $4.19 | 25d | 1 | 0.65mi |
| 117 E White St Rock Hill, SC | 2.0 | 1.0–2.0 | 797 | $2,065 | $2.59 | 5d | 33 | 0.72mi |
| 333 Friendship Dr Rock Hill, SC | 3.0 | 2.0 | 1158 | $1,460 | $1.26 | 23d | 1 | 0.76mi |
| 645 Stonewall Ct Rock Hill, SC | 3.0 | 1.0 | 1200 | $1,695 | $1.41 | 25d | 1 | 0.87mi |
| 658 Arch Dr Rock Hill, SC | 3.0 | 1.0 | 985 | $1,700 | $1.73 | 6d | 1 | 0.92mi |
| 987 Pebble Rd Rock Hill, SC | 3.0 | 1.0 | 1044 | $1,295 | $1.24 | 25d | 1 | 0.95mi |
| 1547 Caprine CT Rock Hill, SC | 1.0–3.0 | 1.0–2.0 | 959 | $1,478 | $1.54 | 0d | 15 | 0.99mi |
| 371 Technology Center Way Rock Hill, SC | 1.0–2.0 | 1.0–2.0 | 832 | $2,155 | $2.59 | 4d | 37 | 1.00mi |
| 216 McFadden St Rock Hill, SC | 2.0 | 2.0 | 984 | $1,450 | $1.47 | 16d | 1 | 1.03mi |
| 418 Pickens Ct Rock Hill, SC | 2.0 | 2.0 | 1060 | $1,800 | $1.70 | 25d | 1 | 1.03mi |
| 221 Hutchinson St Rock Hill, SC | 2.0 | 1.0 | 1129 | $1,550 | $1.37 | 23d | 1 | 1.12mi |
| 819 Chestnut St Rock Hill, SC | 3.0 | 1.0 | 1014 | $1,800 | $1.78 | 6d | 1 | 1.12mi |
| 304 Oak Dr Rock Hill, SC | 2.0 | 1.0 | 1349 | $1,650 | $1.22 | 25d | 1 | 1.19mi |
| 810 S York Ave Rock Hill, SC | 1.0–3.0 | 1.0 | 787 | $1,249 | $1.59 | 3d | 10 | 1.22mi |
| 923 Standard St Rock Hill, SC | 1.0–2.0 | 1.0 | 1025 | $1,590 | $1.55 | 0d | 4 | 1.27mi |
| 618 Union Ave Rock Hill, SC | 2.0 | 2.0 | 1050 | $1,475 | $1.40 | 17d | 1 | 1.28mi |
| 522 N Jones Ave Rock Hill, SC | 2.0 | 1.0 | 1038 | $1,650 | $1.59 | 23d | 1 | 1.39mi |
| 242 Cherry Rd S Rock Hill, SC | 3.0 | 1.0 | 1599 | $1,650 | $1.03 | 25d | 1 | 1.40mi |
| 226 Cummings St Rock Hill, SC | 2.0 | 1.0 | 914 | $1,599 | $1.75 | 3d | 1 | 1.47mi |
| 316 Piedmont St Rock Hill, SC | 2.0 | 1.5 | 1014 | $1,450 | $1.43 | 6d | 1 | 1.49mi |
| 316 Piedmont St Rock Hill, SC | 2.0 | 1.5 | 1014 | $1,595 | $1.57 | 25d | 1 | 1.49mi |
Listing history 6 events
-
2026-06-21days on market $172,000 Active 8 DOM
-
2026-06-18days on market $172,000 Active 5 DOM
-
2026-06-17days on market $172,000 Active 4 DOM
-
2026-06-16days on market $172,000 Active 3 DOM
-
2026-06-15price $172,000 Active 2 DOM
-
2026-06-15$179,000 Active 2 DOM
ⓘ Source: listings_history table (triggers on properties + properties_extension) + one-shot
backfill from property_details.listing_events for pre-trigger history.
Tax reassessment forecast SC · Resets to sale price
- Current annual tax
- $2,162 · $180/mo
- Projected year-2 tax
- $2,162 · $180/mo
- Expected delta
- $0/yr ($0/mo · 0.0%)
ⓘ Screening estimate from a state-policy table — verify with the county assessor before closing.
Climate risk First Street
- Flood 1/10 Low FEMA zone X (unshaded) · 0% chance over 30 yrs
- Wildfire 3/10 Moderate
- Heat 6/10 Major 7 d/yr ≥105°F today · 16 d/yr by 30 yrs out
- Wind 6/10 Major 27% chance of damaging wind over 30 yrs
- Air quality 3/10 Moderate 2 unhealthy d/yr today · 3 by 30 yrs out
Nearby sold comps map
Loading sold comps map…
Walkable amenities ~0.75 mi
Loading nearby amenities…
Taxation est. · year 1
- Rental income
- $20,429
- − Mortgage interest
- −$9,635
- − Property taxes
- −$2,162
- − Insurance
- −$860
- − Repairs & maintenance
- −$1,634
- − Management
- −$1,634
- − Depreciation
- −$5,004
- Taxable loss
- −$500
- Est. tax savings @ 24.0%
- +$120
- After-tax cash flow
- $2,413/yr
For passive investors: Depreciation is non-cash, so a rental often shows a tax loss while cash-flowing — sheltering income. Rental losses are passive: they offset passive income freely, and up to $25,000/yr can offset ordinary (W-2) income if you actively participate and your MAGI is under $100k (phasing out to $0 by $150k); unused losses carry forward. On sale, claimed depreciation is recaptured at up to 25%, and gains may owe capital-gains tax (a 1031 exchange can defer both). Figures are a year-1 estimate at your 24.0% rate — not tax advice; consult a CPA.
Schools (NCES district)
- District
- York 03
- NCES district ID
- 4503870
- Math proficiency
- 36% ▼ -8.00%
- Reading proficiency
- 47% ▲ 3.00%
- Median HH income
- $47,570
- Composite
- 35.46/100
- National rank
- #4928
- State rank
- #32 of 80 in SC
Livability — Rock Hill
- Score
- 70/100
- State rank
- #62
- US rank
- #7573
Category grades
Schools grade is shown separately in the Schools card above.
Census & demographics
- Census place
- Rock Hill, SC
- County
- York County · 281,758 people
- City population
- 115,874
- Metro
- Charlotte-Concord-Gastonia, NC-SC
- Population (ZIP)
- 58,199
- Household income
- $68,543
- Rent vs Own
- Severe rent burden
- 1869.0
Population outlook (York County) Hauer SSP2
- Today (2025)
- 307,757 people
- By 2030
- 335,979 · +9.2%
- By 2040
- 391,378 · +27.2%
- By 2050
- 443,234 · +44.0%
- By 2075
- 557,102 · +81.0%
- By 2100
- 625,837 · +103.4%
Race, ethnicity, and origin ACS 2023
- Neighborhood character
- Diverse neighborhood (Simpson 0.59)
- Race & ethnicity
- White 51% Black 39% Hispanic / Latino 4% Two or more races 4% Native American 2% Asian 1%
- Common ancestry
- Serbian 2% Slovak 2% Lithuanian 1%
- Foreign-born
- 4% · Canada, Vietnam, China
- Languages at home
- 95% English-only · Spanish 3%
Political lean MEDSL · York
- 2024 margin
- R (+19.1) · D 39.7% · R 58.8% · Other 1.5%
- 2008→2024 swing
- -1.4pp toward R · 2008: -17.7pp · 2024: -19.1pp
- All cycles
- 2024: R+19.1 2020: R+16.5 2016: R+22.1 2012: R+20.5 2008: R+17.7
Not yet ingested
- Civics
- —
Market trends
- HPI YoY
- ▼ -285.91%
- Current HPI
- 268.2609
- Rent YoY
- ▲ 5.53%
- Metro
- Charlotte-Concord-Gastonia, NC-SC
- State GDP YoY
- ▲ 4.51%
- F500 in state
- 2
Industry mix (Fortune 500 HQ in SC)
| Industry | F500 HQs | Revenue |
|---|---|---|
| Packaging | 1 | $7B |
|
||
Price history
+175.4% since first listed11 events — show timeline
- 2026-06-13 Listed $179,000 CANOPYMLS as Distributed by MLS Grid
- 2015-09-28 Sold (Public Records) $48,500 Public Records
- 2015-09-16 Sold (MLS) $48,500 CANOPYMLS as Distributed by MLS Grid
- 2015-09-11 Contingent — CANOPYMLS as Distributed by MLS Grid
- 2015-08-03 Relisted — CANOPYMLS as Distributed by MLS Grid
- 2015-07-21 Contingent — CANOPYMLS as Distributed by MLS Grid
- 2015-07-06 Price Changed $53,000 CANOPYMLS as Distributed by MLS Grid
- 2015-07-06 Relisted — CANOPYMLS as Distributed by MLS Grid
- 2015-06-25 Delisted — CANOPYMLS as Distributed by MLS Grid
- 2015-05-19 Price Changed $54,900 CANOPYMLS as Distributed by MLS Grid
- 2015-02-23 Listed $65,000 CANOPYMLS as Distributed by MLS Grid
Property tax history
+12.5%/yrLatest (2025): $2,162 · +11.7% YoY. Source: county tax records.
Cash-flow waterfall
monthlySold comps — $/sqft
last 12 mo · ≤1 miLoading sold comps…