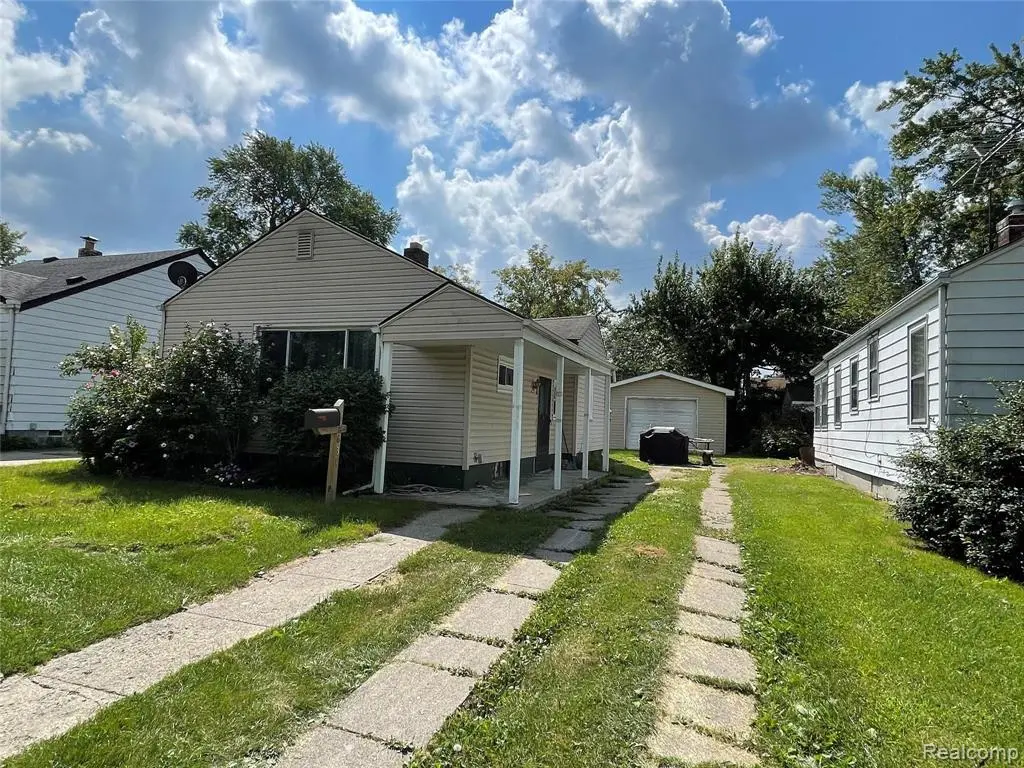
630 E Madison Ave · Pontiac, MI
Flood risk 4/10 · Minor
- FEMA flood zone
- X (unshaded)
- Chance of flooding over 30 yrs
- 0.22%
- Est. flood insurance / yr
- $473 – $860
Fire risk 1/10 · Minimal
- Est. fire insurance / yr
- $784 – $1,456
Heat risk 2/10 · Minimal
- Hot days now (above 96°F)
- 7 days/yr
- Hot days in 30 yrs
- 15 days/yr
Wind risk 2/10 · Minimal
- Chance of severe wind over 30 yrs
- —
Air-quality risk 3/10 · Minor
- Unhealthy air days now
- 2 days/yr
- Unhealthy air days in 30 yrs
- 4 days/yr
Risk factors via First Street. Map © Google.
Why this score? — see what drove the B- grade
The composite is a weighted blend of 9 inputs, each scored 0–100. Each bar is that input's sub-score; the figure is the points it added to the 100-point composite (weight × sub-score).
- Cash flow +30.0/30.0
- DSCR +10.0/10.0
- 1% rule +9.8/10.0
- ARV discount +8.9/15.0
- Rent growth +3.7/5.0
- Livability +3.2/5.0
- Condition / age +2.5/5.0
- Schools +1.0/10.0
- Appreciation +0.0/10.0
$75,000
🖨 Deal sheet 📄 Offer letter ✓ Due diligence
Listing remarks MLS
This is the perfect opportunity for an investor looking to get a great cash flowing property, or a starter home. There is opportunity for a third bedroom and living space in the basement. Bathroom has been redone.
Key facts
- 4,356 sq ft lot
- Garage
- Built 1941
Neighborhood map
What this means for you Summary
Snapshot
- This is a 2-bed/1.0-bath single-family listed at $75k.
Deal economics
- At list price, monthly cash flow is $322 ($4k/yr) — positive.
- The deal already cash-flows at list — no discount required.
- Meets the 1% rule at list price ($1k rent vs $75k).
- Recommended offer: $73k (3.0% below list) — sets the bar for market timing.
- Cap rate 11.4% vs local median 6.7% in Pontiac — top-decile yield for the area; either an underpriced asset or a hidden risk that comps aren't pricing in. Stress-test before assuming the spread holds.
Location & tenants
- Location reads 64/100 on livability (#499 in MI) — a middle-class / working-renter tenant base. Strengths: commute A+, cost of living A+, housing A+; Watch: health & safety D, schools F, crime F.
- Pontiac City School District (urban): math 8% / reading 17% proficiency, ranked #514 of 540 in MI (top 95%) — low school quality limits family demand, transient renter base, plan for 1-2y turnover; 81% free/reduced lunch — lower-income household profile, screen leases tightly.
- Market conditions: Rents rising fast (+4.7%/yr); 83 active listings in the ZIP; 4 comparable units currently listed for rent nearby; rentals lingering (median 44d on market — plan ~5-8 weeks vacancy on turnover, expect pricing pressure); 75% of comp listings sitting > 30 days — soft ceiling on asking rent; 2,614 units permitted in Oakland County in 2024 (721 in 5+ unit buildings).
Forward outlook
- Local home prices are declining (-3.0%/yr); year-one equity from $519 of loan paydown is wiped out by about $2k of value loss. Plan a longer hold.
- Oakland County population projected at +10% by 2050 — modest demand growth; plan on rents tracking national, not racing it.
- At projected returns (-3.0% appreciation + 4.7% rent growth), your $21k cash investment doubles in ~6 years — after that, you're playing with house money.
Negotiation context
- It's been on market 55 days — a 3% lower offer ($73k) is reasonable based on typical stale-listing flexibility.
- 4 sale attempts since 23y ago with the ask held roughly flat each time — persistent listings suggest the price (not the market) is what's stuck; bring a comps-based counter.
- Current owner paid $61k; 23% above their basis — modest negotiation headroom, anchor on the comps not their cost.
Risks & watch-outs
- Watch-outs: built in 1941 — expect roof / HVAC / electrical / plumbing capex.
Questions for the listing agent
- It's been on market 55 days. Have you received any prior offers? Is the seller open to a 3% concession, seller financing, or rate buy-down credit?
- Built in 1941 — when were the roof, HVAC, electrical panel, plumbing, and water heater last replaced?
- Is there a deadline driving the sale (1031 exchange, divorce, estate, relocation)? That informs how much negotiation room exists.
- Schools are F-rated, which usually means shorter tenancies and higher turnover. Who's the typical renter profile here, and what's been the actual vacancy rate?
- Crime grade is F in this area — have there been break-ins, vandalism, or insurance claims at this property in the last 3 years? What carrier currently insures it and at what premium?
- What's the average days-on-market for RENTAL listings here right now (not sales)? A rising rental-DOM trend means longer vacancies and softer asking-rent achievability than the comps imply.
- What's the recent tenant-quality profile in this submarket — average credit score on applications, eviction rate, late-payment / NSF rate, and stable-employment percentage? A property-management company in the area should have these aggregated.
- How much new for-sale + rental construction is in the pipeline within 1–3 miles? Heavy new supply typically softens prices + rents 12–24 months out; constrained supply supports both.
Investment metrics
- 1% rule
- 1.48% ✓
- Cap rate
- 11.44%
- Cash-on-cash
- 18.39%
- DSCR
- 1.82
- GRM
- 5.6
CMA / ARV
- ARV (on-the-fly)
- $77,395
- Comps found
- 7
Show comp detail 7 sales within ~0.75 mi
| Address | Dist | Beds/Ba | Sqft | Sold | Price | $/sf | Match |
|---|---|---|---|---|---|---|---|
| 603 Wesbrook St | 0.10mi | 2/1.0 | 744 (+10%) | 3mo | $155,000 | $208 | 75 |
| 755 Robinwood St | 0.52mi | 2/1.0 | 686 (+2%) | 11mo | $84,000 | $122 | 64 |
| 757 E Tennyson Ave | 0.28mi | 2/1.0 | 731 (+9%) | 12mo | $145,000 | $198 | 63 |
| 670 Scottwood St | 0.60mi | 2/1.0 | 709 (+5%) | 21mo | $65,000 | $92 | 45 |
| 801 Robinwood St | 0.47mi | 2/1.0 | 768 (+14%) | 12mo | $62,000 | $81 | 44 |
| 704 Parkwood Ave | 0.52mi | 2/1.0 | 750 (+11%) | 18mo | $86,500 | $115 | 42 |
| 940 Cameron Ave | 0.68mi | 3/1.0 (+1) | 744 (+10%) | 5mo | $85,000 | $114 | 42 |
Match score weights: distance 35% · size 25% · config 20% · recency 20%. Top-matched comps best support the ARV.
Projected returns pro-forma
-3.0% appreciation · 4.73% rent growth · sell at horizon
- IRR
- 12.1%
- Equity multiple
- 1.49×
- Total profit
- $10,356
- Equity at exit
- $11,183
- IRR
- 22.5%
- Equity multiple
- 3.09×
- Total profit
- $43,958
- Equity at exit
- $6,485
Cash invested: $21,000 (down + closing). Projections, not guarantees.
Landlord ↔ Tenant lean methodology
- Overall (STATE)
- 62 Landlord-Friendly
- State Michigan
- 62 Landlord-Friendly · EVEN
- County
- — inherits STATE
- City
- — inherits STATE
ZIP-level market 48340
- Rents YoY
- 4.7%
- Active inventory
- 83
- Price-to-rent
- 5.6×
Monthly cashflow live
- Estimated rent
- $1,113 medium interval (Pro) →
- Mortgage (P&I)
- −$393
- Tax from tax record
- −$133 /mo · $1,599/yr
- Insurance
- −$31
- HOA
- −$0
- Vacancy / Maint / Mgmt
- −$234
- Net cashflow
- $322
Break-even live
UW: 25.0% down · 7.5% · 30yr · 1.5% tax · 5.0% vac · 8.0% maint · 8.0% mgmt
Financing live
Cash to close
- Down payment
- $18,750
- Closing costs
- $2,250
- Reserves months
- —
- Total cash needed
- —
Loan-product check · same deal, 3 products live
Conventional
25% down · 7.5% · 30yr
- Down + closing
- —
- Monthly P&I
- —
- Monthly cashflow
- —
- DSCR
- —
- Eligible?
- —
Personal DTI + credit; lowest rate.
DSCR
20% down · 8.5% · 30yr
- Down + closing
- —
- Monthly P&I
- —
- Monthly cashflow
- —
- DSCR
- —
- Eligible?
- —
No personal income docs; deal must DSCR.
Hard money
10% down · 12.0% · 12mo
- Down + closing
- —
- Monthly P&I
- —
- Monthly cashflow
- —
- DSCR
- —
- Eligible?
- —
Short-term bridge; refi at stabilization.
Rent comps 4 comps
| Address | Beds | Baths | Sqft | Rent | $/sqft | DOM | Units | Dist |
|---|---|---|---|---|---|---|---|---|
| 957 Perry St Pontiac, MI | 1.0–3.0 | 1.0 | 835 | $974 | $1.17 | 44d | 1 | 0.36mi |
| 76 N Merrimac St Pontiac, MI | 2.0 | 1.0 | 633 | $1,450 | $2.29 | 44d | 1 | 1.33mi |
| 105 S Merrimac St Pontiac, MI | 2.0 | 1.0 | 625 | $825 | $1.32 | 22d | 1 | 1.40mi |
| 97 Fairgrove St Apt 3 Pontiac, MI | 1.0 | 1.0 | 600 | $1,000 | $1.67 | 44d | 1 | 1.46mi |
Listing history 20 events
-
2025-06-27status Pending
-
2025-06-11status Pending
-
2025-03-25historical
-
2024-12-17status Pending
-
2022-01-13soldstatus $61,000
-
2021-10-25status Pending 213-char remark
Show marketing remark (213 chars)
This is the perfect opportunity for an investor looking to get a great cash flowing property, or a starter home. There is opportunity for a third bedroom and living space in the basement. Bathroom has been redone.
-
2021-10-25status Pending
Show marketing remark (213 chars)
This is the perfect opportunity for an investor looking to get a great cash flowing property, or a starter home. There is opportunity for a third bedroom and living space in the basement. Bathroom has been redone.
-
2021-10-20historical
-
2021-08-31$75,000 Active
Show marketing remark (213 chars)
This is the perfect opportunity for an investor looking to get a great cash flowing property, or a starter home. There is opportunity for a third bedroom and living space in the basement. Bathroom has been redone.
-
2021-08-31$75,000 Active 213-char remark
Show marketing remark (213 chars)
This is the perfect opportunity for an investor looking to get a great cash flowing property, or a starter home. There is opportunity for a third bedroom and living space in the basement. Bathroom has been redone.
-
2009-04-27soldstatus $10,000 398-char remark
Show marketing remark (398 chars)
Purchase for as little as 3% down! Property approved for HomePath Mtg/Renovation Mtg. Contact LA for info. Measurements are estimated-buyers and BA to verify all info. EMD will be held with LO. Addenda required along with proof of funds or pre-approval. Commission will be paid on sales price minus concessions. BA needs to verify taxes and homestead status. * Download addenda/disclosures online *
-
2009-03-20$12,900 398-char remark
Show marketing remark (398 chars)
Purchase for as little as 3% down! Property approved for HomePath Mtg/Renovation Mtg. Contact LA for info. Measurements are estimated-buyers and BA to verify all info. EMD will be held with LO. Addenda required along with proof of funds or pre-approval. Commission will be paid on sales price minus concessions. BA needs to verify taxes and homestead status. * Download addenda/disclosures online *
-
2003-06-30soldstatus $64,500
-
2003-05-09soldstatus $64,500
-
2003-04-18historical
-
2003-03-25$65,900
-
1994-11-29soldstatus $36,500
-
1994-11-29soldstatus $35,000
-
1990-09-17soldstatus $30,000
-
1984-04-17soldstatus $18,000
ⓘ Source: listings_history table (triggers on properties + properties_extension) + one-shot
backfill from property_details.listing_events for pre-trigger history.
Tax reassessment forecast MI · Partial reset (capped growth)
- Current annual tax
- $1,599 · $133/mo
- Projected year-2 tax
- $1,599 · $133/mo
- Expected delta
- $0/yr ($0/mo · 0.0%)
ⓘ Screening estimate from a state-policy table — verify with the county assessor before closing.
Climate risk First Street
- Flood 4/10 Moderate FEMA zone X (unshaded) · 22% chance over 30 yrs
- Wildfire 1/10 Low
- Heat 2/10 Low 7 d/yr ≥96°F today · 15 d/yr by 30 yrs out
- Wind 2/10 Low
- Air quality 3/10 Moderate 2 unhealthy d/yr today · 4 by 30 yrs out
Nearby sold comps map
Loading sold comps map…
Walkable amenities ~0.75 mi
Loading nearby amenities…
Taxation est. · year 1
- Rental income
- $13,361
- − Mortgage interest
- −$4,201
- − Property taxes
- −$1,599
- − Insurance
- −$375
- − Repairs & maintenance
- −$1,069
- − Management
- −$1,069
- − Depreciation
- −$2,182
- Taxable income
- $2,867
- Est. tax owed @ 24.0%
- −$688
- After-tax cash flow
- $3,174/yr
For passive investors: Depreciation is non-cash, so a rental often shows a tax loss while cash-flowing — sheltering income. Rental losses are passive: they offset passive income freely, and up to $25,000/yr can offset ordinary (W-2) income if you actively participate and your MAGI is under $100k (phasing out to $0 by $150k); unused losses carry forward. On sale, claimed depreciation is recaptured at up to 25%, and gains may owe capital-gains tax (a 1031 exchange can defer both). Figures are a year-1 estimate at your 24.0% rate — not tax advice; consult a CPA.
Schools (NCES district)
- District
- Pontiac City School District
- NCES district ID
- 2628740
- Math proficiency
- 8% ▼ -5.00%
- Reading proficiency
- 17% ▼ -3.00%
- Median HH income
- $33,888
- Composite
- 10.12/100
- National rank
- #9802
- State rank
- #514 of 540 in MI
Livability — Pontiac
- Score
- 64/100
- State rank
- #499
- US rank
- #14703
Category grades
Schools grade is shown separately in the Schools card above.
Census & demographics
- Census place
- Pontiac, MI
- County
- Oakland County · 1,009,092 people
- City population
- 44,593
- Metro
- Detroit-Warren-Dearborn, MI
- Population (ZIP)
- 25,669
- Household income
- $47,891
- Rent vs Own
- Severe rent burden
- 1460.0
Population outlook (Oakland County) Hauer SSP2
- Today (2025)
- 1,335,747 people
- By 2030
- 1,375,100 · +2.9%
- By 2040
- 1,435,385 · +7.5%
- By 2050
- 1,469,250 · +10.0%
- By 2075
- 1,531,946 · +14.7%
- By 2100
- 1,450,485 · +8.6%
Race, ethnicity, and origin ACS 2023
- Neighborhood character
- Highly diverse neighborhood (Simpson 0.73)
- Race & ethnicity
- Black 31% Hispanic / Latino 31% White 29% Two or more races 22% Asian 4%
- Hispanic origin (detail)
- Mexican 18% Puerto Rican 7%
- Common ancestry
- Lithuanian 2% Romanian 2% Serbian 1%
- Foreign-born
- 11% · Canada, China
- Languages at home
- 74% English-only · Spanish 23% Other Asian/Pacific 2% Chinese 1%
Political lean MEDSL · Oakland
- 2024 margin
- D (+10.6) · D 54.4% · R 43.8% · Other 1.9%
- 2008→2024 swing
- -3.9pp toward R · 2008: 14.5pp · 2024: 10.6pp
- All cycles
- 2024: D+10.6 2020: D+14.1 2016: D+8.1 2012: D+8.1 2008: D+14.5
Not yet ingested
- Civics
- —
Market trends
- HPI YoY
- ▼ -295.80%
- Current HPI
- 177.961
- Rent YoY
- ▲ 4.73%
- Metro
- Detroit-Warren-Dearborn, MI
- State GDP YoY
- ▲ 1.37%
- F500 in state
- 28
Industry mix (Fortune 500 HQ in MI)
| Industry | F500 HQs | Revenue |
|---|---|---|
| Automotive Parts | 3 | $48B |
|
||
| Automotive | 2 | $372B |
|
||
| Chemicals | 1 | $45B |
|
||
| Automotive Retail | 1 | $29B |
|
||
| Healthcare / Medical Devices | 1 | $23B |
|
||
| Automotive Technology | 1 | $20B |
|
||
Price history
+238.9% since first listed20 events — show timeline
- 2025-06-27 Pending — REALCOMP
- 2025-06-11 Pending — REALCOMP
- 2025-03-25 Listing Removed — REALCOMP
- 2024-12-17 Pending — REALCOMP
- 2022-01-13 Sold (Public Records) $61,000 Public Records
- 2021-10-25 Pending — MiRealSource-MiMLS
- 2021-10-25 Pending — REALCOMP
- 2021-10-20 Listing Removed — REALCOMP
- 2021-08-31 Listed $75,000 MiRealSource-MiMLS
- 2021-08-31 Listed $75,000 REALCOMP
- 2009-04-27 Sold (MLS) $10,000 REALCOMP
- 2009-03-20 Listed $12,900 REALCOMP
- 2003-06-30 Sold (Public Records) $64,500 Public Records
- 2003-05-09 Sold (MLS) $64,500 MiRealSource-MiMLS
- 2003-04-18 Listing Removed — MiRealSource-MiMLS
- 2003-03-25 Listed $65,900 MiRealSource-MiMLS
- 1994-11-29 Sold (Public Records) $35,000 Public Records
- 1994-11-29 Sold (Public Records) $36,500 Public Records
- 1990-09-17 Sold (Public Records) $30,000 Public Records
- 1984-04-17 Sold (Public Records) $18,000 Public Records
Property tax history
+8.8%/yrLatest (2025): $1,599 · +2.8% YoY. Source: county tax records.
Cash-flow waterfall
monthlySold comps — $/sqft
last 12 mo · ≤1 miLoading sold comps…