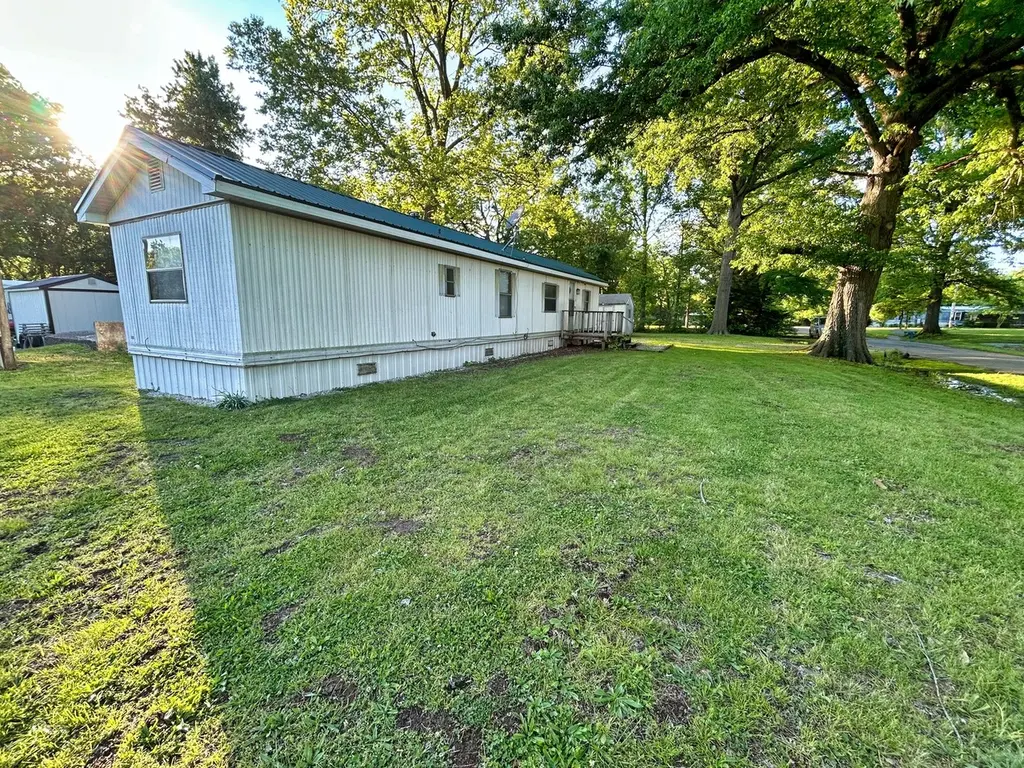
518 Locust St · Xenia, IL
Flood risk 1/10 · Minimal
- FEMA flood zone
- —
- Chance of flooding over 30 yrs
- 0.0%
- Est. flood insurance / yr
- —
Fire risk 1/10 · Minimal
- Est. fire insurance / yr
- $804 – $1,492
Heat risk 4/10 · Minor
- Hot days now (above 105°F)
- 7 days/yr
- Hot days in 30 yrs
- 20 days/yr
Wind risk 2/10 · Minimal
- Chance of severe wind over 30 yrs
- 2.0%
Air-quality risk 2/10 · Minimal
- Unhealthy air days now
- 0 days/yr
- Unhealthy air days in 30 yrs
- 1 days/yr
Risk factors via First Street. Map © Google.
Why this score? — see what drove the B grade
The composite is a weighted blend of 9 inputs, each scored 0–100. Each bar is that input's sub-score; the figure is the points it added to the 100-point composite (weight × sub-score).
- Cash flow +30.0/30.0
- 1% rule +10.0/10.0
- DSCR +10.0/10.0
- ARV discount +7.6/15.0
- Appreciation +7.0/10.0
- Livability +2.9/5.0
- Rent growth +2.5/5.0
- Condition / age +2.5/5.0
- Schools +2.3/10.0
$35,900
🖨 Deal sheet 📄 Offer letter ✓ Due diligence
Key facts
- 7,405 sq ft lot
- 2 parking spots
- Built 1977
Property features AI
Finance
- Other: Property located in unincorporated area
- HOA & community: No master association fee required
Exterior
- Parking: Two parking spaces total; Gravel driveway (owned)
- Utilities: Public water; Public sewer
- Home design: Detached single manufactured home; Fee simple ownership; Not currently leased; Built before 1978
- Construction: Metal roof; Steel siding; Block and pillar/post/pier foundation; Estimated age: 41–50 years
- Exterior features: Porch; Lot dimensions approximately 60 x 120; Lot smaller than 0.25 acre; School bus service available
Interior
- Kitchen: Kitchen on main level (12 x 11)
- Bedrooms: 2 bedrooms (both on main level); Master bedroom on main level
- Flooring: Vinyl flooring in living room and one bedroom; Carpet in master bedroom
- Bathrooms: 1 full bathroom (no tub)
- Heating & cooling: Natural gas forced air heating; Window air conditioning unit(s)
- Interior features: Four total rooms; Porch
- Laundry & utility: Laundry room; Electric dryer hookup
Neighborhood map
What this means for you Summary
Snapshot
- This is a 2-bed/1.0-bath single-family listed at $36k.
Deal economics
- At list price, monthly cash flow is $409 ($5k/yr) — positive.
- The deal already cash-flows at list — no discount required.
- Meets the 1% rule at list price ($825 rent vs $36k).
Location & tenants
- Location reads 57/100 on livability (#1,169 in IL) — a working-class tenant base; expect higher turnover. Strengths: cost of living A+, housing A+; Watch: crime D-, amenities F, commute F.
- Flora CUSD 35 (town): math 17% / reading 37% proficiency, ranked #299 of 620 in IL (top 48%) — low school quality limits family demand, transient renter base, plan for 1-2y turnover.
- Zoned schools: Flora Elementary School (math 21% / reading 37%, grade F, #727 of 2,056 statewide, top 36%, 681 students, 0% FRL); Flora High School (math 8% / reading 17%, grade F, #506 of 693 statewide, top 74%, 375 students, 0% FRL) — zoned schools average 0% FRL vs 45% district-wide (45 pts lower); this property's tenant base skews higher-income than the district average.
- Market conditions: 8 active listings in the ZIP; 2 units permitted in Clay County in 2024 (0 in 5+ unit buildings).
Forward outlook
- In year one you build about $2k of equity ($248 loan paydown + $1k appreciation (4.0% local appreciation)).
- Clay County population projected at -23% by 2050 — secular population decline; favor cash flow + early exit over multi-decade hold.
- At projected returns (4.0% appreciation + 3.0% rent growth), your $10k cash investment doubles in ~2 years — after that, you're playing with house money.
Negotiation context
- Only 3 days on market — expect competitive offers; lowballing is unlikely to land.
- 2 sale attempts since 23y ago with the ask held roughly flat each time — persistent listings suggest the price (not the market) is what's stuck; bring a comps-based counter.
- Current owner paid $14k; list at $36k implies a 156% gain — meaningful room to come down on a strong offer.
Questions for the listing agent
- Built in 1977 — when were the roof, HVAC, electrical panel, plumbing, and water heater last replaced?
- Is there a deadline driving the sale (1031 exchange, divorce, estate, relocation)? That informs how much negotiation room exists.
- Schools are F-rated, which usually means shorter tenancies and higher turnover. Who's the typical renter profile here, and what's been the actual vacancy rate?
- Crime grade is D in this area — have there been break-ins, vandalism, or insurance claims at this property in the last 3 years? What carrier currently insures it and at what premium?
- What's the average days-on-market for RENTAL listings here right now (not sales)? A rising rental-DOM trend means longer vacancies and softer asking-rent achievability than the comps imply.
- What's the recent tenant-quality profile in this submarket — average credit score on applications, eviction rate, late-payment / NSF rate, and stable-employment percentage? A property-management company in the area should have these aggregated.
- How much new for-sale + rental construction is in the pipeline within 1–3 miles? Heavy new supply typically softens prices + rents 12–24 months out; constrained supply supports both.
Investment metrics
- 1% rule
- 2.30% ✓
- Cap rate
- 19.95%
- Cash-on-cash
- 48.79%
- DSCR
- 3.17
- GRM
- 3.6
CMA / ARV
- ARV (on-the-fly)
- $36,000
- Comps found
- 2
Show comp detail 2 sales within ~0.75 mi
| Address | Dist | Beds/Ba | Sqft | Sold | Price | $/sf | Match |
|---|---|---|---|---|---|---|---|
| 518 Locust St | 0.00mi | 2/1.0 | 720 (0%) | 0mo | $35,900 | $50 | 100 |
| 320 Front St | 0.24mi | 2/— | 760 (+6%) | 22mo | $15,000 | $20 | 61 |
Match score weights: distance 35% · size 25% · config 20% · recency 20%. Top-matched comps best support the ARV.
Projected returns pro-forma
4.03% appreciation · 3.0% rent growth · sell at horizon
- IRR
- 55.3%
- Equity multiple
- 4.22×
- Total profit
- $32,368
- Equity at exit
- $18,275
- IRR
- 53.9%
- Equity multiple
- 8.60×
- Total profit
- $76,397
- Equity at exit
- $29,948
Cash invested: $10,052 (down + closing). Projections, not guarantees.
Landlord ↔ Tenant lean methodology
- Overall (STATE)
- 43 Moderately Tenant-Leaning
- State Illinois
- 43 Moderately Tenant-Leaning · D+7
- County
- — inherits STATE
- City
- — inherits STATE
ZIP-level market 62899
- Home prices YoY
- 3.2%
- Active inventory
- 8
- Price-to-rent
- 3.6×
Monthly cashflow live
- Estimated rent
- $825 medium interval (Pro) →
- Mortgage (P&I)
- −$188
- Tax from tax record
- −$40 /mo · $483/yr
- Insurance
- −$15
- HOA
- −$0
- Vacancy / Maint / Mgmt
- −$173
- Net cashflow
- $409
Break-even live
UW: 25.0% down · 7.5% · 30yr · 1.5% tax · 5.0% vac · 8.0% maint · 8.0% mgmt
Financing live
Cash to close
- Down payment
- $8,975
- Closing costs
- $1,077
- Reserves months
- —
- Total cash needed
- —
Loan-product check · same deal, 3 products live
Conventional
25% down · 7.5% · 30yr
- Down + closing
- —
- Monthly P&I
- —
- Monthly cashflow
- —
- DSCR
- —
- Eligible?
- —
Personal DTI + credit; lowest rate.
DSCR
20% down · 8.5% · 30yr
- Down + closing
- —
- Monthly P&I
- —
- Monthly cashflow
- —
- DSCR
- —
- Eligible?
- —
No personal income docs; deal must DSCR.
Hard money
10% down · 12.0% · 12mo
- Down + closing
- —
- Monthly P&I
- —
- Monthly cashflow
- —
- DSCR
- —
- Eligible?
- —
Short-term bridge; refi at stabilization.
Listing history 10 events
-
2026-05-12status Pending
-
2026-05-07$35,900 Active
-
2023-03-29soldstatus $14,000
-
2021-08-06historical
-
2021-08-06historical
-
2021-08-06historical
-
2014-12-10historical
-
2004-10-06soldstatus $17,500
-
2003-03-06$22,500
-
2002-07-13historical
ⓘ Source: listings_history table (triggers on properties + properties_extension) + one-shot
backfill from property_details.listing_events for pre-trigger history.
Tax reassessment forecast IL · Partial reset (capped growth)
- Current annual tax
- $483 · $40/mo
- Projected year-2 tax
- $649 · $54/mo
- Expected delta
- +$166/yr (+$14/mo · 34.4%)
ⓘ Screening estimate from a state-policy table — verify with the county assessor before closing.
Climate risk First Street
- Flood 1/10 Low 0% chance over 30 yrs
- Wildfire 1/10 Low
- Heat 4/10 Moderate 7 d/yr ≥105°F today · 20 d/yr by 30 yrs out
- Wind 2/10 Low 2% chance of damaging wind over 30 yrs
- Air quality 2/10 Low 0 unhealthy d/yr today · 1 by 30 yrs out
Nearby sold comps map
Loading sold comps map…
Walkable amenities ~0.75 mi
Loading nearby amenities…
Taxation est. · year 1
- Rental income
- $9,906
- − Mortgage interest
- −$2,011
- − Property taxes
- −$483
- − Insurance
- −$180
- − Repairs & maintenance
- −$792
- − Management
- −$792
- − Depreciation
- −$1,044
- Taxable income
- $4,603
- Est. tax owed @ 24.0%
- −$1,105
- After-tax cash flow
- $3,799/yr
For passive investors: Depreciation is non-cash, so a rental often shows a tax loss while cash-flowing — sheltering income. Rental losses are passive: they offset passive income freely, and up to $25,000/yr can offset ordinary (W-2) income if you actively participate and your MAGI is under $100k (phasing out to $0 by $150k); unused losses carry forward. On sale, claimed depreciation is recaptured at up to 25%, and gains may owe capital-gains tax (a 1031 exchange can defer both). Figures are a year-1 estimate at your 24.0% rate — not tax advice; consult a CPA.
Schools (NCES district)
- District
- Flora CUSD 35
- NCES district ID
- 1715400
- Math proficiency
- 17% ▼ -4.00%
- Reading proficiency
- 37% ▼ -3.00%
- Median HH income
- $41,463
- Composite
- 22.82/100
- National rank
- #8018
- State rank
- #299 of 620 in IL
Livability — Xenia
- Score
- 57/100
- State rank
- #1169
- US rank
- #22001
Category grades
Schools grade is shown separately in the Schools card above.
Census & demographics
- Census place
- Xenia, IL
- Population (ZIP)
- 1,782
Population outlook (Clay County) Hauer SSP2
- Today (2025)
- 12,388 people
- By 2030
- 11,808 · -4.7%
- By 2040
- 10,644 · -14.1%
- By 2050
- 9,500 · -23.3%
- By 2075
- 6,985 · -43.6%
- By 2100
- 4,811 · -61.2%
Race, ethnicity, and origin ACS 2023
- Neighborhood character
- Predominantly White (97%)
- Race & ethnicity
- White 97% Two or more races 3% Hispanic / Latino 2%
- Common ancestry
- Slovak 3% Romanian 3% Serbian 1%
- Foreign-born
- 0%
- Languages at home
- 92% English-only · German/W. Germanic 6% Spanish 2%
Political lean MEDSL · Clay
- 2024 margin
- Solid R (+67.3) · D 15.6% · R 82.9% · Other 1.5%
- 2008→2024 swing
- -44.1pp toward R · 2008: -23.3pp · 2024: -67.3pp
- All cycles
- 2024: R+67.3 2020: R+65.2 2016: R+63.6 2012: R+44.1 2008: R+23.3
Not yet ingested
- Civics
- —
Market trends
- HPI YoY
- ▲ 4.03%
- Current HPI
- 130.1215
- Rent YoY
- —
- Metro
- —
- State GDP YoY
- ▲ 1.59%
- F500 in state
- 60
Industry mix (Fortune 500 HQ in IL)
| Industry | F500 HQs | Revenue |
|---|---|---|
| Insurance | 4 | $201B |
|
||
| Consumer Goods | 4 | $87B |
|
||
| Industrial Machinery | 3 | $64B |
|
||
| Healthcare | 2 | $55B |
|
||
| Retail / Pharmacy | 1 | $148B |
|
||
| Agriculture / Food | 1 | $86B |
|
||
Price history
+59.6% since first listed10 events — show timeline
- 2026-05-12 Pending — MRED as Distributed by MLS Grid
- 2026-05-07 Listed $35,900 MRED as Distributed by MLS Grid
- 2023-03-29 Sold (Public Records) $14,000 Public Records
- 2021-08-06 Listing Removed — RMLSA as Distributed by MLS Grid
- 2021-08-06 Listing Removed — RMLSA as Distributed by MLS Grid
- 2021-08-06 Listing Removed — RMLSA as Distributed by MLS Grid
- 2014-12-10 Listing Removed — MRED as Distributed by MLS Grid
- 2004-10-06 Sold (MLS) $17,500 RMLSA as Distributed by MLS Grid
- 2003-03-06 Listed $22,500 RMLSA as Distributed by MLS Grid
- 2002-07-13 Listing Removed — MRED as Distributed by MLS Grid
Property tax history
+3.3%/yrLatest (2024): $483 · +2232.1% YoY. Source: county tax records.
Cash-flow waterfall
monthlySold comps — $/sqft
last 12 mo · ≤1 miLoading sold comps…