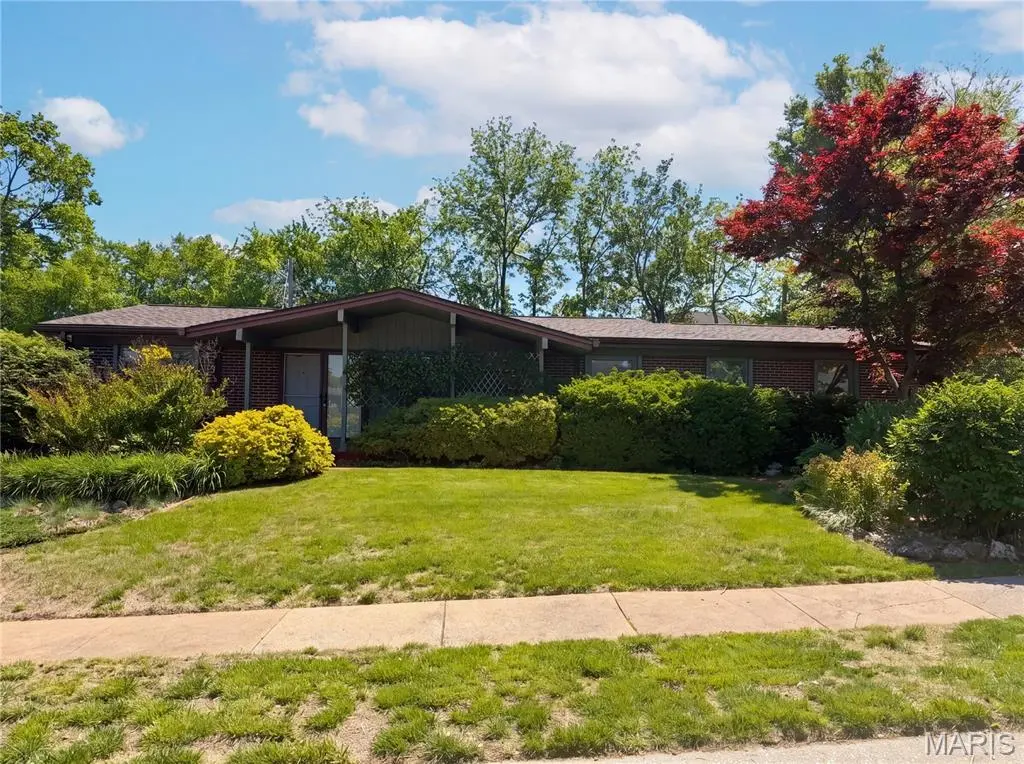
1440 Tina Dr · Florissant, MO
Flood risk 1/10 · Minimal
- FEMA flood zone
- X (unshaded)
- Chance of flooding over 30 yrs
- 0.0%
- Est. flood insurance / yr
- $473 – $860
Fire risk 1/10 · Minimal
- Est. fire insurance / yr
- $1,054 – $1,958
Heat risk 4/10 · Minor
- Hot days now (above 106°F)
- 7 days/yr
- Hot days in 30 yrs
- 21 days/yr
Wind risk 2/10 · Minimal
- Chance of severe wind over 30 yrs
- 1.0%
Air-quality risk 3/10 · Minor
- Unhealthy air days now
- 3 days/yr
- Unhealthy air days in 30 yrs
- 5 days/yr
Risk factors via First Street. Map © Google.
Why this score? — see what drove the C- grade
The composite is a weighted blend of 9 inputs, each scored 0–100. Each bar is that input's sub-score; the figure is the points it added to the 100-point composite (weight × sub-score).
- ARV discount +15.0/15.0
- Cash flow +10.1/30.0
- Appreciation +10.0/10.0
- Rent growth +4.4/5.0
- Livability +3.7/5.0
- DSCR +2.9/10.0
- 1% rule +2.5/10.0
- Condition / age +2.5/5.0
- Schools +1.2/10.0
$250,000
🖨 Deal sheet 📄 Offer letter ✓ Due diligence
Listing remarks MLS
Brick Ranch w/Rear Entry Garage in Majestic Tree Shaded Paddock Estates * Winner of "Florissant Garden of the Month" for May * Home boasts: Large Covered Front Porch, Hardwood Floors, Hard Surface Kitchen counters, Beautiful Wood burning Fireplace with Granite Hearth, Crown Molding, Updated Cultured Marble Bathrooms, Enclosed Sun Room with Skylight, Garage Opener & extra parking Pads in rear, Huge Partially Finished LL - All this under a New Roof installation 2017 * Check out this Awesome home - Pride in Ownership here!
Key facts
- Prominent fireplace
- Covered patio
- Fresh interior paint
Tags
Property features AI
Finance
- Other: Home warranty included; Seller may consider concessions
Exterior
- Parking: Detached 2-car garage
- Utilities: Public water; Public sewer; Electric service (other)
- Home design: Single-family residence; One level
- Construction: Other construction materials
- Exterior features: Private ownership; Lot dimensions approximately 80 x 121; Lot includes non-specified other features
Interior
- Bedrooms: Three bedrooms on the main level
- Bathrooms: Two full bathrooms on the main level
- Heating & cooling: Forced air heating (natural gas); Electric cooling
- Interior features: Partial basement; Wood-burning fireplace (1)
Neighborhood map
What this means for you Summary
Snapshot
- This is a 3-bed/2.0-bath single-family listed at $250k.
Deal economics
- At list price, monthly cash flow is $-144 ($-2k/yr) — negative.
- To cash-flow at today's rent, offer at most $225k (10.2% below list).
- To meet the 1% rule (rent ≥ 1% of price), the offer needs to be $188k (24.7% below list).
- Recommended offer: $188k (24.7% below list) — sets the bar for 1% rule.
Location & tenants
- Location reads 73/100 on livability (#82 in MO) — a middle-class / working-renter tenant base. Strengths: cost of living A+, housing A+, health & safety B+; Watch: crime C-, amenities D+, commute F.
- Ferguson-Florissant R-II (suburban): math 7% / reading 20% proficiency, ranked #311 of 324 in MO (top 96%) — low school quality limits family demand, transient renter base, plan for 1-2y turnover; 70% free/reduced lunch — lower-income household profile, screen leases tightly.
- Zoned schools: Commons Lane Elementary (291 students, 99% FRL); Mccluer North High (math 5% / reading 28%, grade F, #487 of 521 statewide, top 93%, 1,136 students, 100% FRL) — zoned schools average 99% FRL vs 70% district-wide (30 pts higher); higher-poverty schools than district average — tighter screening recommended.
- Market conditions: Rents rising fast (+7.5%/yr); 218 active listings in the ZIP; 12 comparable units currently listed for rent nearby; rentals at typical pace (median 17d on market — plan ~3-4 weeks tenant-placement turnaround); 920 units permitted in St. Louis County in 2024 (250 in 5+ unit buildings).
- This rent runs 34% of the median local income ($67k/yr) — at the standard rent-burdened threshold; future hikes will face affordability resistance.
Forward outlook
- In year one you build about $27k of equity ($2k loan paydown + $25k appreciation (10.0% local appreciation)).
- By year 2, paydown + projected appreciation supports a ~$43k cash-out refi (75% LTV) — recoverable capital for the next deal without selling this one.
Negotiation context
- It's been on market 33 days — a 3% lower offer ($242k) is reasonable based on typical stale-listing flexibility.
- 2 sale attempts since 8y ago; this cycle's ask has dropped $16k (6%) from the opening price — seller is motivated, your offer sets the floor, not the list.
Questions for the listing agent
- What do current leases actually rent for vs. the listed asking? Can we see a recent rent roll and the last 12 months of T-12 income?
- It's been on market 33 days. Have you received any prior offers? Is the seller open to a 25% concession, seller financing, or rate buy-down credit?
- Built in 1964 — when were the roof, HVAC, electrical panel, plumbing, and water heater last replaced?
- Is there a deadline driving the sale (1031 exchange, divorce, estate, relocation)? That informs how much negotiation room exists.
- Schools are D-rated, which usually means shorter tenancies and higher turnover. Who's the typical renter profile here, and what's been the actual vacancy rate?
- What's the average days-on-market for RENTAL listings here right now (not sales)? A rising rental-DOM trend means longer vacancies and softer asking-rent achievability than the comps imply.
- What's the recent tenant-quality profile in this submarket — average credit score on applications, eviction rate, late-payment / NSF rate, and stable-employment percentage? A property-management company in the area should have these aggregated.
- How much new for-sale + rental construction is in the pipeline within 1–3 miles? Heavy new supply typically softens prices + rents 12–24 months out; constrained supply supports both.
Investment metrics
- 1% rule
- 0.75% ✗
- Cap rate
- 5.60%
- Cash-on-cash
- -2.47%
- DSCR
- 0.89
- GRM
- 11.1
CMA / ARV
- ARV (median comp)
- $330,897
- List price
- $250,000
- Delta
- -24.45%
- Verdict
- UNDERPRICED
- Comps
- 20 within 1.0 mi
Show comp detail 12 sales within ~0.75 mi
| Address | Dist | Beds/Ba | Sqft | Sold | Price | $/sf | Match |
|---|---|---|---|---|---|---|---|
| 35 Wild Ridge/hazeltine | 0.21mi | 3/2.0 | 1,612 (-1%) | 1mo | $317,742 | $197 | 87 |
| Lot 8 Wild Ridge/ Hazeltine | 0.21mi | 3/2.0 | 1,612 (-1%) | 6mo | $334,967 | $208 | 82 |
| 33 Club Grounds South Dr | 0.12mi | 3/3.0 | 1,771 (+8%) | 1mo | $235,000 | $133 | 76 |
| Lot 6 Wildridge Ests | 0.09mi | 3/2.0 | 1,826 (+12%) | 6mo | $369,900 | $203 | 71 |
| 3940 Parker Rd | 0.42mi | 3/1.5 | 1,705 (+4%) | 4mo | $182,000 | $107 | 68 |
| 4359 Blythewood Dr | 0.44mi | 3/3.0 | 1,684 (+3%) | 5mo | $250,000 | $148 | 66 |
| 4424 Cloverbrook Dr | 0.41mi | 3/2.0 | 1,521 (-7%) | 5mo | $249,900 | $164 | 65 |
| 3680 Pyrenees Dr | 0.52mi | 3/2.0 | 1,703 (+4%) | 6mo | $234,900 | $138 | 64 |
| 1 Club Grounds North Dr | 0.36mi | 3/2.0 | 1,426 (-13%) | 4mo | $209,900 | $147 | 58 |
| 12870 Old Halls Ferry Rd | 0.58mi | 3/2.0 | 1,761 (+8%) | 6mo | $225,000 | $128 | 55 |
| 1480 Surrey Dr | 0.48mi | 3/2.0 | 1,415 (-14%) | 5mo | $139,900 | $99 | 51 |
| 2010 Cordoba Dr | 0.61mi | 3/2.0 | 1,436 (-12%) | 2mo | $229,900 | $160 | 50 |
Match score weights: distance 35% · size 25% · config 20% · recency 20%. Top-matched comps best support the ARV.
Projected returns pro-forma
10.0% appreciation · 7.51% rent growth · sell at horizon
- IRR
- 23.9%
- Equity multiple
- 2.94×
- Total profit
- $135,864
- Equity at exit
- $225,220
- IRR
- 22.3%
- Equity multiple
- 7.13×
- Total profit
- $428,951
- Equity at exit
- $485,695
Cash invested: $70,000 (down + closing). Projections, not guarantees.
Landlord ↔ Tenant lean methodology
- Overall (STATE)
- 81 Strongly Landlord-Friendly
- State Missouri
- 81 Strongly Landlord-Friendly · R+10
- County
- — inherits STATE
- City
- — inherits STATE
ZIP-level market 63033
- Home prices YoY
- 2.5%
- Rents YoY
- 7.5%
- Active inventory
- 218
- Price-to-rent
- 11.1×
Monthly cashflow live
- Estimated rent
- $1,881 high interval (Pro) →
- Mortgage (P&I)
- −$1,311
- Tax from tax record
- −$215 /mo · $2,584/yr
- Insurance
- −$104
- HOA
- −$0
- Vacancy / Maint / Mgmt
- −$395
- Net cashflow
- $-144
Break-even live
UW: 25.0% down · 7.5% · 30yr · 1.5% tax · 5.0% vac · 8.0% maint · 8.0% mgmt
Financing live
Cash to close
- Down payment
- $62,500
- Closing costs
- $7,500
- Reserves months
- —
- Total cash needed
- —
Loan-product check · same deal, 3 products live
Conventional
25% down · 7.5% · 30yr
- Down + closing
- —
- Monthly P&I
- —
- Monthly cashflow
- —
- DSCR
- —
- Eligible?
- —
Personal DTI + credit; lowest rate.
DSCR
20% down · 8.5% · 30yr
- Down + closing
- —
- Monthly P&I
- —
- Monthly cashflow
- —
- DSCR
- —
- Eligible?
- —
No personal income docs; deal must DSCR.
Hard money
10% down · 12.0% · 12mo
- Down + closing
- —
- Monthly P&I
- —
- Monthly cashflow
- —
- DSCR
- —
- Eligible?
- —
Short-term bridge; refi at stabilization.
Rent comps 12 comps
| Address | Beds | Baths | Sqft | Rent | $/sqft | DOM | Units | Dist |
|---|---|---|---|---|---|---|---|---|
| 4440 Parker Rd Black Jack, MO | 3.0 | 2.0 | 1900 | $1,711 | $0.90 | 1d | 1 | 0.56mi |
| 4583 Whisper Lake Dr Black Jack, MO | 1.0–5.0 | 1.0–2.5 | 1225 | $1,156 | $0.94 | 1d | 17 | 0.61mi |
| 2075 Cordoba Dr Florissant, MO | 3.0 | 2.0 | 1523 | $1,850 | $1.21 | 14d | 1 | 0.68mi |
| 3930 Belcroft Dr Florissant, MO | 3.0 | 3.0 | 1408 | $1,935 | $1.37 | 43d | 1 | 0.79mi |
| 3 Cantabrian Ct Florissant, MO | 3.0 | 2.0 | 1436 | $1,881 | $1.31 | 14d | 1 | 0.84mi |
| 4872 Bristol Rock Rd Black Jack, MO | 4.0 | 2.0 | 1448 | $2,061 | $1.42 | 2d | 1 | 1.08mi |
| 1600 Horseshoe Dr Florissant, MO | 3.0 | 2.0 | 1314 | $1,550 | $1.18 | 43d | 1 | 1.15mi |
| 11635 Hazeloak Dr Black Jack, MO | 3.0 | 2.0 | 1124 | $1,728 | $1.54 | 17d | 1 | 1.24mi |
| 1785 Trotter Way Florissant, MO | 3.0 | 2.0 | 1297 | $1,806 | $1.39 | 7d | 1 | 1.33mi |
| 5320 Springtrail Dr Black Jack, MO | 4.0 | 2.5 | 1712 | $2,390 | $1.40 | 22d | 1 | 1.44mi |
| 5364 Trailview Dr Black Jack, MO | 4.0 | 3.0 | 1992 | $2,330 | $1.17 | 22d | 1 | 1.48mi |
| 4112 Monsols Dr Florissant, MO | 3.0 | 2.0 | 1120 | $1,945 | $1.74 | 43d | 1 | 1.48mi |
Listing history 23 events
-
2026-06-15status $250,000 Pending 33 DOM
-
2026-06-15days on market $250,000 Active 33 DOM
-
2026-06-13days on market $250,000 Active 31 DOM
-
2026-06-13pricedays on market $250,000 Active 30 DOM
-
2026-06-09days on market $258,000 Active 27 DOM
-
2026-06-08days on market $258,000 Active 26 DOM
-
2026-06-07days on market $258,000 Active 25 DOM
-
2026-06-05days on market $258,000 Active 22 DOM
-
2026-06-03days on market $258,000 Active 21 DOM
-
2026-06-02days on market $258,000 Active 20 DOM
-
2026-06-01days on market $258,000 Active 19 DOM
-
2026-05-31days on market $258,000 Active 18 DOM
-
2026-05-13$266,000 Active 492-char remark
-
2018-09-14soldstatus Closed 541-char remark
Show marketing remark (541 chars)
Brick Ranch w/Rear Entry Garage in Majestic Tree Shaded Paddock Estates * Winner of "Florissant Garden of the Month" for May * Home boasts: Large Covered Front Porch, Hardwood Floors, Hard Surface Kitchen counters, Beautiful Wood burning Fireplace with Granite Hearth, Crown Molding, Updated Cultured Marble Bathrooms, Enclosed Sun Room with Skylight, Garage Opener & extra parking Pads in rear, Huge Partially Finished LL - All this under a New Roof installation 2017 * Check out this Awesome home - Pride in Ownership here!
-
2018-09-10status Pending 541-char remark
Show marketing remark (541 chars)
Brick Ranch w/Rear Entry Garage in Majestic Tree Shaded Paddock Estates * Winner of "Florissant Garden of the Month" for May * Home boasts: Large Covered Front Porch, Hardwood Floors, Hard Surface Kitchen counters, Beautiful Wood burning Fireplace with Granite Hearth, Crown Molding, Updated Cultured Marble Bathrooms, Enclosed Sun Room with Skylight, Garage Opener & extra parking Pads in rear, Huge Partially Finished LL - All this under a New Roof installation 2017 * Check out this Awesome home - Pride in Ownership here!
-
2018-08-01historical Contingent (No Kickout) 541-char remark
Show marketing remark (541 chars)
Brick Ranch w/Rear Entry Garage in Majestic Tree Shaded Paddock Estates * Winner of "Florissant Garden of the Month" for May * Home boasts: Large Covered Front Porch, Hardwood Floors, Hard Surface Kitchen counters, Beautiful Wood burning Fireplace with Granite Hearth, Crown Molding, Updated Cultured Marble Bathrooms, Enclosed Sun Room with Skylight, Garage Opener & extra parking Pads in rear, Huge Partially Finished LL - All this under a New Roof installation 2017 * Check out this Awesome home - Pride in Ownership here!
-
2018-07-07price $158,900 541-char remark
Show marketing remark (541 chars)
Brick Ranch w/Rear Entry Garage in Majestic Tree Shaded Paddock Estates * Winner of "Florissant Garden of the Month" for May * Home boasts: Large Covered Front Porch, Hardwood Floors, Hard Surface Kitchen counters, Beautiful Wood burning Fireplace with Granite Hearth, Crown Molding, Updated Cultured Marble Bathrooms, Enclosed Sun Room with Skylight, Garage Opener & extra parking Pads in rear, Huge Partially Finished LL - All this under a New Roof installation 2017 * Check out this Awesome home - Pride in Ownership here!
-
2018-06-14$163,900 Active 541-char remark
Show marketing remark (541 chars)
Brick Ranch w/Rear Entry Garage in Majestic Tree Shaded Paddock Estates * Winner of "Florissant Garden of the Month" for May * Home boasts: Large Covered Front Porch, Hardwood Floors, Hard Surface Kitchen counters, Beautiful Wood burning Fireplace with Granite Hearth, Crown Molding, Updated Cultured Marble Bathrooms, Enclosed Sun Room with Skylight, Garage Opener & extra parking Pads in rear, Huge Partially Finished LL - All this under a New Roof installation 2017 * Check out this Awesome home - Pride in Ownership here!
-
2017-09-06price $169,900
-
2017-08-23price $173,000
-
2017-08-05price $176,500
-
2017-07-19price $177,000
-
1987-06-01soldstatus
ⓘ Source: listings_history table (triggers on properties + properties_extension) + one-shot
backfill from property_details.listing_events for pre-trigger history.
Tax reassessment forecast MO · Resets to sale price
- Current annual tax
- $2,584 · $215/mo
- Projected year-2 tax
- $2,584 · $215/mo
- Expected delta
- $0/yr ($0/mo · 0.0%)
ⓘ Screening estimate from a state-policy table — verify with the county assessor before closing.
Climate risk First Street
- Flood 1/10 Low FEMA zone X (unshaded) · 0% chance over 30 yrs
- Wildfire 1/10 Low
- Heat 4/10 Moderate 7 d/yr ≥106°F today · 21 d/yr by 30 yrs out
- Wind 2/10 Low 100% chance of damaging wind over 30 yrs
- Air quality 3/10 Moderate 3 unhealthy d/yr today · 5 by 30 yrs out
Nearby sold comps map
Loading sold comps map…
Walkable amenities ~0.75 mi
Loading nearby amenities…
Taxation est. · year 1
- Rental income
- $22,576
- − Mortgage interest
- −$14,004
- − Property taxes
- −$2,584
- − Insurance
- −$1,250
- − Repairs & maintenance
- −$1,806
- − Management
- −$1,806
- − Depreciation
- −$7,273
- Taxable loss
- −$6,146
- Est. tax savings @ 24.0%
- +$1,475
- After-tax cash flow
- $-256/yr
For passive investors: Depreciation is non-cash, so a rental often shows a tax loss while cash-flowing — sheltering income. Rental losses are passive: they offset passive income freely, and up to $25,000/yr can offset ordinary (W-2) income if you actively participate and your MAGI is under $100k (phasing out to $0 by $150k); unused losses carry forward. On sale, claimed depreciation is recaptured at up to 25%, and gains may owe capital-gains tax (a 1031 exchange can defer both). Figures are a year-1 estimate at your 24.0% rate — not tax advice; consult a CPA.
Schools (NCES district)
- District
- Ferguson-Florissant R-II
- NCES district ID
- 2912010
- Math proficiency
- 7% ▼ -9.00%
- Reading proficiency
- 20% ▼ -6.00%
- Median HH income
- $44,610
- Composite
- 11.96/100
- National rank
- #9666
- State rank
- #311 of 324 in MO
Livability — Florissant
- Score
- 73/100
- State rank
- #82
- US rank
- #5406
Category grades
Schools grade is shown separately in the Schools card above.
Census & demographics
- Census place
- Florissant, MO
- County
- Saint Louis County · 888,823 people
- City population
- 69,104
- Metro
- St. Louis, MO-IL
- Population (ZIP)
- 43,056
- Household income
- $66,776
- Rent vs Own
- Severe rent burden
- 1429.0
Population outlook (St. Louis County) Hauer SSP2
- Today (2025)
- 1,025,227 people
- By 2030
- 1,028,023 · +0.3%
- By 2040
- 1,020,940 · -0.4%
- By 2050
- 1,007,280 · -1.8%
- By 2075
- 987,277 · -3.7%
- By 2100
- 921,984 · -10.1%
Race, ethnicity, and origin ACS 2023
- Neighborhood character
- Predominantly Black (71%)
- Race & ethnicity
- Black 71% White 23% Two or more races 4% Hispanic / Latino 1%
- Common ancestry
- Romanian 1% Lithuanian 1% Italian 1%
- Foreign-born
- 3% · Canada, Vietnam
- Languages at home
- 95% English-only · Spanish 1% French/Haitian/Cajun 1%
Political lean MEDSL · St. Louis
- 2024 margin
- Strong D (+23.4) · D 60.8% · R 37.4% · Other 1.7%
- 2008→2024 swing
- +3.5pp toward D · 2008: 19.9pp · 2024: 23.4pp
- All cycles
- 2024: D+23.4 2020: D+24.0 2016: D+16.2 2012: D+13.7 2008: D+19.9
Not yet ingested
- Civics
- —
Market trends
- HPI YoY
- ▲ 13.78%
- Current HPI
- 570.6
- Rent YoY
- ▲ 7.51%
- Metro
- St. Louis, MO-IL
- State GDP YoY
- ▲ 1.84%
- F500 in state
- 20
Industry mix (Fortune 500 HQ in MO)
| Industry | F500 HQs | Revenue |
|---|---|---|
| Healthcare | 1 | $163B |
|
||
| Insurance | 1 | $21B |
|
||
| Industrial Technology | 1 | $17B |
|
||
| Retail | 1 | $16B |
|
||
| Industrial Distribution | 1 | $10B |
|
||
| Utilities | 1 | $9B |
|
||
Price history
+41.2% since first listed14 events — show timeline
- 2026-06-15 Pending — MARIS as Distributed by MLS Grid
- 2026-06-11 Price Changed $250,000 MARIS as Distributed by MLS Grid
- 2026-05-28 Price Changed $258,000 MARIS as Distributed by MLS Grid
- 2026-05-13 Listed $266,000 MARIS as Distributed by MLS Grid
- 2018-09-14 Sold (MLS) — MARIS as Distributed by MLS Grid
- 2018-09-10 Pending — MARIS as Distributed by MLS Grid
- 2018-08-01 Contingent — MARIS as Distributed by MLS Grid
- 2018-07-07 Price Changed $158,900 MARIS as Distributed by MLS Grid
- 2018-06-14 Listed $163,900 MARIS as Distributed by MLS Grid
- 2017-09-06 Price Changed $169,900 MARIS as Distributed by MLS Grid
- 2017-08-23 Price Changed $173,000 MARIS as Distributed by MLS Grid
- 2017-08-05 Price Changed $176,500 MARIS as Distributed by MLS Grid
- 2017-07-19 Price Changed $177,000 MARIS as Distributed by MLS Grid
- 1987-06-01 Sold (Public Records) — Public Records
Property tax history
+1.0%/yrLatest (2022): $2,584 · +6.4% YoY. Source: county tax records.
Cash-flow waterfall
monthlySold comps — $/sqft
last 12 mo · ≤1 miLoading sold comps…