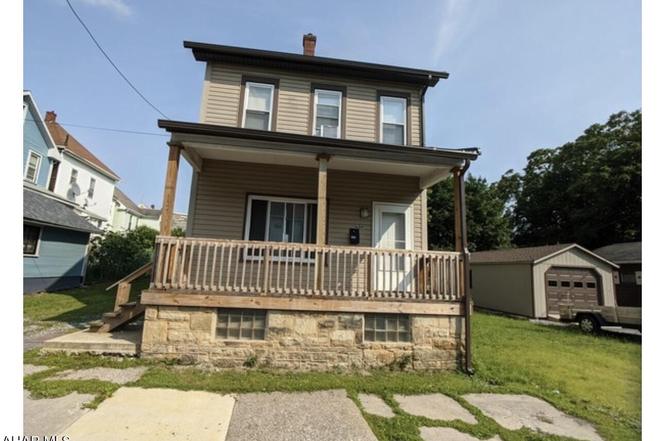
1609 20th Ave · Altoona, PA
Flood risk 6/10 · Moderate
- FEMA flood zone
- X (unshaded)
- Chance of flooding over 30 yrs
- 0.75%
- Est. flood insurance / yr
- $507 – $1,088
Fire risk 1/10 · Minimal
- Est. fire insurance / yr
- $511 – $949
Heat risk 3/10 · Minor
- Hot days now (above 95°F)
- 7 days/yr
- Hot days in 30 yrs
- 18 days/yr
Wind risk 2/10 · Minimal
- Chance of severe wind over 30 yrs
- —
Air-quality risk 2/10 · Minimal
- Unhealthy air days now
- 1 days/yr
- Unhealthy air days in 30 yrs
- 3 days/yr
Risk factors via First Street. Map © Google.
Why this score? — see what drove the B- grade
The composite is a weighted blend of 9 inputs, each scored 0–100. Each bar is that input's sub-score; the figure is the points it added to the 100-point composite (weight × sub-score).
- Cash flow +25.7/30.0
- ARV discount +14.5/15.0
- DSCR +8.6/10.0
- 1% rule +6.5/10.0
- Livability +4.0/5.0
- Schools +3.1/10.0
- Rent growth +2.5/5.0
- Condition / age +2.5/5.0
- Appreciation +0.0/10.0
$89,500
🖨 Deal sheet 📄 Offer letter ✓ Due diligence
Listing remarks
Great Investment opportunity 3 Bedroom 1 bath currently rented at $800/Month low taxes good rental history . Great Investment Property or owner occupant Purchase , Also other property at 708 N. 5th ave. can be also purchased as a package , Call listing agent for package price.
Key facts
- 1,742 sq ft lot
- Built 1920
- Listed 97 days
Neighborhood map
What this means for you Summary
Snapshot
- This is a 3-bed/1.0-bath single-family listed at $90k.
Deal economics
- At list price, monthly cash flow is $216 ($3k/yr) — positive.
- The deal already cash-flows at list — no discount required.
- Meets the 1% rule at list price ($1k rent vs $90k).
- Recommended offer: $81k (9.0% below list) — sets the bar for market timing.
- Cap rate 9.2% vs local median 5.8% in Altoona — top-decile yield for the area; either an underpriced asset or a hidden risk that comps aren't pricing in. Stress-test before assuming the spread holds.
Location & tenants
- Location reads 79/100 on livability (#237 in PA, #2,060 nationally) — a middle-class / working-renter tenant base. Strengths: commute A+, cost of living A+, housing A+; Watch: crime C-, employment D, amenities F.
- Altoona Area SD (urban): math 30% / reading 44% proficiency, ranked #406 of 539 in PA (top 75%) — families likely to look elsewhere, expect single-tenant / working-renter base with shorter leases.
- Market conditions: 186 active listings in the ZIP; 5 comparable units currently listed for rent nearby; rentals lingering (median 44d on market — plan ~5-8 weeks vacancy on turnover, expect pricing pressure); 100% of comp listings sitting > 30 days — soft ceiling on asking rent; 99 units permitted in Blair County in 2024 (0 in 5+ unit buildings).
Forward outlook
- Local home prices are declining (-3.0%/yr); year-one equity from $619 of loan paydown is wiped out by about $3k of value loss. Plan a longer hold.
- Blair County population projected at -18% by 2050 — secular population decline; favor cash flow + early exit over multi-decade hold.
Negotiation context
- It's been on market 97 days — a 9% lower offer ($81k) is reasonable based on typical stale-listing flexibility.
- 5 sale attempts since 21y ago with the ask held roughly flat each time — persistent listings suggest the price (not the market) is what's stuck; bring a comps-based counter.
- Current owner paid $70k; 28% above their basis — modest negotiation headroom, anchor on the comps not their cost.
Risks & watch-outs
- Watch-outs: built in 1920 — expect roof / HVAC / electrical / plumbing capex.
- Climate carrying-cost: major flood risk — expect insurance premiums to compound above CPI over the hold.
Questions for the listing agent
- It's been on market 97 days. Have you received any prior offers? Is the seller open to a 9% concession, seller financing, or rate buy-down credit?
- Built in 1920 — when were the roof, HVAC, electrical panel, plumbing, and water heater last replaced?
- Why hasn't it sold? Are there any deal-killer items the seller is aware of (foundation, flood, title, zoning, code violations)?
- Is there a deadline driving the sale (1031 exchange, divorce, estate, relocation)? That informs how much negotiation room exists.
- Schools are B-rated — typically a magnet for longer-tenancy family renters. What's the average tenant stay here, and is there a school-zone premium baked into asking?
- What's the average days-on-market for RENTAL listings here right now (not sales)? A rising rental-DOM trend means longer vacancies and softer asking-rent achievability than the comps imply.
- What's the recent tenant-quality profile in this submarket — average credit score on applications, eviction rate, late-payment / NSF rate, and stable-employment percentage? A property-management company in the area should have these aggregated.
- How much new for-sale + rental construction is in the pipeline within 1–3 miles? Heavy new supply typically softens prices + rents 12–24 months out; constrained supply supports both.
Investment metrics
- 1% rule
- 1.15% ✓
- Cap rate
- 9.18%
- Cash-on-cash
- 10.33%
- DSCR
- 1.46
- GRM
- 7.3
CMA / ARV
- ARV (on-the-fly)
- $106,020
- Comps found
- 12
Show comp detail 12 sales within ~0.75 mi
| Address | Dist | Beds/Ba | Sqft | Sold | Price | $/sf | Match |
|---|---|---|---|---|---|---|---|
| 1605 22nd Ave | 0.11mi | 3/1.0 | 1,621 (-5%) | 1mo | $139,900 | $86 | 85 |
| 1329-31 21st Ave | 0.20mi | 3/1.5 | 1,786 (+4%) | 3mo | $195,000 | $109 | 79 |
| 2408 12th St | 0.46mi | 3/1.5 | 1,707 (-0%) | 1mo | $230,000 | $135 | 75 |
| 1419 21st Ave | 0.15mi | 3/1.5 | 1,862 (+9%) | 3mo | $116,250 | $62 | 74 |
| 1225 19th Ave | 0.30mi | 3/2.0 | 1,600 (-6%) | 2mo | $138,500 | $87 | 70 |
| 1406 20th Ave | 0.16mi | 4/1.0 (+1) | 1,558 (-9%) | 4mo | $27,000 | $17 | 69 |
| 1611 21st Ave | 0.06mi | 3/2.0 | 1,944 (+14%) | 3mo | $83,000 | $43 | 68 |
| 1008 21st Ave | 0.50mi | 4/1.0 (+1) | 1,749 (+2%) | 2mo | $59,500 | $34 | 67 |
| 1009 22nd Ave | 0.51mi | 3/1.5 | 1,791 (+5%) | 1mo | $75,000 | $42 | 66 |
| 2022 Pine Ave | 0.61mi | 2/1.0 (-1) | 1,740 (+2%) | 1mo | $48,000 | $28 | 63 |
| 1308 17th Ave | 0.29mi | 3/2.0 | 1,483 (-13%) | 5mo | $54,800 | $37 | 56 |
| 2809 13th St | 0.58mi | 4/2.0 (+1) | 1,812 (+6%) | 1mo | $235,000 | $130 | 54 |
Match score weights: distance 35% · size 25% · config 20% · recency 20%. Top-matched comps best support the ARV.
Projected returns pro-forma
-3.0% appreciation · 3.0% rent growth · sell at horizon
- IRR
- -0.8%
- Equity multiple
- 0.97×
- Total profit
- $-766
- Equity at exit
- $13,345
- IRR
- 8.9%
- Equity multiple
- 1.68×
- Total profit
- $17,024
- Equity at exit
- $7,738
Cash invested: $25,060 (down + closing). Projections, not guarantees.
Landlord ↔ Tenant lean methodology
- Overall (STATE)
- 62 Landlord-Friendly
- State Pennsylvania
- 62 Landlord-Friendly · EVEN
- County
- — inherits STATE
- City
- — inherits STATE
ZIP-level market 16601
- Home prices YoY
- -24.9%
- Active inventory
- 186
- Price-to-rent
- 7.3×
Monthly cashflow live
- Estimated rent
- $1,025 high interval (Pro) →
- Mortgage (P&I)
- −$469
- Tax from tax record
- −$88 /mo · $1,050/yr
- Insurance
- −$37
- HOA
- −$0
- Vacancy / Maint / Mgmt
- −$215
- Net cashflow
- $216
Break-even live
UW: 25.0% down · 7.5% · 30yr · 1.5% tax · 5.0% vac · 8.0% maint · 8.0% mgmt
Financing live
Cash to close
- Down payment
- $22,375
- Closing costs
- $2,685
- Reserves months
- —
- Total cash needed
- —
Loan-product check · same deal, 3 products live
Conventional
25% down · 7.5% · 30yr
- Down + closing
- —
- Monthly P&I
- —
- Monthly cashflow
- —
- DSCR
- —
- Eligible?
- —
Personal DTI + credit; lowest rate.
DSCR
20% down · 8.5% · 30yr
- Down + closing
- —
- Monthly P&I
- —
- Monthly cashflow
- —
- DSCR
- —
- Eligible?
- —
No personal income docs; deal must DSCR.
Hard money
10% down · 12.0% · 12mo
- Down + closing
- —
- Monthly P&I
- —
- Monthly cashflow
- —
- DSCR
- —
- Eligible?
- —
Short-term bridge; refi at stabilization.
Rent comps 5 comps
| Address | Beds | Baths | Sqft | Rent | $/sqft | DOM | Units | Dist |
|---|---|---|---|---|---|---|---|---|
| 1489 Washington Ave Altoona, PA | 3.0 | 1.5 | 1050 | $850 | $0.81 | 43d | 1 | 0.10mi |
| 1326 14th Ave Altoona, PA | 3.0 | 1.0 | 1600 | $1,150 | $0.72 | 43d | 1 | 0.36mi |
| 2015 12th Ave Altoona, PA | 3.0 | 1.0 | 1600 | $1,200 | $0.75 | 43d | 1 | 0.44mi |
| 1102 17th Ave Altoona, PA | 3.0 | 1.0 | 1430 | $899 | $0.63 | 43d | 1 | 0.47mi |
| 201 2nd Ave Unit 2nd Fl Altoona, PA | 3.0 | 1.0 | 1244 | $790 | $0.64 | 43d | 1 | 1.48mi |
Listing history 12 events
-
2026-04-14status Pending
-
2026-01-07$89,500 Active
-
2022-03-11soldstatus $70,000
-
2022-03-10soldstatus $70,000
-
2022-01-27$70,000
-
2008-04-24soldstatus $45,000
-
2008-04-11soldstatus $45,000
-
2007-05-25$49,900
-
2006-04-13soldstatus $10,500
-
2006-01-31$14,900
-
2005-08-24$19,900
-
2002-04-19soldstatus $28,900
ⓘ Source: listings_history table (triggers on properties + properties_extension) + one-shot
backfill from property_details.listing_events for pre-trigger history.
Tax reassessment forecast PA · Partial reset (capped growth)
- Current annual tax
- $1,050 · $88/mo
- Projected year-2 tax
- $1,232 · $103/mo
- Expected delta
- +$182/yr (+$15/mo · 17.3%)
ⓘ Screening estimate from a state-policy table — verify with the county assessor before closing.
Climate risk First Street
- Flood 6/10 Major FEMA zone X (unshaded) · 75% chance over 30 yrs
- Wildfire 1/10 Low
- Heat 3/10 Moderate 7 d/yr ≥95°F today · 18 d/yr by 30 yrs out
- Wind 2/10 Low
- Air quality 2/10 Low 1 unhealthy d/yr today · 3 by 30 yrs out
Nearby sold comps map
Loading sold comps map…
Walkable amenities ~0.75 mi
Loading nearby amenities…
Taxation est. · year 1
- Rental income
- $12,302
- − Mortgage interest
- −$5,013
- − Property taxes
- −$1,050
- − Insurance
- −$448
- − Repairs & maintenance
- −$984
- − Management
- −$984
- − Depreciation
- −$2,604
- Taxable income
- $1,218
- Est. tax owed @ 24.0%
- −$292
- After-tax cash flow
- $2,296/yr
For passive investors: Depreciation is non-cash, so a rental often shows a tax loss while cash-flowing — sheltering income. Rental losses are passive: they offset passive income freely, and up to $25,000/yr can offset ordinary (W-2) income if you actively participate and your MAGI is under $100k (phasing out to $0 by $150k); unused losses carry forward. On sale, claimed depreciation is recaptured at up to 25%, and gains may owe capital-gains tax (a 1031 exchange can defer both). Figures are a year-1 estimate at your 24.0% rate — not tax advice; consult a CPA.
Schools (NCES district)
- District
- Altoona Area SD
- NCES district ID
- 4202340
- Math proficiency
- 30% ▼ -15.00%
- Reading proficiency
- 44% ▼ -15.00%
- Median HH income
- $38,465
- Composite
- 30.85/100
- National rank
- #6130
- State rank
- #406 of 539 in PA
Livability — Altoona
- Score
- 79/100
- State rank
- #237
- US rank
- #2060
Category grades
Schools grade is shown separately in the Schools card above.
Census & demographics
- Census place
- Altoona, PA
- County
- Blair County · 59,867 people
- City population
- 59,867
- Metro
- Altoona, PA
- Population (ZIP)
- 33,515
- Household income
- $58,070
- Rent vs Own
- Severe rent burden
- 715.0
Population outlook (Blair County) Hauer SSP2
- Today (2025)
- 121,571 people
- By 2030
- 117,966 · -3.0%
- By 2040
- 109,174 · -10.2%
- By 2050
- 99,542 · -18.1%
- By 2075
- 76,775 · -36.8%
- By 2100
- 54,326 · -55.3%
Race, ethnicity, and origin ACS 2023
- Neighborhood character
- Predominantly White (90%)
- Race & ethnicity
- White 90% Two or more races 5% Black 3% Hispanic / Latino 1%
- Common ancestry
- Romanian 5% Slovak 2% Lithuanian 2%
- Foreign-born
- 1% · Vietnam
- Languages at home
- 97% English-only · German/W. Germanic 1% Spanish 1%
Political lean MEDSL · Blair
- 2024 margin
- Solid R (+43.5) · D 27.9% · R 71.4%
- 2008→2024 swing
- -19.2pp toward R · 2008: -24.3pp · 2024: -43.5pp
- All cycles
- 2024: R+43.5 2020: R+43.5 2016: R+46.4 2012: R+33.5 2008: R+24.3
Not yet ingested
- Civics
- —
Market trends
- HPI YoY
- ▼ -60.97%
- Current HPI
- 183.9907
- Rent YoY
- —
- Metro
- Altoona, PA
- State GDP YoY
- ▲ 1.68%
- F500 in state
- 34
Industry mix (Fortune 500 HQ in PA)
| Industry | F500 HQs | Revenue |
|---|---|---|
| Healthcare | 2 | $309B |
|
||
| Insurance | 2 | $27B |
|
||
| Telecommunications / Media | 1 | $124B |
|
||
| Industrial Distribution | 1 | $22B |
|
||
| Financial Services | 1 | $20B |
|
||
| Chemicals / Materials | 1 | $18B |
|
||
Price history
+209.7% since first listed12 events — show timeline
- 2026-04-14 Pending — AHARMLS
- 2026-01-07 Listed $89,500 AHARMLS
- 2022-03-11 Sold (Public Records) $70,000 Public Records
- 2022-03-10 Sold (MLS) $70,000 AHARMLS
- 2022-01-27 Listed $70,000 AHARMLS
- 2008-04-24 Sold (Public Records) $45,000 Public Records
- 2008-04-11 Sold (MLS) $45,000 AHARMLS
- 2007-05-25 Listed $49,900 AHARMLS
- 2006-04-13 Sold (MLS) $10,500 AHARMLS
- 2006-01-31 Listed $14,900 AHARMLS
- 2005-08-24 Listed $19,900 AHARMLS
- 2002-04-19 Sold (Public Records) $28,900 Public Records
Property tax history
-5.8%/yrLatest (2025): $1,050 · +13.0% YoY. Source: county tax records.
Cash-flow waterfall
monthlySold comps — $/sqft
last 12 mo · ≤1 miLoading sold comps…