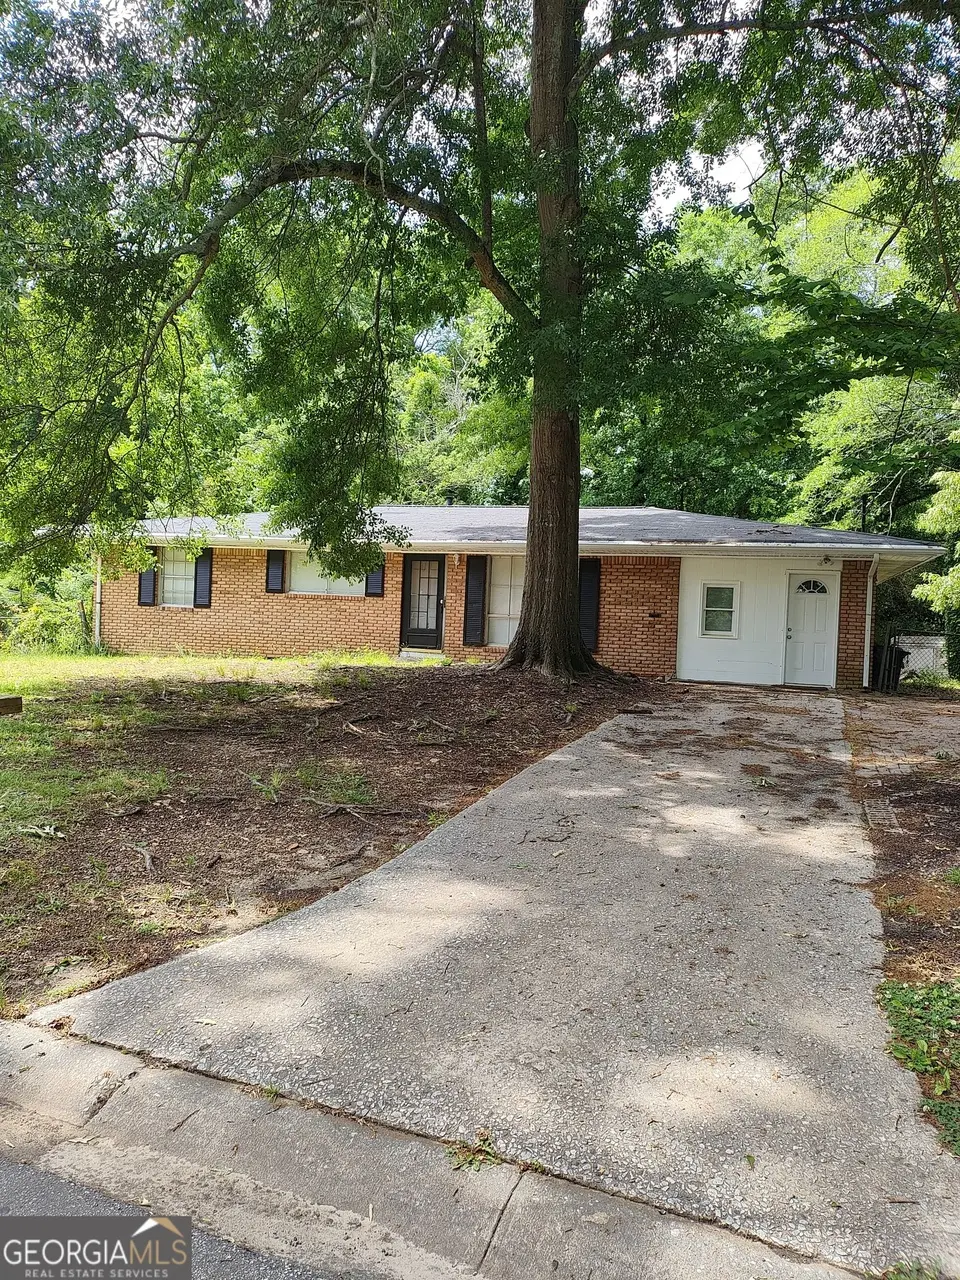
7327 Howard Cir · Jonesboro, GA
Flood risk 5/10 · Moderate
- FEMA flood zone
- X (unshaded)
- Chance of flooding over 30 yrs
- 0.68%
- Est. flood insurance / yr
- $507 – $1,088
Fire risk 1/10 · Minimal
- Est. fire insurance / yr
- $963 – $1,789
Heat risk 6/10 · Moderate
- Hot days now (above 105°F)
- 7 days/yr
- Hot days in 30 yrs
- 18 days/yr
Wind risk 6/10 · Moderate
- Chance of severe wind over 30 yrs
- 27.0%
Air-quality risk 4/10 · Minor
- Unhealthy air days now
- 4 days/yr
- Unhealthy air days in 30 yrs
- 7 days/yr
Risk factors via First Street. Map © Google.
Why this score? — see what drove the D grade
The composite is a weighted blend of 9 inputs, each scored 0–100. Each bar is that input's sub-score; the figure is the points it added to the 100-point composite (weight × sub-score).
- ARV discount +12.1/15.0
- Cash flow +11.6/30.0
- Livability +3.6/5.0
- DSCR +3.4/10.0
- 1% rule +3.2/10.0
- Rent growth +3.0/5.0
- Condition / age +2.5/5.0
- Schools +1.3/10.0
- Appreciation +0.0/10.0
$195,000
🖨 Deal sheet 📄 Offer letter ✓ Due diligence
Listing remarks MLS
GREAT STARTER HOME OR INVESTMENT OPPORTUNITY FENCED BACKYARD
Key facts
- Fenced backyard
- Built 1963
- Listed 51 days
Tags
Property features AI
Finance
- Other: Located in Oak Forest subdivision; Address: 7327 Howard Circle, Jonesboro, GA 30236
- HOA & community: No homeowners association; No community features
Exterior
- Parking: Off-street parking
- Utilities: Public water; Public sewer; Electricity available
- Home design: Single family residence; Residential house; Resale property
- Construction: Built in 1963
- Exterior features: Composition roof; Brick construction; No lot features listed
Interior
- Kitchen: No appliances listed
- Bedrooms: 3 bedrooms
- Flooring: Other flooring
- Bathrooms: 1 full bathroom
- Heating & cooling: Central heating; Central air conditioning
- Interior features: Other interior features; Two levels; No basement; No fireplaces
- Laundry & utility: Other laundry features
Neighborhood map
What this means for you Summary
Snapshot
- This is a 3-bed/1.0-bath single-family listed at $195k.
Deal economics
- At list price, monthly cash flow is $-62 ($-749/yr) — negative.
- To cash-flow at today's rent, offer at most $184k (5.7% below list).
- To meet the 1% rule (rent ≥ 1% of price), the offer needs to be $160k (17.8% below list).
- Recommended offer: $160k (17.8% below list) — sets the bar for 1% rule.
Location & tenants
- Location reads 72/100 on livability (#63 in GA) — a middle-class / working-renter tenant base. Strengths: cost of living A+, housing A-; Watch: crime C-, employment D, schools F.
- Clayton County (suburban): math 11% / reading 20% proficiency, ranked #155 of 174 in GA (top 89%) — low school quality limits family demand, transient renter base, plan for 1-2y turnover; 78% free/reduced lunch — lower-income household profile, screen leases tightly.
- Market conditions: Rents rising (+2.1%/yr); 265 active listings in the ZIP; 40 comparable units currently listed for rent nearby; rentals at typical pace (median 24d on market — plan ~3-4 weeks tenant-placement turnaround); 865 units permitted in Clayton County in 2024 (448 in 5+ unit buildings).
Forward outlook
- Local home prices are declining (-3.0%/yr); year-one equity from $1k of loan paydown is wiped out by about $6k of value loss. Plan a longer hold.
- Clayton County population projected at +29% by 2050 — long-run rental-demand tailwind backs the buy-and-hold thesis.
Negotiation context
- It's been on market 51 days — a 3% lower offer ($189k) is reasonable based on typical stale-listing flexibility.
- 2 sale attempts since 15y ago; this cycle's ask has dropped $15k (7%) from the opening price — seller is motivated, your offer sets the floor, not the list.
- Current owner paid $23k; list at $195k implies a 752% gain — meaningful room to come down on a strong offer.
Risks & watch-outs
- Climate carrying-cost: moderate flood risk; major wind risk, 27% chance of damaging wind over 30y; extreme-heat days projected 7→18/yr by 2055 (HVAC capex compounding) — expect insurance premiums to compound above CPI over the hold.
Questions for the listing agent
- What do current leases actually rent for vs. the listed asking? Can we see a recent rent roll and the last 12 months of T-12 income?
- It's been on market 51 days. Have you received any prior offers? Is the seller open to a 18% concession, seller financing, or rate buy-down credit?
- Built in 1963 — when were the roof, HVAC, electrical panel, plumbing, and water heater last replaced?
- Is there a deadline driving the sale (1031 exchange, divorce, estate, relocation)? That informs how much negotiation room exists.
- Schools are F-rated, which usually means shorter tenancies and higher turnover. Who's the typical renter profile here, and what's been the actual vacancy rate?
- The area grade is low — what's the realistic commute time and amenity access for the typical tenant pool here? Any planned neighborhood developments (good or bad) we should know about?
- What's the average days-on-market for RENTAL listings here right now (not sales)? A rising rental-DOM trend means longer vacancies and softer asking-rent achievability than the comps imply.
- What's the recent tenant-quality profile in this submarket — average credit score on applications, eviction rate, late-payment / NSF rate, and stable-employment percentage? A property-management company in the area should have these aggregated.
- How much new for-sale + rental construction is in the pipeline within 1–3 miles? Heavy new supply typically softens prices + rents 12–24 months out; constrained supply supports both.
Investment metrics
- 1% rule
- 0.82% ✗
- Cap rate
- 5.91%
- Cash-on-cash
- -1.37%
- DSCR
- 0.94
- GRM
- 10.1
CMA / ARV
- ARV (median comp)
- $217,001
- List price
- $195,000
- Delta
- -10.14%
- Verdict
- UNDERPRICED
- Comps
- 20 within 1.0 mi
Show comp detail 12 sales within ~0.75 mi
| Address | Dist | Beds/Ba | Sqft | Sold | Price | $/sf | Match |
|---|---|---|---|---|---|---|---|
| 7323 Howard Pl | 0.08mi | 3/1.0 | 1,260 (+2%) | 11mo | $185,000 | $147 | 83 |
| 7411 Anderson Pl | 0.14mi | 4/2.0 (+1) | 1,242 (+1%) | 10mo | $149,000 | $120 | 74 |
| 7161 Pine St | 0.39mi | 3/1.0 | 1,264 (+3%) | 4mo | $185,000 | $146 | 73 |
| 687 Anderson Dr | 0.09mi | 3/2.5 | 1,400 (+14%) | 2mo | $234,000 | $167 | 65 |
| 707 Battlecreek Rd | 0.10mi | 3/1.5 | 1,075 (-13%) | 14mo | $145,000 | $135 | 60 |
| 692 Johnson Rd | 0.35mi | 3/1.0 | 1,316 (+7%) | 16mo | $100,000 | $76 | 59 |
| 7401 Nulan Way | 0.53mi | 3/1.0 | 1,248 (+2%) | 18mo | $124,000 | $99 | 58 |
| 7437 Nulan Way | 0.58mi | 3/2.0 | 1,225 (-0%) | 13mo | $225,000 | $184 | 58 |
| 900 King Rd | 0.30mi | 3/2.0 | 1,118 (-9%) | 12mo | $252,000 | $225 | 57 |
| 7585 Haley Dr | 0.48mi | 3/1.5 | 1,050 (-15%) | 2mo | $110,000 | $105 | 50 |
| 447 Wavelyn Way | 0.60mi | 3/1.5 | 1,092 (-11%) | 13mo | $153,700 | $141 | 40 |
| 356 Queen Aliese Ln | 0.72mi | 4/1.5 (+1) | 1,318 (+7%) | 16mo | $185,000 | $140 | 34 |
Match score weights: distance 35% · size 25% · config 20% · recency 20%. Top-matched comps best support the ARV.
Projected returns pro-forma
-3.0% appreciation · 2.15% rent growth · sell at horizon
- IRR
- -19.5%
- Equity multiple
- 0.32×
- Total profit
- $-36,920
- Equity at exit
- $29,075
- IRR
- -14.1%
- Equity multiple
- 0.22×
- Total profit
- $-42,702
- Equity at exit
- $16,860
Cash invested: $54,600 (down + closing). Projections, not guarantees.
Landlord ↔ Tenant lean methodology
- Overall (STATE)
- 90 Strongly Landlord-Friendly
- State Georgia
- 90 Strongly Landlord-Friendly · R+3
- County
- — inherits STATE
- City
- — inherits STATE
ZIP-level market 30236
- Rents YoY
- 2.1%
- Active inventory
- 265
- Price-to-rent
- 10.1×
Monthly cashflow live
- Estimated rent
- $1,604 high interval (Pro) →
- Mortgage (P&I)
- −$1,023
- Tax from tax record
- −$225 /mo · $2,705/yr
- Insurance
- −$81
- HOA
- −$0
- Vacancy / Maint / Mgmt
- −$337
- Net cashflow
- $-62
Break-even live
UW: 25.0% down · 7.5% · 30yr · 1.5% tax · 5.0% vac · 8.0% maint · 8.0% mgmt
Financing live
Cash to close
- Down payment
- $48,750
- Closing costs
- $5,850
- Reserves months
- —
- Total cash needed
- —
Loan-product check · same deal, 3 products live
Conventional
25% down · 7.5% · 30yr
- Down + closing
- —
- Monthly P&I
- —
- Monthly cashflow
- —
- DSCR
- —
- Eligible?
- —
Personal DTI + credit; lowest rate.
DSCR
20% down · 8.5% · 30yr
- Down + closing
- —
- Monthly P&I
- —
- Monthly cashflow
- —
- DSCR
- —
- Eligible?
- —
No personal income docs; deal must DSCR.
Hard money
10% down · 12.0% · 12mo
- Down + closing
- —
- Monthly P&I
- —
- Monthly cashflow
- —
- DSCR
- —
- Eligible?
- —
Short-term bridge; refi at stabilization.
Rent comps 40 comps
| Address | Beds | Baths | Sqft | Rent | $/sqft | DOM | Units | Dist |
|---|---|---|---|---|---|---|---|---|
| 707 Battlecreek Rd Jonesboro, GA | 3.0 | 1.5 | 1075 | $1,625 | $1.51 | 43d | 1 | 0.10mi |
| 7259 Mayfair Cir Jonesboro, GA | 3.0 | 1.0 | 1014 | $1,590 | $1.57 | 2d | 1 | 0.25mi |
| 754 S Nottingham Rd Jonesboro, GA | 3.0 | 1.0 | 1144 | $1,500 | $1.31 | 43d | 1 | 0.52mi |
| 100 Chaselake Dr Jonesboro, GA | 1.0–3.0 | 1.0–2.0 | 1160 | $1,501 | $1.29 | 1d | 23 | 0.54mi |
| 537 Fielding Cir Riverdale, GA | 3.0 | 1.0 | 1025 | $1,465 | $1.43 | 24d | 1 | 0.54mi |
| 808 S Nottingham Rd Jonesboro, GA | 3.0 | 1.5 | 1107 | $1,400 | $1.26 | 43d | 1 | 0.55mi |
| 808 S Nottingham Rd Jonesboro, GA | 3.0 | 1.5 | 1107 | $1,400 | $1.26 | 18d | 1 | 0.55mi |
| 661 Sherwood Dr Jonesboro, GA | 2.0–3.0 | 1.0–2.0 | 1184 | $1,495 | $1.26 | 43d | 1 | 0.61mi |
| 394 Queen Aliese Ln Jonesboro, GA | 3.0 | 1.0 | 1350 | $1,550 | $1.15 | 43d | 1 | 0.64mi |
| 7545 Tara Rd Jonesboro, GA | 1.0–3.0 | 1.0–2.0 | 1032 | $1,562 | $1.51 | 1d | 20 | 0.69mi |
| 858 Ohara Dr Jonesboro, GA | 2.0 | 2.0 | 1001 | $1,500 | $1.50 | 43d | 1 | 0.76mi |
| 7620 Tara Rd Jonesboro, GA | 2.0 | 1.5 | 1200 | $1,250 | $1.04 | 24d | 1 | 0.79mi |
| 933 Ohara Dr Jonesboro, GA | 2.0 | 2.0 | 1464 | $2,700 | $1.84 | 43d | 1 | 0.80mi |
| 1174 Battlecreek Rd Jonesboro, GA | 2.0–3.0 | 2.5 | 1270 | $1,850 | $1.46 | 2d | 5 | 0.85mi |
| 3500 Summercourt Dr Jonesboro, GA | 1.0–2.0 | 1.0–2.0 | 843 | $1,428 | $1.69 | 1d | 9 | 0.96mi |
| 1137 Gable Ter Jonesboro, GA | 4.0 | 2.5 | 1116 | $1,955 | $1.75 | 24d | 1 | 0.97mi |
| 6903 Tara Blvd Jonesboro, GA | 2.0 | 2.0 | 1150 | $1,305 | $1.13 | 24d | 1 | 0.98mi |
| 6903 Tara Blvd Jonesboro, GA | 2.0 | 1.0–2.0 | 1057 | $1,255 | $1.19 | 43d | 2 | 0.98mi |
| 7878 N Main St Jonesboro, GA | 2.0 | 1.0 | 950 | $962 | $1.01 | 1d | 5 | 0.98mi |
| 234 Montego Cir Riverdale, GA | 3.0 | 2.0 | 1122 | $1,615 | $1.44 | 24d | 1 | 0.99mi |
| 6726 Tara Blvd Jonesboro, GA | 3.0 | 1.0–2.5 | 1147 | $1,499 | $1.31 | 12d | 1 | 1.10mi |
| 7767 Park Ln Jonesboro, GA | 3.0 | 1.5 | 1065 | $1,660 | $1.56 | 43d | 1 | 1.11mi |
| 7800 Park Ln Jonesboro, GA | 3.0 | 1.5 | 1036 | $1,723 | $1.66 | 43d | 1 | 1.13mi |
| 7799 Park Ln Jonesboro, GA | 3.0 | 1.5 | 1112 | $1,500 | $1.35 | 4d | 1 | 1.16mi |
| 289 Montego Cir Riverdale, GA | 3.0 | 2.0 | 1254 | $1,768 | $1.41 | 43d | 1 | 1.16mi |
| 164 Meadowlark Ln Jonesboro, GA | 3.0 | 1.5 | 1056 | $1,665 | $1.58 | 1d | 1 | 1.22mi |
| 100 Riverview Pl Jonesboro, GA | 1.0–3.0 | 1.0–2.0 | 1153 | $2,002 | $1.74 | 1d | 18 | 1.23mi |
| 985 Mount Zion Rd Morrow, GA | 2.0–3.0 | 1.5–2.0 | 1157 | $1,274 | $1.10 | 1d | 9 | 1.24mi |
| 1 Magnolia Cir Jonesboro, GA | 1.0–3.0 | 1.0–2.0 | 925 | $1,622 | $1.75 | 1d | 15 | 1.26mi |
| 855 Mount Zion Rd Apt G6 Jonesboro, GA | 2.0 | 1.5 | 1159 | $1,249 | $1.08 | 5d | 1 | 1.26mi |
| 701 Mt Zion Rd Jonesboro, GA | 2.0–3.0 | 1.5–2.0 | 1136 | $1,500 | $1.32 | 3d | 8 | 1.27mi |
| 855 Mount Zion Rd Jonesboro, GA | 2.0 | 1.5 | 1159 | $1,249 | $1.08 | 43d | 1 | 1.27mi |
| 855 Mount Zion Rd Jonesboro, GA | 2.0–3.0 | 1.5 | 1219 | $1,249 | $1.02 | 15d | 5 | 1.27mi |
| 855 Mount Zion Rd Apt E2 Jonesboro, GA | 2.0 | 1.5 | 1159 | $999 | $0.86 | 5d | 1 | 1.29mi |
| 855 Mount Zion Rd Apt C1 Jonesboro, GA | 3.0 | 1.5 | 1280 | $1,199 | $0.94 | 5d | 1 | 1.30mi |
| 1150 Highway 138 Jonesboro, GA | 2.0 | 1.0 | 741 | $1,150 | $1.55 | 24d | 1 | 1.31mi |
| 976 5th Ave Jonesboro, GA | 3.0 | 2.0 | 1496 | $2,000 | $1.34 | 5d | 1 | 1.32mi |
| 850 Mount Zion Rd Jonesboro, GA | 2.0–3.0 | 1.0–1.5 | 1040 | $1,350 | $1.30 | 1d | 7 | 1.36mi |
| 267 Wayne Ave Jonesboro, GA | 4.0 | 2.0 | 1012 | $2,300 | $2.27 | 43d | 1 | 1.38mi |
| 6763 Brookwood Cir Jonesboro, GA | 3.0 | 1.5 | 1283 | $1,391 | $1.08 | 43d | 1 | 1.39mi |
Listing history 20 events
-
2026-06-18days on market $195,000 Active 51 DOM
-
2026-06-17days on market $195,000 Active 50 DOM
-
2026-06-16days on market $195,000 Active 49 DOM
-
2026-06-15days on market $195,000 Active 48 DOM
-
2026-06-13days on market $195,000 Active 46 DOM
-
2026-06-09days on market $195,000 Active 42 DOM
-
2026-06-08days on market $195,000 Active 41 DOM
-
2026-06-07days on market $195,000 Active 40 DOM
-
2026-06-04days on market $195,000 Active 37 DOM
-
2026-06-03days on market $195,000 Active 36 DOM
-
2026-06-02days on market $195,000 Active 35 DOM
-
2026-06-01days on market $195,000 Active 34 DOM
-
2026-05-31statusdays on market $195,000 Active 33 DOM
-
2026-04-28$210,000 New 724-char remark
-
2011-07-21historical 60-char remark
Show marketing remark (60 chars)
GREAT STARTER HOME OR INVESTMENT OPPORTUNITY FENCED BACKYARD
-
2011-07-18soldstatus $22,900 Sold 60-char remark
Show marketing remark (60 chars)
GREAT STARTER HOME OR INVESTMENT OPPORTUNITY FENCED BACKYARD
-
2011-07-05status Pending 60-char remark
Show marketing remark (60 chars)
GREAT STARTER HOME OR INVESTMENT OPPORTUNITY FENCED BACKYARD
-
2011-06-08$22,900 Active 60-char remark
Show marketing remark (60 chars)
GREAT STARTER HOME OR INVESTMENT OPPORTUNITY FENCED BACKYARD
-
2004-12-27soldstatus $102,000
-
1996-07-25soldstatus $58,500
ⓘ Source: listings_history table (triggers on properties + properties_extension) + one-shot
backfill from property_details.listing_events for pre-trigger history.
Tax reassessment forecast GA · Resets to sale price
- Current annual tax
- $2,705 · $225/mo
- Projected year-2 tax
- $2,705 · $225/mo
- Expected delta
- $0/yr ($0/mo · 0.0%)
ⓘ Screening estimate from a state-policy table — verify with the county assessor before closing.
Climate risk First Street
- Flood 5/10 Major FEMA zone X (unshaded) · 68% chance over 30 yrs
- Wildfire 1/10 Low
- Heat 6/10 Major 7 d/yr ≥105°F today · 18 d/yr by 30 yrs out
- Wind 6/10 Major 27% chance of damaging wind over 30 yrs
- Air quality 4/10 Moderate 4 unhealthy d/yr today · 7 by 30 yrs out
Nearby sold comps map
Loading sold comps map…
Walkable amenities ~0.75 mi
Loading nearby amenities…
Taxation est. · year 1
- Rental income
- $19,244
- − Mortgage interest
- −$10,923
- − Property taxes
- −$2,705
- − Insurance
- −$975
- − Repairs & maintenance
- −$1,539
- − Management
- −$1,539
- − Depreciation
- −$5,673
- Taxable loss
- −$4,111
- Est. tax savings @ 24.0%
- +$987
- After-tax cash flow
- $238/yr
For passive investors: Depreciation is non-cash, so a rental often shows a tax loss while cash-flowing — sheltering income. Rental losses are passive: they offset passive income freely, and up to $25,000/yr can offset ordinary (W-2) income if you actively participate and your MAGI is under $100k (phasing out to $0 by $150k); unused losses carry forward. On sale, claimed depreciation is recaptured at up to 25%, and gains may owe capital-gains tax (a 1031 exchange can defer both). Figures are a year-1 estimate at your 24.0% rate — not tax advice; consult a CPA.
Schools (NCES district)
- District
- Clayton County
- NCES district ID
- 1301230
- Math proficiency
- 11% ▼ -13.00%
- Reading proficiency
- 20% ▼ -9.00%
- Median HH income
- $42,266
- Composite
- 13.41/100
- National rank
- #9527
- State rank
- #155 of 174 in GA
Livability — Jonesboro
- Score
- 72/100
- State rank
- #63
- US rank
- #6030
Category grades
Schools grade is shown separately in the Schools card above.
Census & demographics
- County
- Clayton County · 230,153 people
- City population
- 93,280
- Metro
- Atlanta-Sandy Springs-Alpharetta, GA
- Population (ZIP)
- 50,089
- Household income
- $66,973
- Rent vs Own
- Severe rent burden
- 2024.0
Population outlook (Clayton County) Hauer SSP2
- Today (2025)
- 310,777 people
- By 2030
- 329,762 · +6.1%
- By 2040
- 368,052 · +18.4%
- By 2050
- 401,196 · +29.1%
- By 2075
- 472,488 · +52.0%
- By 2100
- 500,446 · +61.0%
Race, ethnicity, and origin ACS 2023
- Neighborhood character
- Diverse neighborhood (Simpson 0.56)
- Race & ethnicity
- Black 64% White 14% Hispanic / Latino 11% Two or more races 8% Asian 5%
- Hispanic origin (detail)
- Mexican 6% Puerto Rican 1%
- Common ancestry
- Slovak 1% Italian 1% Hispanic 1%
- Foreign-born
- 13% · Canada, Vietnam, China
- Languages at home
- 81% English-only · Spanish 10% Vietnamese 3% French/Haitian/Cajun 2%
Political lean MEDSL · Clayton
- 2024 margin
- Solid D (+69.2) · D 84.3% · R 15.1%
- 2008→2024 swing
- +2.8pp toward D · 2008: 66.4pp · 2024: 69.2pp
- All cycles
- 2024: D+69.2 2020: D+70.9 2016: D+71.9 2012: D+70.1 2008: D+66.4
Not yet ingested
- Civics
- —
Market trends
- HPI YoY
- ▼ -137.02%
- Current HPI
- 204.1778
- Rent YoY
- ▲ 2.15%
- Metro
- Atlanta-Sandy Springs-Alpharetta, GA
- State GDP YoY
- ▲ 2.66%
- F500 in state
- 28
Industry mix (Fortune 500 HQ in GA)
| Industry | F500 HQs | Revenue |
|---|---|---|
| Paper / Packaging | 2 | $29B |
|
||
| Retail | 1 | $160B |
|
||
| Transportation / Logistics | 1 | $91B |
|
||
| Airlines | 1 | $62B |
|
||
| Consumer Goods | 1 | $47B |
|
||
| Utilities | 1 | $25B |
|
||
Price history
+233.3% since first listed8 events — show timeline
- 2026-05-28 Price Changed $195,000 GAMLS
- 2026-04-28 Listed $210,000 GAMLS
- 2011-07-21 Listing Removed — FMLS
- 2011-07-18 Sold (MLS) $22,900 FMLS
- 2011-07-05 Pending — FMLS
- 2011-06-08 Listed $22,900 FMLS
- 2004-12-27 Sold (Public Records) $102,000 Public Records
- 1996-07-25 Sold (Public Records) $58,500 Public Records
Property tax history
+9.0%/yrLatest (2025): $2,705 · +11.0% YoY. Source: county tax records.
Cash-flow waterfall
monthlySold comps — $/sqft
last 12 mo · ≤1 miLoading sold comps…