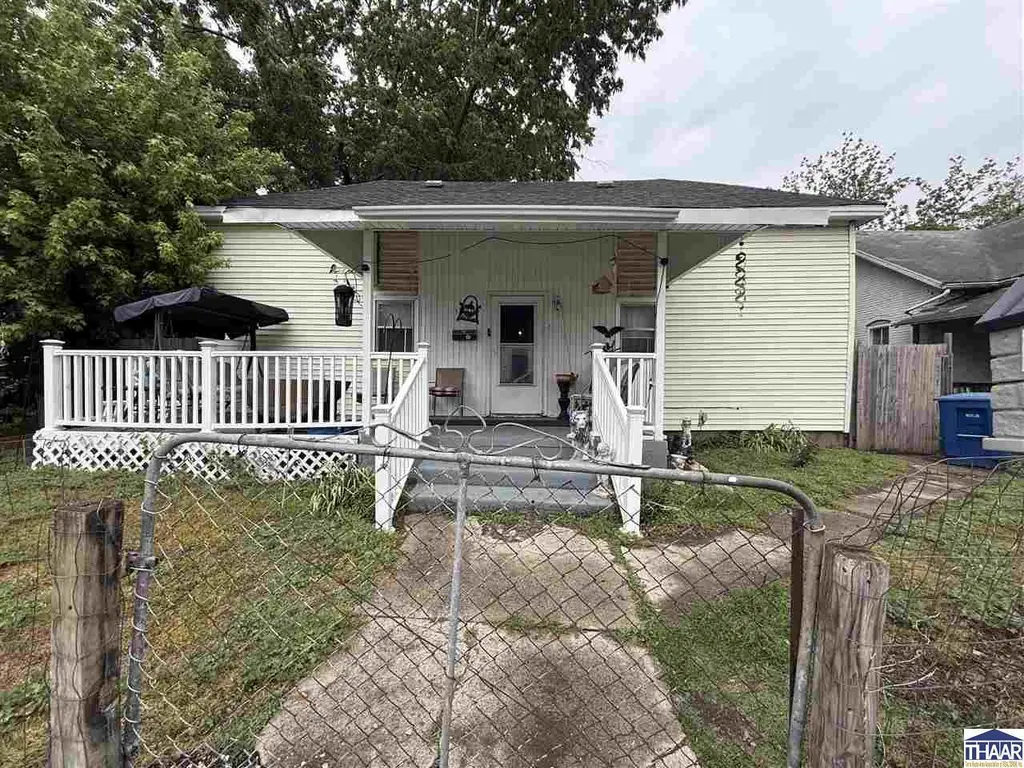
1008 N 9th St · Vincennes, IN
Flood risk 4/10 · Minor
- FEMA flood zone
- —
- Chance of flooding over 30 yrs
- 0.2%
- Est. flood insurance / yr
- —
Fire risk 1/10 · Minimal
- Est. fire insurance / yr
- $717 – $1,331
Heat risk 5/10 · Moderate
- Hot days now (above 106°F)
- 7 days/yr
- Hot days in 30 yrs
- 19 days/yr
Wind risk 2/10 · Minimal
- Chance of severe wind over 30 yrs
- 2.0%
Air-quality risk 3/10 · Minor
- Unhealthy air days now
- 2 days/yr
- Unhealthy air days in 30 yrs
- 3 days/yr
Risk factors via First Street. Map © Google.
Why this score? — see what drove the C+ grade
The composite is a weighted blend of 9 inputs, each scored 0–100. Each bar is that input's sub-score; the figure is the points it added to the 100-point composite (weight × sub-score).
- Cash flow +24.9/30.0
- ARV discount +10.8/15.0
- DSCR +8.1/10.0
- 1% rule +5.2/10.0
- Livability +3.5/5.0
- Schools +3.0/10.0
- Rent growth +2.5/5.0
- Condition / age +2.5/5.0
- Appreciation +0.0/10.0
$96,000
🖨 Deal sheet 📄 Offer letter ✓ Due diligence
Listing remarks
Comfort, Convenience, and Move-In Ready Living You’ve been searching for a home that’s affordable, updated, and ready for you to move right in and this one delivers. Located at 1008 N 9th St in Vincennes, this 2-bedroom, 1-bath home offers a functional layout with a dedicated dining room for everyday meals or gatherings. The new carpet adds a fresh feel, making it easy to settle in from day one. Start your mornings on the covered front porch and unwind in the evenings on the back deck, overlooking your fenced-in yard perfect for pets, play, or relaxing outdoors. Need extra storage? You’ll appreciate the two sheds, giving you space for tools, lawn equipment, or hobbies. Wi
Key facts
- Covered front porch
- Back deck
- Fenced-in yard
Tags
Property features AI
Exterior
- Utilities: Public sewer
- Home design: Single-family residence; One story
- Construction: Vinyl siding; Shingle roof
- Exterior features: Covered deck; Outbuilding / shed
Interior
- Kitchen: Electric range; Electric oven; Refrigerator; Freezer; Dishwasher
- Flooring: Carpet
- Bathrooms: 1 full bathroom
- Heating & cooling: Natural gas heating; Central air conditioning; Ceiling fans
- Interior features: Partial basement; Carpet flooring
- Laundry & utility: Washer; Dryer
Neighborhood map
What this means for you Summary
Snapshot
- This is a 3-bed/1.0-bath single-family listed at $96k.
Deal economics
- At list price, monthly cash flow is $207 ($2k/yr) — positive.
- The deal already cash-flows at list — no discount required.
- Meets the 1% rule at list price ($975 rent vs $96k).
- Recommended offer: $93k (3.0% below list) — sets the bar for market timing.
- Cap rate 8.9% vs local median 5.1% in Vincennes — top-decile yield for the area; either an underpriced asset or a hidden risk that comps aren't pricing in. Stress-test before assuming the spread holds.
Location & tenants
- Location reads 70/100 on livability (#148 in IN) — a middle-class / working-renter tenant base. Strengths: cost of living A+, housing A+, health & safety A+; Watch: schools D, amenities F, commute F.
- Vincennes Community School Corporation (town): math 34% / reading 38% proficiency, ranked #193 of 301 in IN (top 64%) — families likely to look elsewhere, expect single-tenant / working-renter base with shorter leases.
- Market conditions: 136 active listings in the ZIP; 1 comparable units currently listed for rent nearby; 36 units permitted in Knox County in 2024 (0 in 5+ unit buildings).
Forward outlook
- Local home prices are declining (-3.0%/yr); year-one equity from $664 of loan paydown is wiped out by about $3k of value loss. Plan a longer hold.
- Knox County population projected at -13% by 2050 — secular population decline; favor cash flow + early exit over multi-decade hold.
Negotiation context
- It's been on market 51 days — a 3% lower offer ($93k) is reasonable based on typical stale-listing flexibility.
- 3 sale attempts since 10y ago with the ask held roughly flat each time — persistent listings suggest the price (not the market) is what's stuck; bring a comps-based counter.
- Current owner paid $28k; list at $96k implies a 243% gain — meaningful room to come down on a strong offer.
Risks & watch-outs
- Watch-outs: built in 1890 — expect roof / HVAC / electrical / plumbing capex.
- Climate carrying-cost: extreme-heat days projected 7→19/yr by 2055 (HVAC capex compounding) — expect insurance premiums to compound above CPI over the hold.
Questions for the listing agent
- It's been on market 51 days. Have you received any prior offers? Is the seller open to a 3% concession, seller financing, or rate buy-down credit?
- Built in 1890 — when were the roof, HVAC, electrical panel, plumbing, and water heater last replaced?
- Is there a deadline driving the sale (1031 exchange, divorce, estate, relocation)? That informs how much negotiation room exists.
- Schools are D-rated, which usually means shorter tenancies and higher turnover. Who's the typical renter profile here, and what's been the actual vacancy rate?
- What's the average days-on-market for RENTAL listings here right now (not sales)? A rising rental-DOM trend means longer vacancies and softer asking-rent achievability than the comps imply.
- What's the recent tenant-quality profile in this submarket — average credit score on applications, eviction rate, late-payment / NSF rate, and stable-employment percentage? A property-management company in the area should have these aggregated.
- How much new for-sale + rental construction is in the pipeline within 1–3 miles? Heavy new supply typically softens prices + rents 12–24 months out; constrained supply supports both.
Investment metrics
- 1% rule
- 1.02% ✓
- Cap rate
- 8.88%
- Cash-on-cash
- 9.23%
- DSCR
- 1.41
- GRM
- 8.2
CMA / ARV
- ARV (median comp)
- $103,500
- List price
- $96,000
- Delta
- -7.25%
- Verdict
- FAIR
- Comps
- 20 within 1.0 mi
Show comp detail 12 sales within ~0.75 mi
| Address | Dist | Beds/Ba | Sqft | Sold | Price | $/sf | Match |
|---|---|---|---|---|---|---|---|
| 914 N 9th St | 0.06mi | 2/1.5 (-1) | 1,186 (+2%) | 4mo | $73,501 | $62 | 85 |
| 911 N 9th St | 0.07mi | 3/1.0 | 1,296 (+11%) | 1mo | $27,500 | $21 | 78 |
| 1001 E Locust St | 0.23mi | 2/1.0 (-1) | 1,092 (-6%) | 0mo | $65,000 | $60 | 73 |
| 1704 Indiana Ave | 0.46mi | 2/1.0 (-1) | 1,128 (-3%) | 4mo | $130,000 | $115 | 64 |
| 1306 Ridgeway Ave | 0.73mi | 3/1.0 | 1,144 (-2%) | 0mo | $97,000 | $85 | 62 |
| 1151 E St. Clair St | 0.39mi | 2/1.0 (-1) | 1,096 (-6%) | 6mo | $105,900 | $97 | 62 |
| 1303 N Upper 11th St | 0.28mi | 2/1.5 (-1) | 1,298 (+11%) | 1mo | $121,000 | $93 | 61 |
| 862 Ridgeway Ave | 0.66mi | 3/2.0 | 1,188 (+2%) | 2mo | $159,000 | $134 | 61 |
| 1218 Mckinley Ave | 0.61mi | 2/1.0 (-1) | 1,206 (+3%) | 0mo | $185,000 | $153 | 61 |
| 1203 Ritterskamp Ave | 0.72mi | 3/1.0 | 1,194 (+2%) | 6mo | $137,500 | $115 | 58 |
| 1172 E Locust St | 0.34mi | 2/1.0 (-1) | 1,008 (-14%) | 4mo | $130,000 | $129 | 53 |
| 1304 Broadway St | 0.58mi | 2/1.0 (-1) | 1,014 (-13%) | 2mo | $35,000 | $35 | 44 |
Match score weights: distance 35% · size 25% · config 20% · recency 20%. Top-matched comps best support the ARV.
Projected returns pro-forma
-3.0% appreciation · 3.0% rent growth · sell at horizon
- IRR
- -2.4%
- Equity multiple
- 0.91×
- Total profit
- $-2,433
- Equity at exit
- $14,314
- IRR
- 7.2%
- Equity multiple
- 1.55×
- Total profit
- $14,650
- Equity at exit
- $8,300
Cash invested: $26,880 (down + closing). Projections, not guarantees.
Landlord ↔ Tenant lean methodology
- Overall (STATE)
- 90 Strongly Landlord-Friendly
- State Indiana
- 90 Strongly Landlord-Friendly · R+11
- County
- — inherits STATE
- City
- — inherits STATE
ZIP-level market 47591
- Home prices YoY
- -19.5%
- Active inventory
- 136
- Price-to-rent
- 8.2×
Monthly cashflow live
- Estimated rent
- $975 medium interval (Pro) →
- Mortgage (P&I)
- −$503
- Tax from tax record
- −$20 /mo · $240/yr
- Insurance
- −$40
- HOA
- −$0
- Vacancy / Maint / Mgmt
- −$205
- Net cashflow
- $207
Break-even live
UW: 25.0% down · 7.5% · 30yr · 1.5% tax · 5.0% vac · 8.0% maint · 8.0% mgmt
Financing live
Cash to close
- Down payment
- $24,000
- Closing costs
- $2,880
- Reserves months
- —
- Total cash needed
- —
Loan-product check · same deal, 3 products live
Conventional
25% down · 7.5% · 30yr
- Down + closing
- —
- Monthly P&I
- —
- Monthly cashflow
- —
- DSCR
- —
- Eligible?
- —
Personal DTI + credit; lowest rate.
DSCR
20% down · 8.5% · 30yr
- Down + closing
- —
- Monthly P&I
- —
- Monthly cashflow
- —
- DSCR
- —
- Eligible?
- —
No personal income docs; deal must DSCR.
Hard money
10% down · 12.0% · 12mo
- Down + closing
- —
- Monthly P&I
- —
- Monthly cashflow
- —
- DSCR
- —
- Eligible?
- —
Short-term bridge; refi at stabilization.
Rent comps 1 comps
| Address | Beds | Baths | Sqft | Rent | $/sqft | DOM | Units | Dist |
|---|---|---|---|---|---|---|---|---|
| 721 N 7th St Unit A Vincennes, IN | 2.0 | 1.0 | 1000 | $975 | $0.97 | 43d | 1 | 0.21mi |
Listing history 19 events
-
2026-06-18days on market $96,000 Active 51 DOM
-
2026-06-17days on market $96,000 Active 50 DOM
-
2026-06-16days on market $96,000 Active 49 DOM
-
2026-06-15days on market $96,000 Active 48 DOM
-
2026-06-13days on market $96,000 Active 46 DOM
-
2026-06-12days on market $96,000 Active 45 DOM
-
2026-06-09days on market $96,000 Active 42 DOM
-
2026-06-08days on market $96,000 Active 41 DOM
-
2026-06-07days on market $96,000 Active 40 DOM
-
2026-06-07days on market $96,000 Active 39 DOM
-
2026-06-04days on market $96,000 Active 36 DOM
-
2026-06-02days on market $96,000 Active 35 DOM
-
2026-06-01days on market $96,000 Active 34 DOM
-
2026-05-31days on market $96,000 Active 33 DOM
-
2026-05-31days on market $96,000 Active 32 DOM
-
2026-04-28$96,000 Active 844-char remark
-
2023-12-08$35,000 Active
-
2017-11-27soldstatus $28,000
-
2016-03-29$26,900
ⓘ Source: listings_history table (triggers on properties + properties_extension) + one-shot
backfill from property_details.listing_events for pre-trigger history.
Tax reassessment forecast IN · Partial reset (capped growth)
- Current annual tax
- $240 · $20/mo
- Projected year-2 tax
- $528 · $44/mo
- Expected delta
- +$288/yr (+$24/mo · 119.7%)
ⓘ Screening estimate from a state-policy table — verify with the county assessor before closing.
Climate risk First Street
- Flood 4/10 Moderate 20% chance over 30 yrs
- Wildfire 1/10 Low
- Heat 5/10 Major 7 d/yr ≥106°F today · 19 d/yr by 30 yrs out
- Wind 2/10 Low 2% chance of damaging wind over 30 yrs
- Air quality 3/10 Moderate 2 unhealthy d/yr today · 3 by 30 yrs out
Nearby sold comps map
Loading sold comps map…
Walkable amenities ~0.75 mi
Loading nearby amenities…
Taxation est. · year 1
- Rental income
- $11,700
- − Mortgage interest
- −$5,377
- − Property taxes
- −$240
- − Insurance
- −$480
- − Repairs & maintenance
- −$936
- − Management
- −$936
- − Depreciation
- −$2,793
- Taxable income
- $937
- Est. tax owed @ 24.0%
- −$225
- After-tax cash flow
- $2,256/yr
For passive investors: Depreciation is non-cash, so a rental often shows a tax loss while cash-flowing — sheltering income. Rental losses are passive: they offset passive income freely, and up to $25,000/yr can offset ordinary (W-2) income if you actively participate and your MAGI is under $100k (phasing out to $0 by $150k); unused losses carry forward. On sale, claimed depreciation is recaptured at up to 25%, and gains may owe capital-gains tax (a 1031 exchange can defer both). Figures are a year-1 estimate at your 24.0% rate — not tax advice; consult a CPA.
Schools (NCES district)
- District
- Vincennes Community School Corporation
- NCES district ID
- 1812120
- Math proficiency
- 34% ▼ -5.00%
- Reading proficiency
- 38% ▼ -4.00%
- Median HH income
- $38,359
- Composite
- 30.05/100
- National rank
- #6354
- State rank
- #193 of 301 in IN
Livability — Vincennes
- Score
- 70/100
- State rank
- #148
- US rank
- #7480
Category grades
Schools grade is shown separately in the Schools card above.
Census & demographics
- Census place
- Vincennes, IN
- Population (ZIP)
- 25,191
Population outlook (Knox County) Hauer SSP2
- Today (2025)
- 37,092 people
- By 2030
- 36,271 · -2.2%
- By 2040
- 34,196 · -7.8%
- By 2050
- 32,405 · -12.6%
- By 2075
- 28,754 · -22.5%
- By 2100
- 24,110 · -35.0%
Race, ethnicity, and origin ACS 2023
- Neighborhood character
- Predominantly White (88%)
- Race & ethnicity
- White 88% Two or more races 6% Hispanic / Latino 3% Black 2% Asian 1%
- Common ancestry
- Lithuanian 4% Romanian 2% Slovak 2%
- Foreign-born
- 3% · Canada, China
- Languages at home
- 95% English-only · Spanish 2% French/Haitian/Cajun 1% Chinese 1%
Political lean MEDSL · Knox
- 2024 margin
- Solid R (+50.4) · D 24.0% · R 74.4% · Other 1.6%
- 2008→2024 swing
- -43.9pp toward R · 2008: -6.5pp · 2024: -50.4pp
- All cycles
- 2024: R+50.4 2020: R+47.4 2016: R+47.2 2012: R+28.9 2008: R+6.5
Not yet ingested
- Civics
- —
Market trends
- HPI YoY
- ▼ -47.26%
- Current HPI
- 194.903
- Rent YoY
- —
- Metro
- —
- State GDP YoY
- ▲ 2.90%
- F500 in state
- 18
Industry mix (Fortune 500 HQ in IN)
| Industry | F500 HQs | Revenue |
|---|---|---|
| Industrial Machinery | 2 | $37B |
|
||
| Healthcare | 1 | $177B |
|
||
| Pharmaceuticals | 1 | $45B |
|
||
| Metals / Steel | 1 | $18B |
|
||
| Agriculture | 1 | $17B |
|
||
| Packaging | 1 | $12B |
|
||
Price history
+256.9% since first listed4 events — show timeline
- 2026-04-28 Listed $96,000 THAAR
- 2023-12-08 Listed $35,000 IRMLS
- 2017-11-27 Sold (Public Records) $28,000 Public Records
- 2016-03-29 Listed $26,900 IRMLS
Property tax history
-13.9%/yrLatest (2024): $240 · +33.6% YoY. Source: county tax records.
Cash-flow waterfall
monthlySold comps — $/sqft
last 12 mo · ≤1 miLoading sold comps…