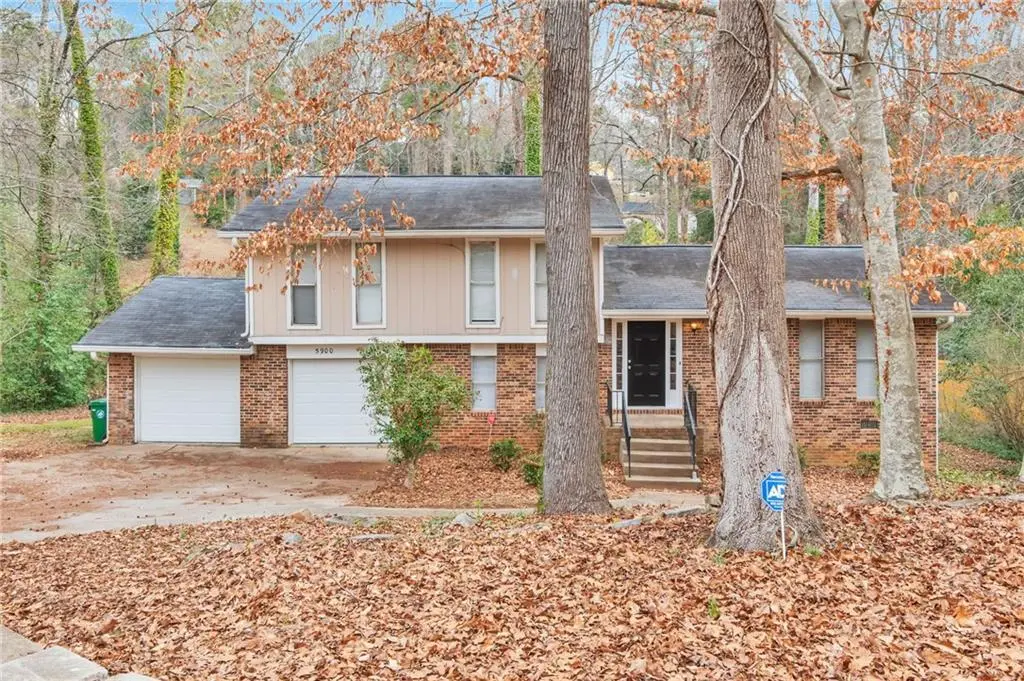
5900 Simone Dr · Stone Mountain, GA
Flood risk 9/10 · Severe
- FEMA flood zone
- X (unshaded)
- Chance of flooding over 30 yrs
- 0.99%
- Est. flood insurance / yr
- $507 – $1,088
Fire risk 3/10 · Minor
- Est. fire insurance / yr
- $963 – $1,789
Heat risk 5/10 · Moderate
- Hot days now (above 104°F)
- 7 days/yr
- Hot days in 30 yrs
- 18 days/yr
Wind risk 4/10 · Minor
- Chance of severe wind over 30 yrs
- 23.0%
Air-quality risk 5/10 · Moderate
- Unhealthy air days now
- 7 days/yr
- Unhealthy air days in 30 yrs
- 10 days/yr
Risk factors via First Street. Map © Google.
Why this score? — see what drove the D grade
The composite is a weighted blend of 9 inputs, each scored 0–100. Each bar is that input's sub-score; the figure is the points it added to the 100-point composite (weight × sub-score).
- ARV discount +15.0/15.0
- Cash flow +11.6/30.0
- Livability +4.0/5.0
- 1% rule +3.7/10.0
- DSCR +3.4/10.0
- Rent growth +2.8/5.0
- Condition / age +2.5/5.0
- Schools +2.1/10.0
- Appreciation +0.0/10.0
$255,000
🖨 Deal sheet (PDF) 📄 Offer letter ✓ Due diligence
Listing remarks MLS
Welcome to 5900 Simone Dr, a beautifully maintained home nestled in an established community in Stone Mountain. This inviting residence offers a comfortable and functional layout designed for both everyday living and effortless entertaining. The spacious living areas are filled with natural light, creating a warm and welcoming atmosphere, while the kitchen provides ample cabinet and counter space to meet all your culinary needs. Generously sized bedrooms offer peaceful retreats, and the primary suite provides added privacy and comfort. Step outside to enjoy a private backyard ideal for relaxing evenings, outdoor gatherings, or creating your own garden oasis. Conveniently located near shopping, dining, parks, and major commuter routes, this home blends suburban tranquility with everyday convenience-making it a wonderful opportunity you won't want to miss.
Key facts
- Private backyard
- 0.51 acre lot
- 2 garage spots
Tags
Neighborhood map
What this means for you Summary
Snapshot
- This is a 3-bed/2.5-bath single-family listed at $255k.
Deal economics
- At list price, monthly cash flow is $-148 ($-2k/yr) — negative.
- To cash-flow at today's rent, offer at most $229k (10.2% below list).
- To meet the 1% rule (rent ≥ 1% of price), the offer needs to be $221k (13.4% below list).
- Recommended offer: $221k (13.4% below list) — sets the bar for 1% rule.
Location & tenants
- Location reads 79/100 on livability (#11 in GA, #1,977 nationally) — a middle-class / working-renter tenant base. Strengths: commute A+, cost of living A+, housing A+; Watch: employment D+, crime F.
- Dekalb County (suburban): math 19% / reading 28% proficiency, ranked #125 of 174 in GA (top 72%) — low school quality limits family demand, transient renter base, plan for 1-2y turnover; 68% free/reduced lunch — lower-income household profile, screen leases tightly.
- Zoned schools: Pine Ridge Elementary School (math 8% / reading 8%, grade F, #1,125 of 1,228 statewide, top 93%, 597 students, 100% FRL); Stephenson Middle School (math 8% / reading 22%, grade F, #399 of 470 statewide, top 86%, 812 students, 100% FRL); Stephenson High School (math 9% / reading 25%, grade F, #277 of 424 statewide, top 67%, 1,354 students, 64% FRL) — zoned schools average 88% FRL vs 68% district-wide (20 pts higher); higher-poverty schools than district average — tighter screening recommended.
- Market conditions: Rents rising (+1.3%/yr); 250 active listings in the ZIP; 26 comparable units currently listed for rent nearby; rentals at typical pace (median 26d on market — plan ~3-4 weeks tenant-placement turnaround); solid renter incomes; 1,240 units permitted in DeKalb County in 2024 (385 in 5+ unit buildings).
Forward outlook
- Local home prices are declining (-3.0%/yr); year-one equity from $2k of loan paydown is wiped out by about $8k of value loss. Plan a longer hold.
- DeKalb County population projected at +28% by 2050 — long-run rental-demand tailwind backs the buy-and-hold thesis.
Negotiation context
- It's been on market 86 days — a 6% lower offer ($240k) is reasonable based on typical stale-listing flexibility.
- 6 sale attempts since 11y ago with the ask held roughly flat each time — persistent listings suggest the price (not the market) is what's stuck; bring a comps-based counter.
- Current owner paid $95k; list at $255k implies a 168% gain — meaningful room to come down on a strong offer.
Risks & watch-outs
- Watch-outs: flood insurance adds $66/mo.
- Climate carrying-cost: severe flood risk; extreme-heat days projected 7→18/yr by 2055 (HVAC capex compounding) — expect insurance premiums to compound above CPI over the hold.
Questions for the listing agent
- What do current leases actually rent for vs. the listed asking? Can we see a recent rent roll and the last 12 months of T-12 income?
- It's been on market 86 days. Have you received any prior offers? Is the seller open to a 13% concession, seller financing, or rate buy-down credit?
- Built in 1973 — when were the roof, HVAC, electrical panel, plumbing, and water heater last replaced?
- What's the actual annual flood-insurance premium (NFIP or private), and is the property in a SFHA with mandatory coverage?
- Why hasn't it sold? Are there any deal-killer items the seller is aware of (foundation, flood, title, zoning, code violations)?
- Is there a deadline driving the sale (1031 exchange, divorce, estate, relocation)? That informs how much negotiation room exists.
- Schools are F-rated, which usually means shorter tenancies and higher turnover. Who's the typical renter profile here, and what's been the actual vacancy rate?
- Crime grade is F in this area — have there been break-ins, vandalism, or insurance claims at this property in the last 3 years? What carrier currently insures it and at what premium?
- The area grade is low — what's the realistic commute time and amenity access for the typical tenant pool here? Any planned neighborhood developments (good or bad) we should know about?
- What's the average days-on-market for RENTAL listings here right now (not sales)? A rising rental-DOM trend means longer vacancies and softer asking-rent achievability than the comps imply.
- What's the recent tenant-quality profile in this submarket — average credit score on applications, eviction rate, late-payment / NSF rate, and stable-employment percentage? A property-management company in the area should have these aggregated.
- How much new for-sale + rental construction is in the pipeline within 1–3 miles? Heavy new supply typically softens prices + rents 12–24 months out; constrained supply supports both.
Investment metrics
- 1% rule
- 0.87% ✗
- Cap rate
- 5.91%
- Cash-on-cash
- -1.36%
- DSCR
- 0.94
- GRM
- 9.6
CMA / ARV
- ARV (median comp)
- $310,043
- List price
- $255,000
- Delta
- -17.75%
- Verdict
- UNDERPRICED
- Comps
- 20 within 1.0 mi
Show comp detail 12 sales within ~0.75 mi
| Address | Dist | Beds/Ba | Sqft | Sold | Price | $/sf | Match |
|---|---|---|---|---|---|---|---|
| 5900 Simone Dr | 0.00mi | 4/3.0 (+1) | 1,737 (0%) | 1mo | $255,000 | $147 | 92 |
| 644 Navarre Dr | 0.08mi | 4/3.0 (+1) | 1,751 (+1%) | 3mo | $309,900 | $177 | 86 |
| 577 Simone Way | 0.11mi | 3/2.0 | 1,818 (+5%) | 1mo | $309,900 | $170 | 85 |
| 5916 Simone Dr | 0.02mi | 3/2.0 | 1,712 (-1%) | 14mo | $329,999 | $193 | 83 |
| 5809 Oakleaf Way | 0.23mi | 3/2.5 | 1,852 (+7%) | 2mo | $235,000 | $127 | 77 |
| 563 Navarre Dr | 0.25mi | 3/2.0 | 1,691 (-3%) | 12mo | $309,900 | $183 | 72 |
| 482 Maid Marion Ln | 0.56mi | 3/2.5 | 1,776 (+2%) | 4mo | $260,000 | $146 | 67 |
| 5786 Longbow Dr | 0.30mi | 3/3.0 | 1,604 (-8%) | 6mo | $227,000 | $142 | 66 |
| 441 Navarre Dr | 0.47mi | 3/2.0 | 1,676 (-4%) | 14mo | $299,900 | $179 | 59 |
| 5802 Oakleaf Dr | 0.40mi | 3/2.5 | 1,918 (+10%) | 8mo | $231,000 | $120 | 58 |
| 5847 Navarre Ct | 0.46mi | 3/2.5 | 1,832 (+6%) | 16mo | $350,000 | $191 | 56 |
| 5848 Navarre Ct | 0.50mi | 3/2.0 | 1,516 (-13%) | 7mo | $220,000 | $145 | 48 |
Match score weights: distance 35% · size 25% · config 20% · recency 20%. Top-matched comps best support the ARV.
Projected returns pro-forma
-3.0% appreciation · 1.3% rent growth · sell at horizon
- IRR
- -22.4%
- Equity multiple
- 0.24×
- Total profit
- $-54,325
- Equity at exit
- $38,021
- IRR
- -21.8%
- Equity multiple
- -0.03×
- Total profit
- $-73,684
- Equity at exit
- $22,048
Cash invested: $71,400 (down + closing). Projections, not guarantees.
Landlord ↔ Tenant lean methodology
- Overall (STATE)
- 90 Strongly Landlord-Friendly
- State Georgia
- 90 Strongly Landlord-Friendly · R+3
- County
- — inherits STATE
- City
- — inherits STATE
ZIP-level market 30087
- Rents YoY
- 1.3%
- Active inventory
- 250
- Price-to-rent
- 9.6×
Monthly cashflow live
- Estimated rent
- $2,209 high interval (Pro) →
- Mortgage (P&I)
- −$1,337
- Tax from tax record
- −$383 /mo · $4,590/yr
- Insurance
- −$106
- Flood insurance flood zone
- −$66 /mo · $798/yr
- HOA
- −$0
- Vacancy / Maint / Mgmt
- −$464
- Net cashflow
- $-148
Break-even live
Sensitivity live
| Price | -10% $-3 | -5% $-75 | +0% $-148 | +5% $-220 | +10% $-292 |
|---|---|---|---|---|---|
| Rent | -10% $-322 | -5% $-235 | +0% $-148 | +5% $-60 | +10% $27 |
| Rate | -1.0pp $-19 | -0.5pp $-83 | base $-148 | +0.5pp $-214 | +1.0pp $-281 |
UW: 25.0% down · 7.5% · 30yr · 1.5% tax · 5.0% vac · 8.0% maint · 8.0% mgmt
Financing live
Cash to close
- Down payment
- $63,750
- Closing costs
- $7,650
- Reserves months
- —
- Total cash needed
- —
Loan-product check · same deal, 3 products live
Conventional
25% down · 7.5% · 30yr
- Down + closing
- —
- Monthly P&I
- —
- Monthly cashflow
- —
- DSCR
- —
- Eligible?
- —
Personal DTI + credit; lowest rate.
DSCR
20% down · 8.5% · 30yr
- Down + closing
- —
- Monthly P&I
- —
- Monthly cashflow
- —
- DSCR
- —
- Eligible?
- —
No personal income docs; deal must DSCR.
Hard money
10% down · 12.0% · 12mo
- Down + closing
- —
- Monthly P&I
- —
- Monthly cashflow
- —
- DSCR
- —
- Eligible?
- —
Short-term bridge; refi at stabilization.
Rent comps 26 comps
| Address | Beds | Baths | Sqft | Rent | $/sqft | DOM | Units | Dist |
|---|---|---|---|---|---|---|---|---|
| 643 Navarre Dr Stone Mountain, GA | 3.0 | 2.5 | 1666 | $2,600 | $1.56 | 45d | 1 | 0.06mi |
| 5811 Navarre Ct Stone Mountain, GA | 3.0 | 2.0 | 1864 | $1,911 | $1.03 | 4d | 1 | 0.43mi |
| 5702 Wells Cir Stone Mountain, GA | 2.0 | 2.5 | 1160 | $1,495 | $1.29 | 45d | 1 | 0.60mi |
| 5707 Wells Cir Stone Mountain, GA | 2.0 | 2.5 | 1160 | $1,506 | $1.30 | 6d | 1 | 0.62mi |
| 469 Sherwood Grn Stone Mountain, GA | 3.0 | 2.0 | 1792 | $1,810 | $1.01 | 12d | 1 | 0.63mi |
| 5713 Wells Cir Stone Mountain, GA | 3.0 | 2.5 | 1304 | $1,706 | $1.31 | 7d | 1 | 0.63mi |
| 5621 Stonington Trace Pkwy Stone Mountain, GA | 2.0 | 3.5 | 1292 | $1,581 | $1.22 | 17d | 1 | 0.63mi |
| 427 Chanterelle Dr Stone Mountain, GA | 3.0 | 2.5 | 1608 | $1,650 | $1.03 | 4d | 1 | 0.76mi |
| 450 Pennybrook Dr Stone Mountain, GA | 3.0 | 2.0 | 1404 | $1,750 | $1.25 | 26d | 1 | 0.81mi |
| 5994 Pattillo Ln Lithonia, GA | 3.0 | 2.5 | 1680 | $1,940 | $1.15 | 7d | 1 | 0.83mi |
| 564 Field Cliff Dr Stone Mountain, GA | 4.0 | 3.0 | 2200 | $5,500 | $2.50 | 45d | 1 | 0.90mi |
| 524 Julius Dr Stone Mountain, GA | 3.0 | 2.0 | 1780 | $1,795 | $1.01 | 45d | 1 | 0.91mi |
| 651 Mincey Woods Ct Stone Mountain, GA | 3.0 | 2.0 | 2188 | $2,150 | $0.98 | 45d | 1 | 0.93mi |
| 732 Shadow Lake Dr Lithonia, GA | 4.0 | 2.5 | 2200 | $2,800 | $1.27 | 26d | 1 | 0.93mi |
| 811 King Rd Stone Mountain, GA | 3.0 | 3.0 | 1840 | $3,300 | $1.79 | 45d | 1 | 0.99mi |
| 557 Shadow Valley Ct Lithonia, GA | 3.0 | 2.5 | 1588 | $1,700 | $1.07 | 45d | 1 | 1.03mi |
| 6445 Greenock Dr Unit 1 Stone Mountain, GA | 2.0 | 2.5 | 1200 | $2,450 | $2.04 | 45d | 1 | 1.05mi |
| 5612 Pennybrook Ct Stone Mountain, GA | 3.0 | 2.0 | 1364 | $1,941 | $1.42 | 14d | 1 | 1.08mi |
| 597 Shadow Valley Ct Lithonia, GA | 3.0 | 2.0 | 2141 | $1,879 | $0.88 | 45d | 1 | 1.09mi |
| 481 Stephenson Rd Stone Mountain, GA | 3.0 | 1.0 | 1396 | $1,855 | $1.33 | 7d | 1 | 1.17mi |
| 5509 Stonehaven Way Stone Mountain, GA | 4.0 | 3.0 | 1635 | $1,899 | $1.16 | 23d | 1 | 1.27mi |
| 5734 Lanny Ln Lithonia, GA | 3.0 | 2.0 | 1589 | $1,800 | $1.13 | 26d | 1 | 1.31mi |
| 782 Fox Valley Dr Stone Mountain, GA | 4.0 | 2.0 | 1964 | $2,000 | $1.02 | 26d | 1 | 1.32mi |
| 5486 Fox Valley Ln Stone Mountain, GA | 3.0 | 2.5 | 1536 | $1,850 | $1.20 | 21d | 1 | 1.33mi |
| 5308 Omalley Ln Stone Mountain, GA | 4.0 | 2.5 | 1950 | $1,949 | $1.00 | 45d | 1 | 1.42mi |
| 5370 Zachary Dr Stone Mountain, GA | 4.0 | 2.0 | 1556 | $1,150 | $0.74 | 26d | 1 | 1.50mi |
Listing history 17 events
-
2026-05-16status Under Contract 866-char remark
Show marketing remark (878 chars)
Welcome to 5900 Simone Dr, a beautifully maintained home nestled in an established community in Stone Mountain. This inviting residence offers a comfortable and functional layout designed for both everyday living and effortless entertaining. The spacious living areas are filled with natural light, creating a warm and welcoming atmosphere, while the kitchen provides ample cabinet and counter space to meet all your culinary needs. Generously sized bedrooms offer peaceful retreats, and the primary suite provides added privacy and comfort. Step outside to enjoy a private backyard ideal for relaxing evenings, outdoor gatherings, or creating your own garden oasis. Conveniently located near shopping, dining, parks, and major commuter routes, this home blends suburban tranquility with everyday convenience—making it a wonderful opportunity you won’t want to miss.
-
2026-05-16status Pending 878-char remark
Show marketing remark (878 chars)
Welcome to 5900 Simone Dr, a beautifully maintained home nestled in an established community in Stone Mountain. This inviting residence offers a comfortable and functional layout designed for both everyday living and effortless entertaining. The spacious living areas are filled with natural light, creating a warm and welcoming atmosphere, while the kitchen provides ample cabinet and counter space to meet all your culinary needs. Generously sized bedrooms offer peaceful retreats, and the primary suite provides added privacy and comfort. Step outside to enjoy a private backyard ideal for relaxing evenings, outdoor gatherings, or creating your own garden oasis. Conveniently located near shopping, dining, parks, and major commuter routes, this home blends suburban tranquility with everyday convenience—making it a wonderful opportunity you won’t want to miss.
-
2026-02-13$255,000 New 866-char remark
Show marketing remark (878 chars)
Welcome to 5900 Simone Dr, a beautifully maintained home nestled in an established community in Stone Mountain. This inviting residence offers a comfortable and functional layout designed for both everyday living and effortless entertaining. The spacious living areas are filled with natural light, creating a warm and welcoming atmosphere, while the kitchen provides ample cabinet and counter space to meet all your culinary needs. Generously sized bedrooms offer peaceful retreats, and the primary suite provides added privacy and comfort. Step outside to enjoy a private backyard ideal for relaxing evenings, outdoor gatherings, or creating your own garden oasis. Conveniently located near shopping, dining, parks, and major commuter routes, this home blends suburban tranquility with everyday convenience—making it a wonderful opportunity you won’t want to miss.
-
2026-02-13$255,000 Active 878-char remark
Show marketing remark (878 chars)
Welcome to 5900 Simone Dr, a beautifully maintained home nestled in an established community in Stone Mountain. This inviting residence offers a comfortable and functional layout designed for both everyday living and effortless entertaining. The spacious living areas are filled with natural light, creating a warm and welcoming atmosphere, while the kitchen provides ample cabinet and counter space to meet all your culinary needs. Generously sized bedrooms offer peaceful retreats, and the primary suite provides added privacy and comfort. Step outside to enjoy a private backyard ideal for relaxing evenings, outdoor gatherings, or creating your own garden oasis. Conveniently located near shopping, dining, parks, and major commuter routes, this home blends suburban tranquility with everyday convenience—making it a wonderful opportunity you won’t want to miss.
-
2018-03-21historical
-
2018-02-07status Back on Market
-
2018-01-29status Under Contract
-
2018-01-26status Back on Market
-
2018-01-25status Under Contract
-
2018-01-16$119,900 New
-
2015-04-20historical
-
2015-02-05historical Pending Approval
-
2015-01-17price $54,900
-
2015-01-14$59,900 New
-
1997-02-26soldstatus $95,000
-
1988-02-18soldstatus $79,900
-
1985-07-30soldstatus $77,900
ⓘ Source: listings_history table (triggers on properties + properties_extension) + one-shot
backfill from property_details.listing_events for pre-trigger history.
Tax reassessment forecast GA · Resets to sale price
- Current annual tax
- $4,590 · $383/mo
- Projected year-2 tax
- $4,590 · $383/mo
- Expected delta
- $0/yr ($0/mo · 0.0%)
ⓘ Screening estimate from a state-policy table — verify with the county assessor before closing.
Climate risk First Street
- Flood 9/10 Extreme FEMA zone X (unshaded) · 99% chance over 30 yrs
- Wildfire 3/10 Moderate
- Heat 5/10 Major 7 d/yr ≥104°F today · 18 d/yr by 30 yrs out
- Wind 4/10 Moderate 23% chance of damaging wind over 30 yrs
- Air quality 5/10 Major 7 unhealthy d/yr today · 10 by 30 yrs out
Nearby sold comps map
Loading sold comps map…
Walkable amenities ~0.75 mi
Loading nearby amenities…
Taxation est. · year 1
- Rental income
- $26,504
- − Mortgage interest
- −$14,284
- − Property taxes
- −$4,590
- − Insurance
- −$2,072
- − Repairs & maintenance
- −$2,120
- − Management
- −$2,120
- − Depreciation
- −$7,418
- Taxable loss
- −$6,101
- Est. tax savings @ 24.0%
- +$1,464
- After-tax cash flow
- $-307/yr
For passive investors: Depreciation is non-cash, so a rental often shows a tax loss while cash-flowing — sheltering income. Rental losses are passive: they offset passive income freely, and up to $25,000/yr can offset ordinary (W-2) income if you actively participate and your MAGI is under $100k (phasing out to $0 by $150k); unused losses carry forward. On sale, claimed depreciation is recaptured at up to 25%, and gains may owe capital-gains tax (a 1031 exchange can defer both). Figures are a year-1 estimate at your 24.0% rate — not tax advice; consult a CPA.
Schools (NCES district)
- District
- Dekalb County
- NCES district ID
- 1301740
- Math proficiency
- 19% ▼ -12.00%
- Reading proficiency
- 28% ▼ -7.00%
- Median HH income
- $51,448
- Composite
- 20.92/100
- National rank
- #8482
- State rank
- #125 of 174 in GA
Livability — Stone Mountain
- Score
- 79/100
- State rank
- #11
- US rank
- #1977
Category grades
Schools grade is shown separately in the Schools card above.
Census & demographics
- County
- Dekalb County · 782,738 people
- City population
- 130,941
- Metro
- Atlanta-Sandy Springs-Alpharetta, GA
- Population (ZIP)
- 38,977
- Household income
- $96,491
- Rent vs Own
- Severe rent burden
- 780.0
Population outlook (DeKalb County) Hauer SSP2
- Today (2025)
- 839,977 people
- By 2030
- 891,768 · +6.2%
- By 2040
- 988,894 · +17.7%
- By 2050
- 1,074,583 · +27.9%
- By 2075
- 1,245,026 · +48.2%
- By 2100
- 1,303,135 · +55.1%
Race, ethnicity, and origin ACS 2023
- Neighborhood character
- Diverse neighborhood (Simpson 0.56)
- Race & ethnicity
- Black 62% White 22% Asian 6% Hispanic / Latino 5% Two or more races 5%
- Common ancestry
- Slovak 1% Lithuanian 1% Serbian 1%
- Foreign-born
- 14% · Canada, China, South Korea
- Languages at home
- 86% English-only · Spanish 5% Other Indo-European 2% Other Asian/Pacific 1%
Political lean MEDSL · DeKalb
- 2024 margin
- Solid D (+64.8) · D 81.9% · R 17.1% · Other 1.0%
- 2008→2024 swing
- +6.1pp toward D · 2008: 58.6pp · 2024: 64.8pp
- All cycles
- 2024: D+64.8 2020: D+67.4 2016: D+64.8 2012: D+56.8 2008: D+58.6
Not yet ingested
- Civics
- —
Market trends
- HPI YoY
- ▼ -228.39%
- Current HPI
- 204.2122
- Rent YoY
- ▲ 1.30%
- Metro
- Atlanta-Sandy Springs-Alpharetta, GA
- State GDP YoY
- ▲ 2.66%
- F500 in state
- 28
Industry mix (Fortune 500 HQ in GA)
| Industry | F500 HQs | Revenue |
|---|---|---|
| Paper / Packaging | 2 | $29B |
|
||
| Retail | 1 | $160B |
|
||
| Transportation / Logistics | 1 | $91B |
|
||
| Airlines | 1 | $62B |
|
||
| Consumer Goods | 1 | $47B |
|
||
| Utilities | 1 | $25B |
|
||
Price history
+227.3% since first listed17 events — show timeline
- 2026-05-16 Pending — GAMLS
- 2026-05-16 Pending — FMLS
- 2026-02-13 Listed $255,000 FMLS
- 2026-02-13 Listed $255,000 GAMLS
- 2018-03-21 Listing Removed — GAMLS
- 2018-02-07 Relisted — GAMLS
- 2018-01-29 Pending — GAMLS
- 2018-01-26 Relisted — GAMLS
- 2018-01-25 Pending — GAMLS
- 2018-01-16 Listed $119,900 GAMLS
- 2015-04-20 Listing Removed — GAMLS
- 2015-02-05 Contingent — GAMLS
- 2015-01-17 Price Changed $54,900 GAMLS
- 2015-01-14 Listed $59,900 GAMLS
- 1997-02-26 Sold (Public Records) $95,000 Public Records
- 1988-02-18 Sold (Public Records) $79,900 Public Records
- 1985-07-30 Sold (Public Records) $77,900 Public Records
Property tax history
+3.7%/yrLatest (2025): $4,590 · +26.9% YoY. Source: county tax records.
Cash-flow waterfall
monthlySold comps — $/sqft
last 12 mo · ≤1 miLoading sold comps…