 Multi-family
37 S Rural St · Indianapolis city (balance), IN
Flood risk 5/10 · Moderate
- FEMA flood zone
- X (unshaded)
- Chance of flooding over 30 yrs
- 0.48%
- Est. flood insurance / yr
- $507 – $1,088
Fire risk 1/10 · Minimal
- Est. fire insurance / yr
- $717 – $1,331
Heat risk 3/10 · Minor
- Hot days now (above 101°F)
- 7 days/yr
- Hot days in 30 yrs
- 19 days/yr
Wind risk 2/10 · Minimal
- Chance of severe wind over 30 yrs
- 0.0%
Air-quality risk 4/10 · Minor
- Unhealthy air days now
- 5 days/yr
- Unhealthy air days in 30 yrs
- 7 days/yr
Risk factors via First Street. Map © Google.
Why this score? — see what drove the C+ grade
The composite is a weighted blend of 9 inputs, each scored 0–100. Each bar is that input's sub-score; the figure is the points it added to the 100-point composite (weight × sub-score).
- Cash flow +29.3/30.0
- DSCR +10.0/10.0
- 1% rule +7.5/10.0
- ARV discount +7.5/15.0
- Rent growth +4.3/5.0
- Livability +2.5/5.0
- Condition / age +2.5/5.0
- Schools +1.4/10.0
- Appreciation +0.0/10.0
$230,000
🖨 Deal sheet 📄 Offer letter ✓ Due diligence
Multi-family units
County records classify this as Multi-Family (2-4 Unit). Listing-text estimate: 1 unit. estimate disagrees with records
Listing remarks MLS
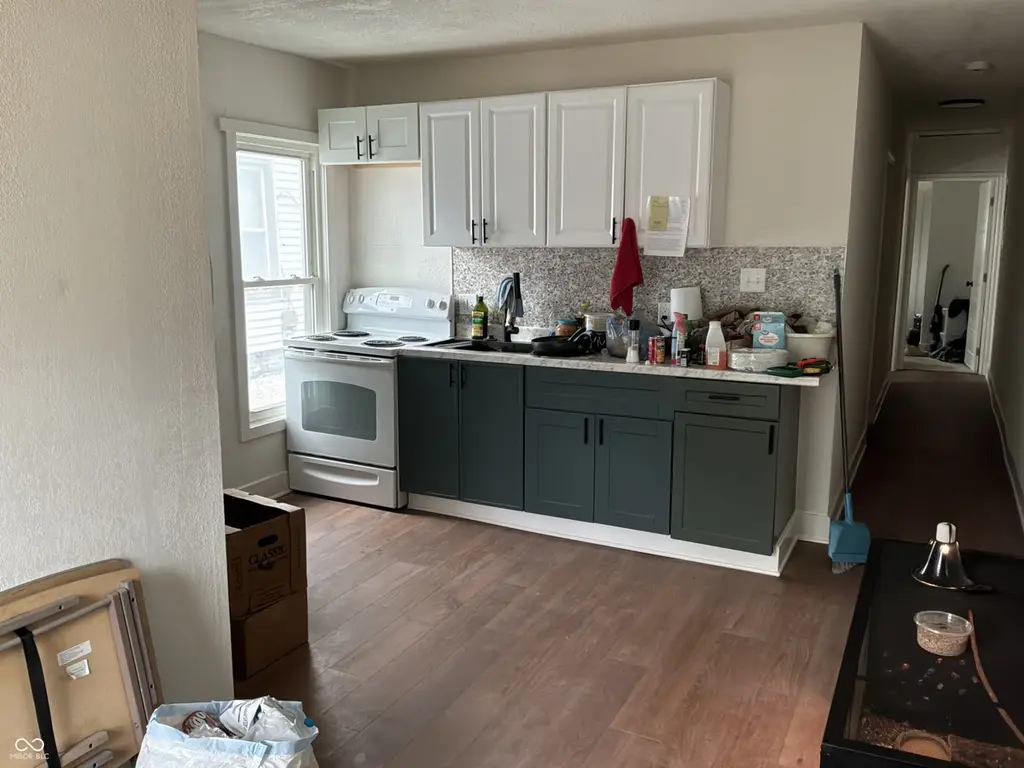
Investor special in Near Eastside! This 1915 duplex offers two 1BR/1BA units across ~1,107 sq. ft. on a 6,011 sq. ft. city lot-ready for a full cosmetic overhaul and your value-add plan. Classic bungalow/shotgun layout, vinyl exterior, fenced front yard, sidewalks, and mature trees. Fix it up and lease both sides for cash flow, or live in one unit and rent the other. Sold as-is and priced for the work-bring your contractor and vision. Convenient city location near downtown corridors, employment centers, and amenities.
Key facts
- Private bedroom
- Modern kitchen
- 6,011 sq ft lot
Tags
Property features AI
Finance
- Other: Zoned C1 - Res Two Family 520; Approximately 0.14 acre lot (under 1/4 acre); Conversion property (was converted); Current use: Residential
- Financial info: Gross income and expenses reported as 0 (multi-family); Two total units
Exterior
- Parking: Detached 2-car garage
- Security: Smoke detector(s)
- Utilities: City water; Sewer
- Home design: Duplex (residential income, converted); One story; Faces west
- Construction: Vinyl siding; Asphalt roof; Crawl space foundation; Built as a duplex
- Exterior features: Front yard fencing; City lot with sidewalks and mature/small trees; Asphalt road frontage
Interior
- Kitchen: Kitchen included in 1-bedroom unit
- Bedrooms: One 1-bedroom unit (one level)
- Heating & cooling: Forced air heating
- Interior features: Smoke detectors
Neighborhood map
What this means for you Summary
Snapshot
- This is a 1-bed/4.0-bath multifamily listed at $230k.
Deal economics
- At list price, monthly cash flow is $806 ($10k/yr) — positive.
- The deal already cash-flows at list — no discount required.
- Meets the 1% rule at list price ($3k rent vs $230k).
- Cap rate 10.5% vs local median 4.4% in Indianapolis city (balance) — top-decile yield for the area; either an underpriced asset or a hidden risk that comps aren't pricing in. Stress-test before assuming the spread holds.
Location & tenants
- Location reads: area grade C — affects rentability + tenant quality, not the cash-flow math above.
- Indianapolis Public Schools (urban): math 14% / reading 20% proficiency, ranked #286 of 301 in IN (top 95%) — low school quality limits family demand, transient renter base, plan for 1-2y turnover; 77% free/reduced lunch — lower-income household profile, screen leases tightly.
- Zoned schools: William Penn School 49 (math 9% / reading 9%, grade F, #935 of 994 statewide, top 94%, 509 students, 78% FRL); Arsenal Technical High School (math 6% / reading 27%, grade F, #353 of 369 statewide, top 96%, 2,366 students, 74% FRL) — zoned schools at 76% FRL track the district average.
- Market conditions: Rents rising fast (+7.3%/yr); 480 active listings in the ZIP; 40 comparable units currently listed for rent nearby; rentals at typical pace (median 24d on market — plan ~3-4 weeks tenant-placement turnaround); 42% of comp listings sitting > 30 days — soft ceiling on asking rent; 1,906 units permitted in Marion County in 2024 (621 in 5+ unit buildings).
- At $2,879/mo this rent would consume 70% of the median local household income ($49k/yr) (locally 1906% of renters already pay >50% of income on rent) — very limited rent-growth headroom before tenants either downsize or default.
Forward outlook
- Local home prices are declining (-3.0%/yr); year-one equity from $2k of loan paydown is wiped out by about $7k of value loss. Plan a longer hold.
- Marion County population projected at +18% by 2050 — long-run rental-demand tailwind backs the buy-and-hold thesis.
- At projected returns (-3.0% appreciation + 7.3% rent growth), your $64k cash investment doubles in ~7 years — after that, you're playing with house money.
Negotiation context
- Only 6 days on market — expect competitive offers; lowballing is unlikely to land.
- 3 sale attempts with the ask held roughly flat each time — persistent listings suggest the price (not the market) is what's stuck; bring a comps-based counter.
- Current owner paid $58k; list at $230k implies a 294% gain — meaningful room to come down on a strong offer.
Risks & watch-outs
- Watch-outs: built in 1915 — expect roof / HVAC / electrical / plumbing capex.
- Climate carrying-cost: moderate flood risk — expect insurance premiums to compound above CPI over the hold.
Questions for the listing agent
- Built in 1915 — when were the roof, HVAC, electrical panel, plumbing, and water heater last replaced?
- Is there a deadline driving the sale (1031 exchange, divorce, estate, relocation)? That informs how much negotiation room exists.
- What's the average days-on-market for RENTAL listings here right now (not sales)? A rising rental-DOM trend means longer vacancies and softer asking-rent achievability than the comps imply.
- What's the recent tenant-quality profile in this submarket — average credit score on applications, eviction rate, late-payment / NSF rate, and stable-employment percentage? A property-management company in the area should have these aggregated.
- How much new apartment / multifamily construction is in the pipeline within 1–3 miles? Heavy new supply (>2% of stock underway) typically softens rents 12–24 months out; light construction supports rent growth.
Investment metrics
- 1% rule
- 1.25% ✓
- Cap rate
- 10.50%
- Cash-on-cash
- 15.03%
- DSCR
- 1.67
- GRM
- 6.7
CMA / ARV
No comps found within radius.
Projected returns pro-forma
-3.0% appreciation · 7.31% rent growth · sell at horizon
- IRR
- 10.2%
- Equity multiple
- 1.42×
- Total profit
- $27,087
- Equity at exit
- $34,294
- IRR
- 22.4%
- Equity multiple
- 3.30×
- Total profit
- $148,028
- Equity at exit
- $19,886
Cash invested: $64,400 (down + closing). Projections, not guarantees.
Landlord ↔ Tenant lean methodology
- Overall (STATE)
- 90 Strongly Landlord-Friendly
- State Indiana
- 90 Strongly Landlord-Friendly · R+11
- County
- — inherits STATE
- City
- — inherits STATE
ZIP-level market 46201
- Home prices YoY
- -33.9%
- Rents YoY
- 7.3%
- Active inventory
- 480
- Price-to-rent
- 13.3×
Monthly cashflow live
- Estimated rent
- $2,879 medium interval (Pro) →
- Mortgage (P&I)
- −$1,206
- Tax from tax record
- −$166 /mo · $1,992/yr
- Insurance
- −$96
- HOA
- −$0
- Vacancy / Maint / Mgmt
- −$605
- Net cashflow
- $806
Break-even live
2-unit breakdown (identical units grouped — click to expand)
| Units | Beds | Baths | Est. rent |
|---|---|---|---|
| 2× units | 3 | 2 | $2,880 |
| #1 | 3 | 2 | $1,440 |
| #2 | 3 | 2 | $1,440 |
| Total (2 units) | $2,879 | ||
UW: 25.0% down · 7.5% · 30yr · 1.5% tax · 5.0% vac · 8.0% maint · 8.0% mgmt
Financing live
Cash to close
- Down payment
- $57,500
- Closing costs
- $6,900
- Reserves months
- —
- Total cash needed
- —
Loan-product check · same deal, 3 products live
Conventional
25% down · 7.5% · 30yr
- Down + closing
- —
- Monthly P&I
- —
- Monthly cashflow
- —
- DSCR
- —
- Eligible?
- —
Personal DTI + credit; lowest rate.
DSCR
20% down · 8.5% · 30yr
- Down + closing
- —
- Monthly P&I
- —
- Monthly cashflow
- —
- DSCR
- —
- Eligible?
- —
No personal income docs; deal must DSCR.
Hard money
10% down · 12.0% · 12mo
- Down + closing
- —
- Monthly P&I
- —
- Monthly cashflow
- —
- DSCR
- —
- Eligible?
- —
Short-term bridge; refi at stabilization.
Rent comps 40 comps
| Address | Beds | Baths | Sqft | Rent | $/sqft | DOM | Units | Dist |
|---|---|---|---|---|---|---|---|---|
| 49 S Rural St Indianapolis, IN | 2.0 | 1.5 | 750 | $950 | $1.27 | 10d | 1 | 0.01mi |
| 415 N Oxford St Indianapolis, IN | 1.0 | 1.0 | 580 | $650 | $1.12 | 23d | 1 | 0.44mi |
| 3022 English Ave Unit 3022 Indianapolis, IN | 2.0 | 1.0 | 600 | $650 | $1.08 | 43d | 1 | 0.50mi |
| 2211 E New York St Unit B Indianapolis, IN | 1.0 | 1.0 | 650 | $725 | $1.12 | 21d | 1 | 0.50mi |
| 2034 Southeastern Ave Indianapolis, IN | 1.0 | 1.0 | 525 | $850 | $1.62 | 14d | 1 | 0.61mi |
| 2025 Southeastern Ave Indianapolis, IN | 1.0 | 1.0 | 663 | $775 | $1.17 | 43d | 1 | 0.64mi |
| 628 N Oxford St Indianapolis, IN | 1.0 | 1.0 | 536 | $775 | $1.45 | 23d | 1 | 0.70mi |
| 245 S Randolph St Indianapolis, IN | 2.0 | 1.0 | 720 | $750 | $1.04 | 43d | 1 | 0.73mi |
| 247 S Randolph St Indianapolis, IN | 2.0 | 1.0 | 720 | $750 | $1.04 | 43d | 1 | 0.74mi |
| 37 S Sherman Dr Indianapolis, IN | 1.0 | 1.0 | 700 | $800 | $1.14 | 23d | 1 | 0.75mi |
| 423 Villa Ave Indianapolis, IN | 1.0 | 1.0 | 593 | $799 | $1.35 | 23d | 1 | 0.76mi |
| 1718 Southeastern Ave Indianapolis, IN | 1.0 | 1.0 | 700 | $1,080 | $1.54 | 43d | 1 | 0.77mi |
| 320 N Sherman Dr Unit A Indianapolis, IN | — | 1.0 | 450 | $525 | $1.17 | 4d | 1 | 0.82mi |
| 320 N Sherman Dr Indianapolis, IN | — | 1.0 | 750 | $525 | $0.70 | 43d | 1 | 0.82mi |
| 621 Tecumseh St Indianapolis, IN | 2.0 | 1.0 | 726 | $1,025 | $1.41 | 43d | 1 | 0.87mi |
| 679 Woodruff Place East Dr Indianapolis, IN | 1.0 | 1.0 | 600 | $895 | $1.49 | 23d | 1 | 0.89mi |
| 471 N State Ave Unit 1 Indianapolis, IN | 1.0 | 1.0 | 634 | $785 | $1.24 | 43d | 1 | 0.91mi |
| 412 N Bradley Ave Unit 3 Indianapolis, IN | 2.0 | 1.0 | 700 | $950 | $1.36 | 23d | 1 | 0.91mi |
| 1912 Lexington Ave Unit 1910B Indianapolis, IN | 1.0 | 1.0 | 660 | $850 | $1.29 | 43d | 1 | 0.98mi |
| 1912 Lexington Ave Unit 1912A Indianapolis, IN | — | 1.0 | 660 | $825 | $1.25 | 43d | 1 | 0.98mi |
| 332 N Arsenal Ave Unit A Indianapolis, IN | 2.0 | 1.0 | 750 | $1,150 | $1.53 | 7d | 1 | 0.98mi |
| 330 N Arsenal Ave Unit B Indianapolis, IN | 2.0 | 1.0 | 700 | $1,100 | $1.57 | 7d | 1 | 0.99mi |
| 1413 Washington St Indianapolis, IN | — | 1.0 | 350 | $800 | $2.29 | 43d | 1 | 1.00mi |
| 1515 E Michigan St Apt 2 Indianapolis, IN | 1.0 | 1.0 | 700 | $825 | $1.18 | 20d | 1 | 1.02mi |
| 1022 S Churchman Ave Unit 1024 Indianapolis, IN | 1.0 | 1.0 | 350 | $895 | $2.56 | 43d | 1 | 1.04mi |
| 784 Woodruff Place Middle Dr Indianapolis, IN | 1.0 | 1.0 | 750 | $1,300 | $1.73 | 43d | 1 | 1.04mi |
| 1329 E Market St Unit 8 Indianapolis, IN | 1.0 | 1.0 | 480 | $945 | $1.97 | 21d | 1 | 1.05mi |
| 815 Dawson St Unit 2 Indianapolis, IN | 2.0 | 1.0 | 600 | $1,300 | $2.17 | 4d | 1 | 1.05mi |
| 821 N Bradley Ave Indianapolis, IN | 1.0 | 1.0 | 663 | $850 | $1.28 | 4d | 1 | 1.12mi |
| 1114 N Dearborn St Indianapolis, IN | 1.0 | 1.0 | 646 | $795 | $1.23 | 44d | 1 | 1.13mi |
| 1036 N Tuxedo St Indianapolis, IN | 1.0 | 1.0 | 646 | $750 | $1.16 | 4d | 1 | 1.13mi |
| 1028 N Olney St Unit 1030 Indianapolis, IN | 1.0 | 1.0 | 700 | $800 | $1.14 | 23d | 1 | 1.14mi |
| 1023 S State Ave Indianapolis, IN | 1.0 | 1.0 | 600 | $1,099 | $1.83 | 23d | 1 | 1.21mi |
| 1106 N Gale St Unit 3 Indianapolis, IN | — | 1.0 | 400 | $650 | $1.62 | 4d | 1 | 1.21mi |
| 1106 N Gale St Unit 1 Indianapolis, IN | 2.0 | 1.0 | 750 | $895 | $1.19 | 43d | 1 | 1.21mi |
| 1117 E Market St Indianapolis, IN | 2.0 | 1.0–2.0 | 803 | $1,592 | $1.98 | 3d | 15 | 1.22mi |
| 1315 N Rural St Indianapolis, IN | 1.0 | 1.0 | 700 | $1,000 | $1.43 | 4d | 1 | 1.26mi |
| 927 N Chester Ave Indianapolis, IN | 1.0 | 1.0 | 596 | $750 | $1.26 | 43d | 1 | 1.29mi |
| 1301 N Olney St Unit 1303 Indianapolis, IN | 2.0 | 1.0 | 750 | $1,100 | $1.47 | 43d | 1 | 1.32mi |
| 833 N Gladstone Ave Indianapolis, IN | 1.0 | 1.0 | 687 | $825 | $1.20 | 23d | 1 | 1.33mi |
Listing history 6 events
-
2026-06-16status $230,000 Pending 6 DOM
-
2026-06-15days on market $230,000 Active 6 DOM
-
2026-06-13days on market $230,000 Active 4 DOM
-
2026-06-13days on market $230,000 Active 3 DOM
-
2026-06-10remarks 695-char remark
-
2026-06-10$230,000 Active 1 DOM
ⓘ Source: listings_history table (triggers on properties + properties_extension) + one-shot
backfill from property_details.listing_events for pre-trigger history.
Tax reassessment forecast IN · Partial reset (capped growth)
- Current annual tax
- $1,992 · $166/mo
- Projected year-2 tax
- $1,992 · $166/mo
- Expected delta
- $0/yr ($0/mo · 0.0%)
ⓘ Screening estimate from a state-policy table — verify with the county assessor before closing.
Climate risk First Street
- Flood 5/10 Major FEMA zone X (unshaded) · 48% chance over 30 yrs
- Wildfire 1/10 Low
- Heat 3/10 Moderate 7 d/yr ≥101°F today · 19 d/yr by 30 yrs out
- Wind 2/10 Low 0% chance of damaging wind over 30 yrs
- Air quality 4/10 Moderate 5 unhealthy d/yr today · 7 by 30 yrs out
Nearby sold comps map
Loading sold comps map…
Walkable amenities ~0.75 mi
Loading nearby amenities…
Taxation est. · year 1
- Rental income
- $34,548
- − Mortgage interest
- −$12,884
- − Property taxes
- −$1,992
- − Insurance
- −$1,150
- − Repairs & maintenance
- −$2,764
- − Management
- −$2,764
- − Depreciation
- −$6,691
- Taxable income
- $6,304
- Est. tax owed @ 24.0%
- −$1,513
- After-tax cash flow
- $8,164/yr
For passive investors: Depreciation is non-cash, so a rental often shows a tax loss while cash-flowing — sheltering income. Rental losses are passive: they offset passive income freely, and up to $25,000/yr can offset ordinary (W-2) income if you actively participate and your MAGI is under $100k (phasing out to $0 by $150k); unused losses carry forward. On sale, claimed depreciation is recaptured at up to 25%, and gains may owe capital-gains tax (a 1031 exchange can defer both). Figures are a year-1 estimate at your 24.0% rate — not tax advice; consult a CPA.
Schools (NCES district)
- District
- Indianapolis Public Schools
- NCES district ID
- 1804770
- Math proficiency
- 14% ▼ -7.00%
- Reading proficiency
- 20% ▼ -3.00%
- Median HH income
- $32,034
- Composite
- 13.69/100
- National rank
- #9499
- State rank
- #286 of 301 in IN
Livability — Indianapolis city (balance)
No livability data for this city. (Only ~50 U.S. cities are tracked.)
Census & demographics
- Census place
- Indianapolis city (balance), IN
- County
- Marion County · 998,460 people
- City population
- 881,119
- Metro
- Indianapolis-Carmel-Anderson, IN
- Population (ZIP)
- 30,335
- Household income
- $49,195
- Rent vs Own
- Severe rent burden
- 1906.0
Population outlook (Marion County) Hauer SSP2
- Today (2025)
- 1,025,572 people
- By 2030
- 1,065,727 · +3.9%
- By 2040
- 1,141,577 · +11.3%
- By 2050
- 1,208,920 · +17.9%
- By 2075
- 1,367,288 · +33.3%
- By 2100
- 1,438,201 · +40.2%
Race, ethnicity, and origin ACS 2023
- Neighborhood character
- Diverse neighborhood (Simpson 0.63)
- Race & ethnicity
- White 53% Hispanic / Latino 23% Black 18% Two or more races 9%
- Hispanic origin (detail)
- Mexican 14% Puerto Rican 2%
- Common ancestry
- Slovak 2% Lithuanian 2% Italian 1%
- Foreign-born
- 9% · Canada
- Languages at home
- 81% English-only · Spanish 17%
Political lean MEDSL · Marion
- 2024 margin
- Strong D (+27.7) · D 63.0% · R 35.3% · Other 1.7%
- 2008→2024 swing
- -0.7pp no change · 2008: 28.4pp · 2024: 27.7pp
- All cycles
- 2024: D+27.7 2020: D+29.1 2016: D+22.8 2012: D+22.2 2008: D+28.4
Not yet ingested
- Civics
- —
Market trends
- HPI YoY
- ▼ -192.51%
- Current HPI
- 375.0969
- Rent YoY
- ▲ 7.31%
- Metro
- Indianapolis-Carmel-Anderson, IN
- State GDP YoY
- ▲ 2.90%
- F500 in state
- 18
Industry mix (Fortune 500 HQ in IN)
| Industry | F500 HQs | Revenue |
|---|---|---|
| Industrial Machinery | 2 | $37B |
|
||
| Healthcare | 1 | $177B |
|
||
| Pharmaceuticals | 1 | $45B |
|
||
| Metals / Steel | 1 | $18B |
|
||
| Agriculture | 1 | $17B |
|
||
| Packaging | 1 | $12B |
|
||
Price history
+155.8% since first listed8 events — show timeline
- 2026-06-09 Listed $230,000 MIBOR as Distributed by MLS Grid
- 2025-12-02 Sold (MLS) $58,330 MIBOR as Distributed by MLS Grid
- 2025-11-06 Pending — MIBOR as Distributed by MLS Grid
- 2025-10-12 Listed $75,000 MIBOR as Distributed by MLS Grid
- 2025-09-30 Listing Removed — MIBOR as Distributed by MLS Grid
- 2025-09-17 Price Changed $79,900 MIBOR as Distributed by MLS Grid
- 2025-09-03 Price Changed $84,900 MIBOR as Distributed by MLS Grid
- 2025-08-20 Listed $89,900 MIBOR as Distributed by MLS Grid
Property tax history
+9.7%/yrLatest (2025): $1,992 · +36.3% YoY. Source: county tax records.
Cash-flow waterfall
monthlySold comps — $/sqft
last 12 mo · ≤1 miLoading sold comps…