500 Cheyenne Blvd #176 · Nashville-Davidson metropolitan government (balance), TN
Flood risk No data
- FEMA flood zone
- —
- Chance of flooding over 30 yrs
- —
- Est. flood insurance / yr
- —
Fire risk No data
- Est. fire insurance / yr
- —
Heat risk No data
- Hot days now (above threshold)
- —
- Hot days in 30 yrs
- —
Wind risk No data
- Chance of severe wind over 30 yrs
- —
Air-quality risk No data
- Unhealthy air days now
- —
- Unhealthy air days in 30 yrs
- —
Risk factors via First Street. Map © Google.
Why this score? — see what drove the B- grade
The composite is a weighted blend of 9 inputs, each scored 0–100. Each bar is that input's sub-score; the figure is the points it added to the 100-point composite (weight × sub-score).
- Cash flow +28.7/30.0
- 1% rule +10.0/10.0
- DSCR +10.0/10.0
- ARV discount +7.5/15.0
- Condition / age +4.0/5.0
- Livability +2.5/5.0
- Rent growth +2.3/5.0
- Schools +1.4/10.0
- Appreciation +0.0/10.0
$76,995
🖨 Deal sheet 📄 Offer letter ✓ Due diligence
Listing remarks
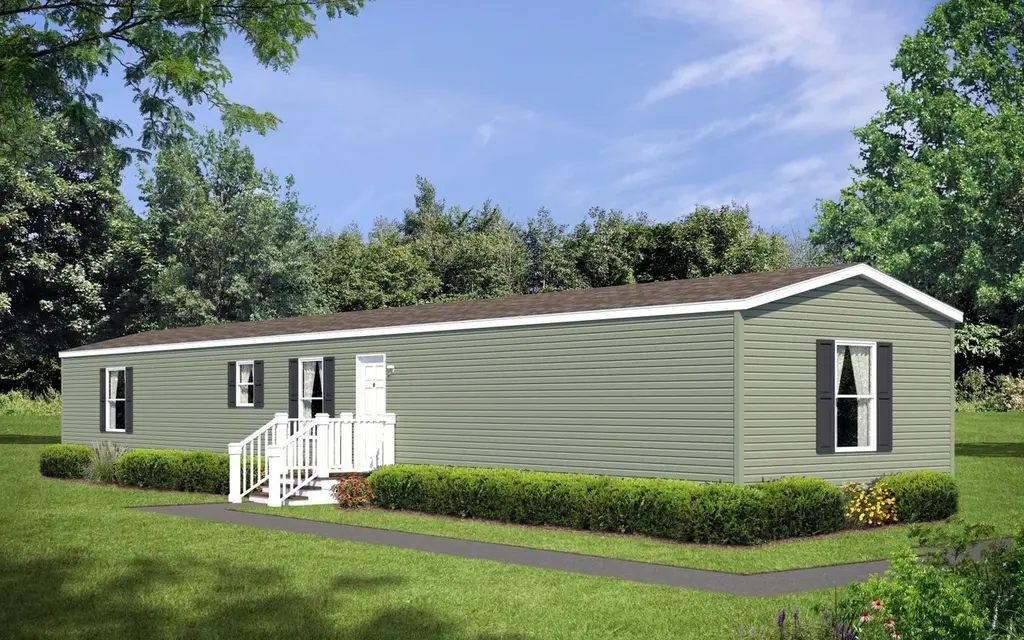
2026 Champion Prime Belmont - 3 Bed, 2 Bath * Exterior home photo is representation, not actual home This brand new double width Belmont model features a spacious 16×76' layout with an open living area, modern kitchen, and three comfortable bedrooms. The bright interior, clean finishes, and efficient floor plan make this home ideal for comfortable everyday living in a peaceful community setting. Community amenities include quiet streets, convenient access to shopping, and essential services in Madison, TN.
Key facts
- Open living area
- Modern kitchen
- Quiet streets
Tags
Property features AI
Finance
- HOA & community: Association fee: $700
Exterior
- Home design: Condominium (unit at 500 Cheyenne Blvd #176); Active listing
- Exterior features: Living area approximately 1493
Interior
- Bedrooms: 3 bedrooms
- Bathrooms: 2 full bathrooms
- Interior features: Spec home (new construction inventory type: Spec); Plan: Apex (Old Hickory)
Neighborhood map
What this means for you Summary
Snapshot
- This is a 3-bed/2.0-bath manufactured listed at $77k. Condition is rated good.
Deal economics
- At list price, monthly cash flow is $256 ($3k/yr) — positive.
- The deal already cash-flows at list — no discount required.
- Meets the 1% rule at list price ($2k rent vs $77k).
- Recommended offer: $75k (3.0% below list) — sets the bar for market timing.
- Cap rate 10.3% vs local median 2.9% in Nashville-Davidson metropolitan government (balance) — top-decile yield for the area; either an underpriced asset or a hidden risk that comps aren't pricing in. Stress-test before assuming the spread holds.
Location & tenants
- Location reads: area grade B — affects rentability + tenant quality, not the cash-flow math above.
- Davidson County (urban): math 12% / reading 19% proficiency, ranked #126 of 139 in TN (top 91%) — low school quality limits family demand, transient renter base, plan for 1-2y turnover; 66% free/reduced lunch — lower-income household profile, screen leases tightly.
- Market conditions: Rents soft (-0.9%/yr); 330 active listings in the ZIP; 23 comparable units currently listed for rent nearby; rentals at typical pace (median 22d on market — plan ~3-4 weeks tenant-placement turnaround); 6,873 units permitted in Davidson County in 2024 (4,138 in 5+ unit buildings).
- This rent runs 41% of the median local income ($55k/yr) — at the standard rent-burdened threshold; future hikes will face affordability resistance.
Forward outlook
- Local home prices are declining (-3.0%/yr); year-one equity from $532 of loan paydown is wiped out by about $2k of value loss. Plan a longer hold.
- Davidson County population projected at +42% by 2050 — long-run rental-demand tailwind backs the buy-and-hold thesis.
Negotiation context
- It's been on market 36 days — a 3% lower offer ($75k) is reasonable based on typical stale-listing flexibility.
Risks & watch-outs
- Watch-outs: HOA is 37% of rent.
Questions for the listing agent
- It's been on market 36 days. Have you received any prior offers? Is the seller open to a 3% concession, seller financing, or rate buy-down credit?
- What does the HOA fee cover, when was the last increase, and are there any pending special assessments or reserve-fund shortfalls?
- Is there a deadline driving the sale (1031 exchange, divorce, estate, relocation)? That informs how much negotiation room exists.
- What's the average days-on-market for RENTAL listings here right now (not sales)? A rising rental-DOM trend means longer vacancies and softer asking-rent achievability than the comps imply.
- What's the recent tenant-quality profile in this submarket — average credit score on applications, eviction rate, late-payment / NSF rate, and stable-employment percentage? A property-management company in the area should have these aggregated.
- How much new for-sale + rental construction is in the pipeline within 1–3 miles? Heavy new supply typically softens prices + rents 12–24 months out; constrained supply supports both.
Investment metrics
- 1% rule
- 2.45% ✓
- Cap rate
- 10.28%
- Cash-on-cash
- 14.25%
- DSCR
- 1.63
- GRM
- 3.4
CMA / ARV
No comps found within radius.
Projected returns pro-forma
-3.0% appreciation · 0.0% rent growth · sell at horizon
- IRR
- -1.6%
- Equity multiple
- 0.94×
- Total profit
- $-1,235
- Equity at exit
- $11,480
- IRR
- 0.4%
- Equity multiple
- 1.02×
- Total profit
- $446
- Equity at exit
- $6,657
Cash invested: $21,559 (down + closing). Projections, not guarantees.
Landlord ↔ Tenant lean methodology
- Overall (STATE)
- 87 Strongly Landlord-Friendly
- State Tennessee
- 87 Strongly Landlord-Friendly · R+13
- County
- — inherits STATE
- City
- — inherits STATE
ZIP-level market 37115
- Rents YoY
- -0.9%
- Active inventory
- 330
- Price-to-rent
- 3.4×
Monthly cashflow live
- Estimated rent
- $1,884 high interval (Pro) →
- Mortgage (P&I)
- −$404
- Tax est. 1.5%
- −$96 /mo · $1,155/yr
- Insurance
- −$32
- HOA
- −$700
- Vacancy / Maint / Mgmt
- −$396
- Net cashflow
- $256
Break-even live
UW: 25.0% down · 7.5% · 30yr · 1.5% tax · 5.0% vac · 8.0% maint · 8.0% mgmt
Financing live
Cash to close
- Down payment
- $19,249
- Closing costs
- $2,310
- Reserves months
- —
- Total cash needed
- —
Loan-product check · same deal, 3 products live
Conventional
25% down · 7.5% · 30yr
- Down + closing
- —
- Monthly P&I
- —
- Monthly cashflow
- —
- DSCR
- —
- Eligible?
- —
Personal DTI + credit; lowest rate.
DSCR
20% down · 8.5% · 30yr
- Down + closing
- —
- Monthly P&I
- —
- Monthly cashflow
- —
- DSCR
- —
- Eligible?
- —
No personal income docs; deal must DSCR.
Hard money
10% down · 12.0% · 12mo
- Down + closing
- —
- Monthly P&I
- —
- Monthly cashflow
- —
- DSCR
- —
- Eligible?
- —
Short-term bridge; refi at stabilization.
Rent comps 23 comps
| Address | Beds | Baths | Sqft | Rent | $/sqft | DOM | Units | Dist |
|---|---|---|---|---|---|---|---|---|
| 1040 N DuPont Ave Madison, TN | 1.0–3.0 | 1.0–3.0 | 944 | $1,350 | $1.43 | 24d | 1 | 0.44mi |
| 110 Archwood Pl Madison, TN | 1.0–2.0 | 1.0–1.5 | 915 | $1,200 | $1.31 | 2d | 6 | 0.51mi |
| 968 Juniper Ln Madison, TN | 4.0 | 2.5 | 1860 | $2,670 | $1.44 | 24d | 1 | 0.53mi |
| 333 Rio Vista Dr Madison, TN | 2.0–3.0 | 1.0 | 899 | $1,782 | $1.98 | 24d | 9 | 0.66mi |
| 218B Myatt Dr Madison, TN | 3.0 | 3.5 | 1614 | $2,500 | $1.55 | 24d | 1 | 0.88mi |
| 2120 Candlebrook Ct Madison, TN | 3.0 | 2.0 | 1179 | $1,895 | $1.61 | 4d | 1 | 0.90mi |
| 208 Jenna Lee Cir Madison, TN | 2.0 | 2.5 | 1156 | $1,975 | $1.71 | 24d | 1 | 0.90mi |
| 221 Rayon Dr Old Hickory, TN | 2.0 | 2.0 | 1429 | $1,695 | $1.19 | 24d | 1 | 0.91mi |
| 2151 Bayport Ave Old Hickory, TN | 3.0 | 3.0 | 1452 | $2,000 | $1.38 | 2d | 1 | 0.93mi |
| 343 Archwood Dr Madison, TN | 3.0 | 2.0 | 1162 | $2,000 | $1.72 | 24d | 1 | 0.97mi |
| 345 Archwood Dr Madison, TN | 3.0 | 2.0 | 1162 | $2,000 | $1.72 | 24d | 1 | 0.98mi |
| 2343 Patrick Ave Old Hickory, TN | 2.0 | 2.5 | 1300 | $1,798 | $1.38 | 4d | 1 | 0.98mi |
| 2343 Patrick Ave Old Hickory, TN | 2.0 | 2.5 | 1300 | $1,798 | $1.38 | 11d | 1 | 0.98mi |
| 720 Carmel Ave Madison, TN | 3.0 | 2.0 | 1424 | $2,100 | $1.47 | 24d | 1 | 1.04mi |
| 215A Nix Dr Madison, TN | 2.0 | 1.5 | 1003 | $1,395 | $1.39 | 24d | 1 | 1.09mi |
| 2600 Eleuthere Ave Old Hickory, TN | 2.0 | 2.5 | 1123 | $1,856 | $1.65 | 20d | 1 | 1.10mi |
| 1301 Neelys Bend Rd Unit A2 Madison, TN | 2.0 | 1.5 | 1104 | $1,225 | $1.11 | 24d | 1 | 1.29mi |
| 1301 Neelys Bend Rd Madison, TN | 2.0 | 1.5 | 1280 | $1,525 | $1.19 | 3d | 1 | 1.29mi |
| 1102 Fowler St Old Hickory, TN | 3.0 | 1.5 | 1020 | $1,395 | $1.37 | 20d | 1 | 1.30mi |
| 607 Brentmeadow Cir Madison, TN | 2.0 | 2.0 | 956 | $940 | $0.98 | 15d | 1 | 1.37mi |
| 926 Idlewild Dr Madison, TN | 3.0 | 2.0 | 1500 | $2,500 | $1.67 | 21d | 1 | 1.39mi |
| 505 Roosevelt Ave Madison, TN | 4.0 | 1.5 | 1423 | $2,145 | $1.51 | 4d | 1 | 1.48mi |
| 600 Rothwood Ave Madison, TN | 1.0–3.0 | 1.0–1.5 | 990 | $1,500 | $1.52 | 3d | 8 | 1.49mi |
HOA detail
- Monthly dues
- $700 · $8,400/yr
Listing history 14 events
-
2026-06-18days on market $76,995 Active 36 DOM
-
2026-06-17days on market $76,995 Active 35 DOM
-
2026-06-16days on market $76,995 Active 34 DOM
-
2026-06-15days on market $76,995 Active 33 DOM
-
2026-06-13days on market $76,995 Active 31 DOM
-
2026-06-13days on market $76,995 Active 30 DOM
-
2026-06-09days on market $76,995 Active 27 DOM
-
2026-06-08days on market $76,995 Active 26 DOM
-
2026-06-07days on market $76,995 Active 25 DOM
-
2026-06-05days on market $76,995 Active 22 DOM
-
2026-06-03days on market $76,995 Active 21 DOM
-
2026-06-02days on market $76,995 Active 20 DOM
-
2026-06-01days on market $76,995 Active 19 DOM
-
2026-05-31days on market $76,995 Active 18 DOM
ⓘ Source: listings_history table (triggers on properties + properties_extension) + one-shot
backfill from property_details.listing_events for pre-trigger history.
Nearby sold comps map
Loading sold comps map…
Walkable amenities ~0.75 mi
Loading nearby amenities…
Taxation est. · year 1
- Rental income
- $22,603
- − Mortgage interest
- −$4,313
- − Property taxes
- −$1,155
- − Insurance
- −$385
- − Repairs & maintenance
- −$1,808
- − Management
- −$1,808
- − HOA
- −$8,400
- − Depreciation
- −$2,240
- Taxable income
- $2,494
- Est. tax owed @ 24.0%
- −$599
- After-tax cash flow
- $2,473/yr
For passive investors: Depreciation is non-cash, so a rental often shows a tax loss while cash-flowing — sheltering income. Rental losses are passive: they offset passive income freely, and up to $25,000/yr can offset ordinary (W-2) income if you actively participate and your MAGI is under $100k (phasing out to $0 by $150k); unused losses carry forward. On sale, claimed depreciation is recaptured at up to 25%, and gains may owe capital-gains tax (a 1031 exchange can defer both). Figures are a year-1 estimate at your 24.0% rate — not tax advice; consult a CPA.
Condition & rehab AI · 12 photos
This brand new double-width Belmont model is move-in ready with a spacious layout, modern kitchen, and three comfortable bedrooms. The home's good condition and neutral paint make it an ideal choice for comfortable everyday living in a peaceful community setting.
Value-add opportunities
- Both Painting the exterior siding — Enhances curb appeal and can increase both resale and rental value
- Both Upgrading the flooring in the bathrooms — Improves the overall aesthetic and can increase both resale and rental value
Renovation cost estimate screening
Value-add ROI direction
- Both Painting the exterior siding — Enhances curb appeal and can increase both resale and rental value ↑
- Both Upgrading the flooring in the bathrooms — Improves the overall aesthetic and can increase both resale and rental value ↑
ⓘ Cost ranges are severity-bucket heuristics (US national rule-of-thumb). Get contractor quotes + a written scope before underwriting a rehab budget.
Schools (NCES district)
- District
- Davidson County
- NCES district ID
- 4703180
- Math proficiency
- 12% ▼ -17.00%
- Reading proficiency
- 19% ▼ -7.00%
- Median HH income
- $48,667
- Composite
- 14.03/100
- National rank
- #9472
- State rank
- #126 of 139 in TN
Livability — Nashville-Davidson metropolitan government (balance)
No livability data for this city. (Only ~50 U.S. cities are tracked.)
Census & demographics
- Census place
- Nashville-Davidson metropolitan government (balance), TN
- County
- Davidson County · 680,067 people
- City population
- 677,595
- Metro
- Nashville-Davidson--Murfreesboro--Franklin, TN
- Population (ZIP)
- 40,615
- Household income
- $54,566
- Rent vs Own
- Severe rent burden
- 2759.0
Population outlook (Davidson County) Hauer SSP2
- Today (2025)
- 808,568 people
- By 2030
- 874,489 · +8.2%
- By 2040
- 1,009,046 · +24.8%
- By 2050
- 1,147,294 · +41.9%
- By 2075
- 1,475,439 · +82.5%
- By 2100
- 1,714,101 · +112.0%
Race, ethnicity, and origin ACS 2023
- Neighborhood character
- Diverse neighborhood (Simpson 0.70)
- Race & ethnicity
- White 37% Black 32% Hispanic / Latino 26% Two or more races 12% Asian 2%
- Hispanic origin (detail)
- Mexican 13% Cuban 2%
- Common ancestry
- Serbian 1% Italian 1% Iranian 1%
- Foreign-born
- 18% · Canada
- Languages at home
- 74% English-only · Spanish 22% Tagalog/Filipino 1% Other Indo-European 1%
Political lean MEDSL · Davidson
- 2024 margin
- Strong D (+27.4) · D 62.7% · R 35.3% · Other 2.0%
- 2008→2024 swing
- +6.5pp toward D · 2008: 21.0pp · 2024: 27.4pp
- All cycles
- 2024: D+27.4 2020: D+32.1 2016: D+26.0 2012: D+18.7 2008: D+21.0
Not yet ingested
- Civics
- —
Market trends
- HPI YoY
- ▼ -259.74%
- Current HPI
- 341.9614
- Rent YoY
- ▼ -0.94%
- Metro
- Nashville-Davidson--Murfreesboro--Franklin, TN
- State GDP YoY
- ▲ 2.78%
- F500 in state
- 22
Industry mix (Fortune 500 HQ in TN)
| Industry | F500 HQs | Revenue |
|---|---|---|
| Healthcare | 3 | $91B |
|
||
| Retail | 3 | $72B |
|
||
| Transportation / Logistics | 1 | $88B |
|
||
| Paper / Packaging | 1 | $19B |
|
||
| Insurance | 1 | $13B |
|
||
| Energy | 1 | $12B |
|
||
Cash-flow waterfall
monthlySold comps — $/sqft
last 12 mo · ≤1 miLoading sold comps…